

Quantitative phase microscopy for non-invasive live cell population monitoring
- PMID: 33627679
- PMCID: PMC7904828
- DOI: 10.1038/s41598-021-83537-x
Quantitative phase microscopy for non-invasive live cell population monitoring
Abstract
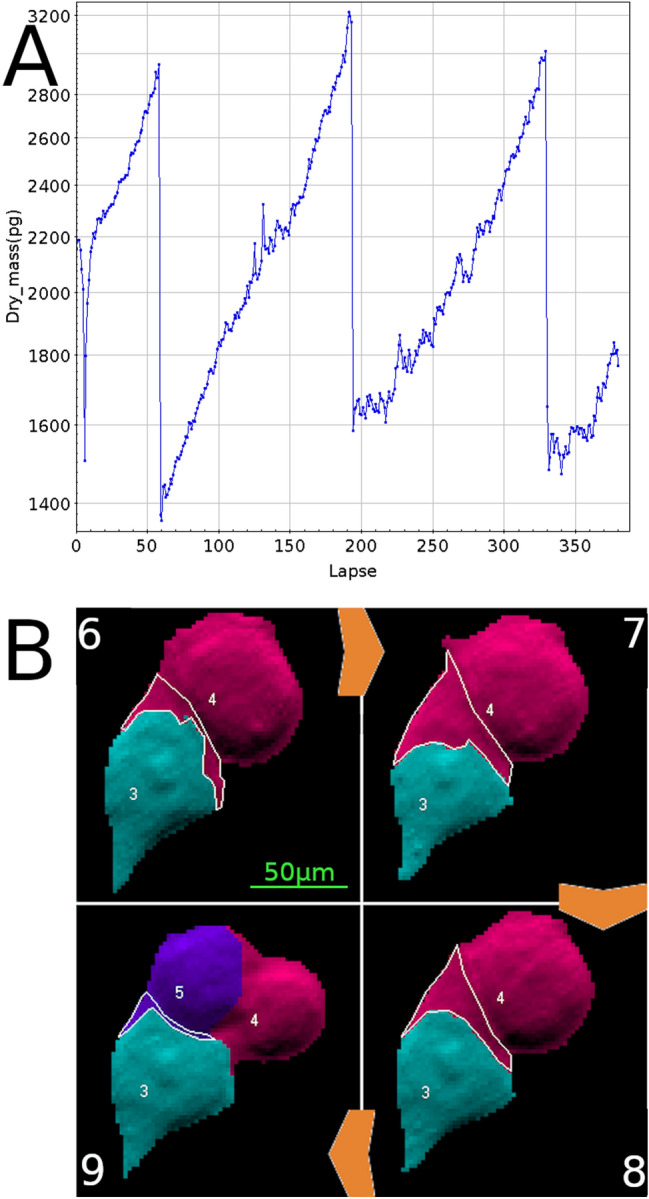
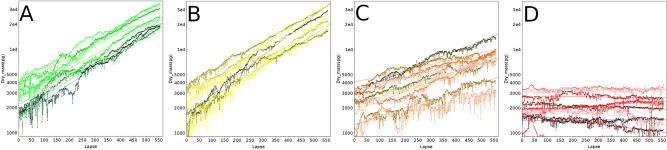
We present here a label-free development based on preexisting Quantitative Phase Imaging (QPI) that allows non-invasive live monitoring of both individual cells and cell populations. Growth, death, effect of toxic compounds are quantified under visible light with a standard inverted microscope. We show that considering the global biomass of a cell population is a more robust and accurate method to assess its growth parameters in comparison to compiling individually segmented cells. This is especially true for confluent conditions. This method expands the use of light microscopy in answering biological questions concerning live cell populations even at high density. In contrast to labeling or lysis of cells this method does not alter the cells and could be useful in high-throughput screening and toxicity studies.
Conflict of interest statement
B.W is Phasics Scientific and Technical Director. S.A, M.Y, Z.D, F.G, M.T, T.P and PP declare no competing interests.
Figures


Similar articles
-
Quantitative Phase Imaging: Recent Advances and Expanding Potential in Biomedicine.ACS Nano. 2022 Aug 23;16(8):11516-11544. doi: 10.1021/acsnano.1c11507. Epub 2022 Aug 2. ACS Nano. 2022. PMID: 35916417 Free PMC article. Review.
-
High-throughput, label-free, single-cell, microalgal lipid screening by machine-learning-equipped optofluidic time-stretch quantitative phase microscopy.Cytometry A. 2017 May;91(5):494-502. doi: 10.1002/cyto.a.23084. Epub 2017 Apr 11. Cytometry A. 2017. PMID: 28399328
-
Multi-ATOM: Ultrahigh-throughput single-cell quantitative phase imaging with subcellular resolution.J Biophotonics. 2019 Jul;12(7):e201800479. doi: 10.1002/jbio.201800479. Epub 2019 Apr 1. J Biophotonics. 2019. PMID: 30719868 Free PMC article.
-
High-throughput microscopy using live mammalian cells.Cold Spring Harb Protoc. 2010 Aug 1;2010(7):pdb.top84. doi: 10.1101/pdb.top84. Cold Spring Harb Protoc. 2010. PMID: 20679389 No abstract available.
-
Automated microscopy for high-content RNAi screening.J Cell Biol. 2010 Feb 22;188(4):453-61. doi: 10.1083/jcb.200910105. J Cell Biol. 2010. PMID: 20176920 Free PMC article. Review.
Cited by
-
Dynamic full-field optical coherence tomography module adapted to commercial microscopes allows longitudinal in vitro cell culture study.Commun Biol. 2023 Sep 28;6(1):992. doi: 10.1038/s42003-023-05378-w. Commun Biol. 2023. PMID: 37770552 Free PMC article.
-
Cell-TypeAnalyzer: A flexible Fiji/ImageJ plugin to classify cells according to user-defined criteria.Biol Imaging. 2022 May 20;2:e5. doi: 10.1017/S2633903X22000058. eCollection 2022. Biol Imaging. 2022. PMID: 38510432 Free PMC article.
-
Dry mass photometry of single bacteria using quantitative wavefront microscopy.Biophys J. 2023 Aug 8;122(15):3159-3172. doi: 10.1016/j.bpj.2023.06.020. Epub 2023 Jun 30. Biophys J. 2023. PMID: 37393431 Free PMC article.
-
Quantitative Phase Imaging: Recent Advances and Expanding Potential in Biomedicine.ACS Nano. 2022 Aug 23;16(8):11516-11544. doi: 10.1021/acsnano.1c11507. Epub 2022 Aug 2. ACS Nano. 2022. PMID: 35916417 Free PMC article. Review.
-
Exploring the role of macromolecular crowding and TNFR1 in cell volume control.Elife. 2024 Sep 19;13:e92719. doi: 10.7554/eLife.92719. Elife. 2024. PMID: 39297502 Free PMC article.
References
-
- Bucevičius J, Lukinavičius G, Gerasimaitė R. The use of Hoechst dyes for DNA staining and beyond. Chemosensors. 2018;6:18. doi: 10.3390/chemosensors6020018. - DOI
Publication types
MeSH terms
LinkOut - more resources
Full Text Sources
Other Literature Sources
