. 2021 Feb 24;11(1):4511.
doi: 10.1038/s41598-021-83904-8.

Behavioral effects of continuous theta-burst stimulation in macaque parietal cortex

Affiliations

Behavioral effects of continuous theta-burst stimulation in macaque parietal cortex

Lara Merken et al. Sci Rep. .

Abstract

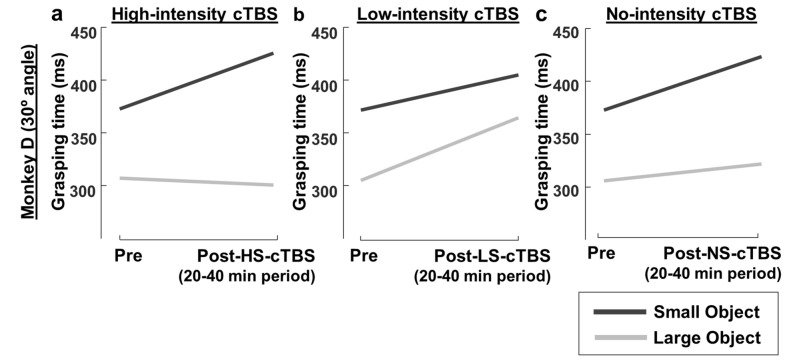
The neural mechanisms underlying the effects of continuous Theta-Burst Stimulation (cTBS) in humans are poorly understood. Animal studies can clarify the effects of cTBS on individual neurons, but behavioral evidence is necessary to demonstrate the validity of the animal model. We investigated the behavioral effect of cTBS applied over parietal cortex in rhesus monkeys performing a visually-guided grasping task with two differently sized objects, which required either a power grip or a pad-to-side grip. We used Fitts' law, predicting shorter grasping times (GT) for large compared to small objects, to investigate cTBS effects on two different grip types. cTBS induced long-lasting object-specific and dose-dependent changes in GT that remained present for up to two hours. High-intensity cTBS increased GTs for a power grip, but shortened GTs for a pad-to-side grip. Thus, high-intensity stimulation strongly reduced the natural GT difference between objects (i.e. the Fitts' law effect). In contrast, low-intensity cTBS induced the opposite effects on GT. Modifying the coil orientation from the standard 45-degree to a 30-degree angle induced opposite cTBS effects on GT. These findings represent behavioral evidence for the validity of the nonhuman primate model to study the neural underpinnings of non-invasive brain stimulation.


Conflict of interest statement

The authors declare no competing interests.

Figures

Figure 1
Figure 1
Baseline grasping times. Bar plot representing the GTs measured for each monkey, separately during the 4 baseline sessions performed with the small (black) and the large object (grey). Our data confirmed Fitts’ law, showing significantly longer GTs when grasping the small object. Asterisks indicate statistical significance (two-sided Wilcoxon Ranksum test; **: p < 0.01).
Figure 2
Figure 2
cTBS effect on grasping time. (a, b) Normalized grasping times for high- (dashed black line), low- (dashed grey line) and no-intensity (solid black line) cTBS as a function of time, for the large object for monkey P (a) and monkey D (b). Grasping times of minimally 1700 trials were averaged in time-epochs of 10 min. (c, d) Grasping times for the small object for monkey P (c) and D (d); same conventions as in (a, b). Asterisks indicate statistical significance (two-sided Wilcoxon Ranksum test, *: p < 0.05, **; p < 0.01). The vertical dashed line represents the stimulation time (cTBS).
Figure 3
Figure 3
cTBS effect on Fitts’ law with a coil angle of 45 degrees. (a, b, c) Average pre-cTBS grasping time compared to the average GT at 20–40 min post-cTBS in monkey P, for the large (gray line) and small object (black line), with a coil angle of 45 degrees, for high-intensity (a), low-intensity (b) and no cTBS (c). (d, e, f) Pre/post-cTBS comparison for monkey D; same conventions as in (a, b, c).
Figure 4
Figure 4
Overtime effects of cTBS on Fitts’ law. (a) Normalized grasping times of the two monkeys combined, when performing the visually-guided grasping task with the large versus the small object under different stimulation conditions: dashed grey line: large object/high-intensity cTBS; dashed black line: small object/high-intensity cTBS; solid grey line: large object/no cTBS; solid black line: small object/no cTBS. (b, c) Same data for the two monkeys separately ((b): monkey P, (c): monkey D). Asterisks indicate statistical strength (two-sided Wilcoxon Ranksum test, *: p < 0.05, **; p < 0.01; high-intensity cTBS time-epochs compared to no-intensity cTBS time-epochs). The vertical dashed line represents the stimulation time (cTBS).
Figure 5
Figure 5
cTBS effect on Fitts’ law with a coil angle of 30 degrees. (a, b, c) Average pre-cTBS grasping time compared to the average GT at 20–40 min post-cTBS, for the large (gray line) and small object (black line), with a coil angle of 30 degrees, for high-intensity (a), low-intensity (b) and no cTBS (c), in monkey D.
Figure 6
Figure 6
Coil angle and cTBS effect on grasping time. (a, b) Average percent change in grasping time (compared to no-stimulation) for high- (a) and low-intensity cTBS (b) when grasping the larger object, in monkey D. Black: 45-degree coil angle. Gray: 30-degree coil angle. The lighter dashed line (horizontal) represents the baseline grasping time. The thicker dashed line (vertical) indicates the stimulation time (cTBS). (c, d) Average percent change in grasping time (compared to no-stimulation) for high- (c) and low-intensity cTBS (d) when grasping the smaller object.
Figure 7
Figure 7
Experimental protocol. (a) Anatomical magnetic resonance image with the parietal area PFG indicated in white. The 25 mm figure-of-eight coil was positioned at a 45-degree angle with respect to the vertical. The white line (indicated by an arrow) represents the center of the TMS coil. (b) Visually-guided grasping task, which required the monkey to reach, grasp and lift an object after a go-signal (dimming of the red laser). (c) Grip types for the two cylindrical objects of different sizes used in the experiments. Grasping the large object (35 mm × 37 mm) elicited a power grip (whole-hand grasp), while the small object (15 mm × 15 mm) required a pad-to-side grip (involving exclusively the index finger and thumb). (d) Stimulation protocol. Our continuous Theta-Burst Stimulation (cTBS) protocol consisted of 50 Hz triplets of pulses applied every 200 ms. In total, 300 pulses were applied for 20 s. (e) Illustration of Fitts’ Law, stating that the time required to move to a target area is a function of the ratio between the distance to the target (D) and the width of the target (W).

References

    1. Hallett M. Transcranial magnetic stimulation and the human brain. Nature. 2000;406:147–150. doi: 10.1038/35018000. - DOI - PubMed
    1. Pascual-Leone A, Walsh V, Rothwell J. Transcranial magnetic stimulation in cognitive neuroscience-virtual lesion, chronometry, and functional connectivity. Curr. Opin. Neurobiol. 2000;10:232–237. doi: 10.1016/S0959-4388(00)00081-7. - DOI - PubMed
    1. Walsh V, Cowey A. Transcranial magnetic stimulation and cognitive neuroscience. Nat. Rev. Neurosci. 2000;1:73–79. doi: 10.1038/35036239. - DOI - PubMed
    1. Gothe J, et al. Changes in visual cortex excitability in blind subjects as demonstrated by transcranial magnetic stimulation. Brain. 2002;125:479–490. doi: 10.1093/brain/awf045. - DOI - PubMed
    1. Rossini PM, Rossi S. Transcranial magnetic stimulation: diagnostic, therapeutic, and research potential. Neurology. 2007;68:484–488. doi: 10.1212/01.wnl.0000250268.13789.b2. - DOI - PubMed

Publication types

LinkOut - more resources