. 2021 Mar;40(11):2065-2080.
doi: 10.1038/s41388-021-01664-1. Epub 2021 Feb 24.

H2A.Z overexpression suppresses senescence and chemosensitivity in pancreatic ductal adenocarcinoma

Affiliations

H2A.Z overexpression suppresses senescence and chemosensitivity in pancreatic ductal adenocarcinoma

P A Ávila-López et al. Oncogene. 2021 Mar.

Abstract

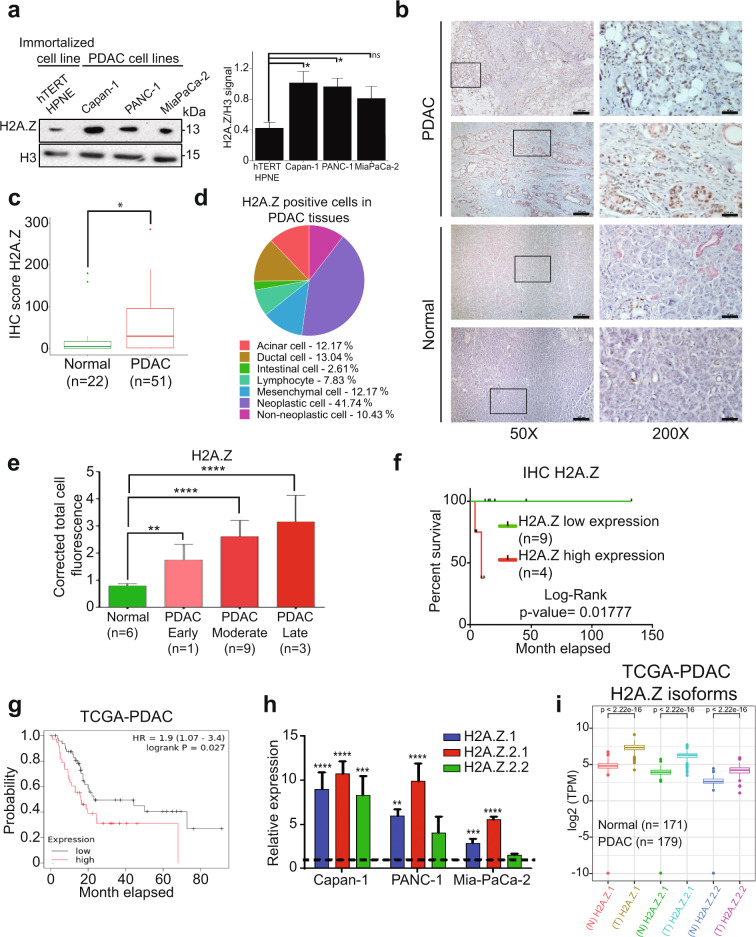
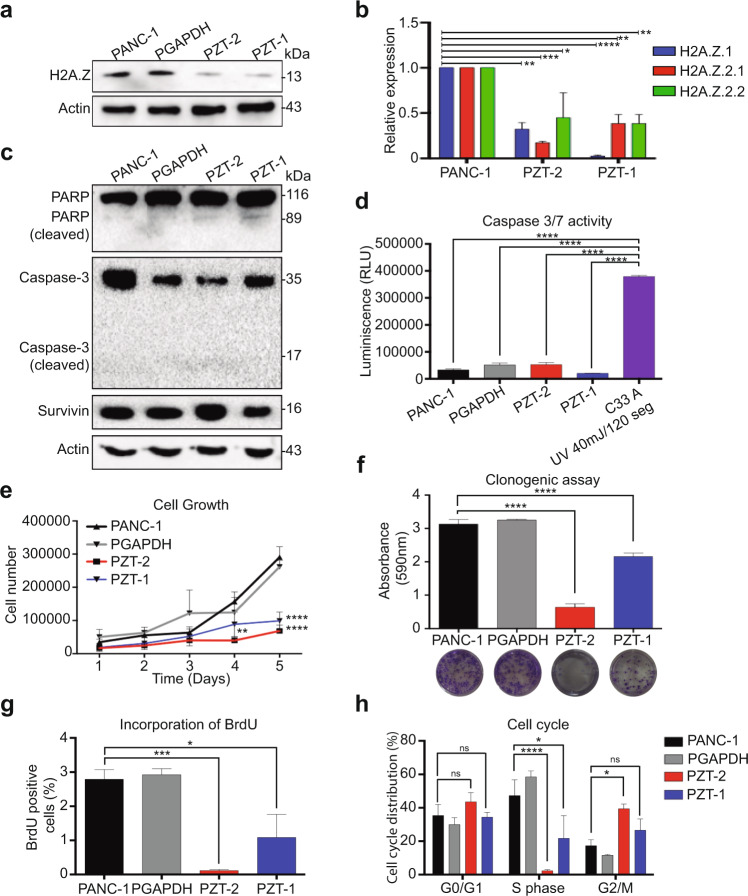
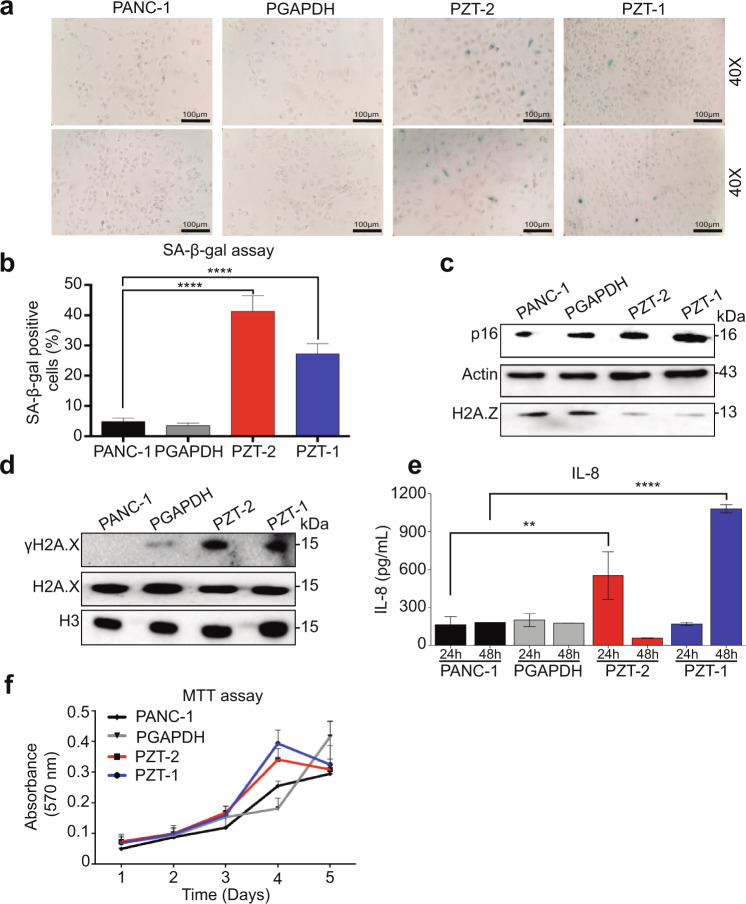
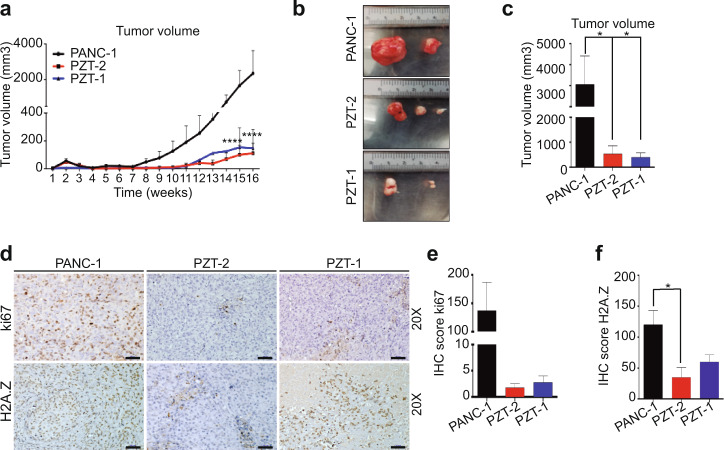
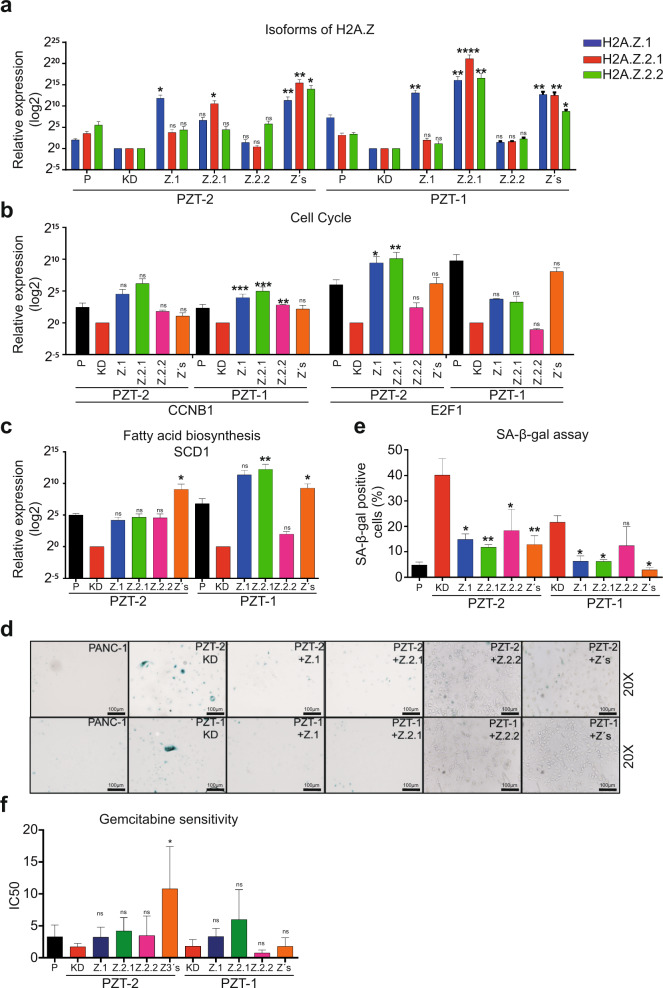
Pancreatic ductal adenocarcinoma (PDAC) is one of the most intractable and devastating malignant tumors. Epigenetic modifications such as DNA methylation and histone modification regulate tumor initiation and progression. However, the contribution of histone variants in PDAC is unknown. Here, we demonstrated that the histone variant H2A.Z is highly expressed in PDAC cell lines and PDAC patients and that its overexpression correlates with poor prognosis. Moreover, all three H2A.Z isoforms (H2A.Z.1, H2A.Z.2.1, and H2A.Z.2.2) are highly expressed in PDAC cell lines and PDAC patients. Knockdown of these H2A.Z isoforms in PDAC cell lines induces a senescent phenotype, cell cycle arrest in phase G2/M, increased expression of cyclin-dependent kinase inhibitor CDKN2A/p16, SA-β-galactosidase activity and interleukin 8 production. Transcriptome analysis of H2A.Z-depleted PDAC cells showed altered gene expression in fatty acid biosynthesis pathways and those that regulate cell cycle and DNA damage repair. Importantly, depletion of H2A.Z isoforms reduces the tumor size in a mouse xenograft model in vivo and sensitizes PDAC cells to gemcitabine. Overexpression of H2A.Z.1 and H2A.Z.2.1 more than H2A.Z.2.2 partially restores the oncogenic phenotype. Therefore, our data suggest that overexpression of H2A.Z isoforms enables cells to overcome the oncoprotective barrier associated with senescence, favoring PDAC tumor grow and chemoresistance. These results make H2A.Z a potential candidate as a diagnostic biomarker and therapeutic target for PDAC.


Conflict of interest statement

The authors declare that they have no conflict of interest.

Figures

Fig. 1
Fig. 1. The three H2A.Z isoforms are overexpressed in PDAC cell lines and in PDAC patients.
a Histone-enriched protein extracts from PDAC cell lines and the non-cancerous hTERT-HPNE cell line were analyzed by western blot using an anti-H2A.Z antibody. H3 was used as loading control. The graph shows the WB quantification depicting means ± SEM of four biological replicates. Statistical differences between two groups were evaluated using two-way ANOVA. *p value ≤ 0.05. b Normal and PDAC tissues were analyzed by IHC using an anti-H2A.Z antibody (color brown) and an anti-CK7 antibody (pink). Two representative images of PDAC and control samples at 50× are shown. The magnifications at 200× on the right correspond to the squares on the left. Scale bars = 50 μm. c IHC scores of H2A.Z staining in normal and PDAC tissues. Statistical differences between the two groups were evaluated by unpaired two-tailed Student’s t test. *p value ≤ 0.05. d Percentage of H2A.Z-positive cells. e Corrected total cell fluorescence of H2A.Z in different stages of PDAC progression. Statistical differences between two groups were evaluated using two-way ANOVA. **p value ≤ 0.01; ***p value ≤ 0.001. f Kaplan–Meier curves generated using the H2A.Z IHC score showing the average survival of Mexican PDAC patients. Log-Rank analysis gave a p value = 0.01777. g Kaplan–Meier curves generated using expression data from TCGA database. The graph shows the average survival of 90 PDAC patients with low levels of both H2A.Z isoforms (gray) and 53 PDAC patients with high levels of both H2A.Z isoforms (red). Log-Rank analysis gave a p value = 0.027. h Expression of the isoforms H2A.Z.1, H2A.Z.2.1, and H2A.Z.2.2 were analyzed by RT-qPCR in the cell lines CAPAN-1, PANC-1 and Mia-PaCa-2. Relative expression values normalized to the non-cancerous cell line hTERT-HPNE (dotted line). The means ± SEM of three biological replicates is shown. Two-way ANOVA analysis gave p values of: **p = 0.0085; ***p = < 0.001 ****p ≤ 0.0001. i Expression analysis of the three H2A.Z isoforms from the 179 PDAC samples available in the TCGA database, and 171 normal tissues available in the GTEx database. Statistical differences were evaluated by unpaired two-tailed Student’s t test.
Fig. 2
Fig. 2. The knockdown of the three isoforms of H2A.Z induces arrest in the G2/M phase.
a Total extracts of the non-transduced PANC-1 cell line, of the PANC-1 transduced with shRNA directed against GAPDH, and the KD clones PZT-2 and PZT-1 were analyzed by western blot using an anti-H2A.Z antibody (n = 3). Actin was used as loading control. b Expression of H2A.Z.1, H2A.Z.2.1, and H2A.Z.2.2 were analyzed by RT-qPCR in the KD clones PZT-2 and PZT-1. Values are normalized to the expression in the untransduced PANC-1 cell line. GAPDH was used as house-keeping gene. The means ± SEM of three biological replicates is shown. Significance was analyzed using two-way ANOVA: *p value ≤ 0.05; **p value ≤ 0.01; ***p value ≤ 0.001. c Total extracts of the PANC-1 cell line, the PGAPDH cell line and the clones PZT-2 and PZT-1 were analyzed by western blot to identify expression and cleavage of caspase 3, PARP and survivin (n = 3). d PANC-1, PGAPDH, PZT-2, and PZT-1 cell lines present low caspase 3 and 7 activity with respect to C-33A cells in which apoptosis was induced by UV light, n = 3. Significance was analyzed by one-way ANOVA. ****p value ≤ 0.0001. e Cell growth curves of PANC-1, PGAPDH, PZT-2, and PZT-1. The means ± SEM of three biological replicates is shown. Significance was analyzed by two-way ANOVA. ***p value = 0.001; ****p value ≤ 0.0001. f Clonogenic capacity of the cell lines PANC-1, PGAPDH, PZT-1, and PZT-2. The graph shows absorbance at 590 nm of the crystal violet retained in the colonies. The means ± SEM of three biological replicates is shown. Significance was analyzed by one-way ANOVA. ****p value ≤ 0.0001. g Incorporation of BrdU into the cell lines PANC-1, PGAPDH, PZT-2, and PZT-1 24 h after synchronization in G0 by serum starvation for 48 h. The means ± SEM of three biological replicates is shown. Significance was analyzed by one-way ANOVA. *p value = 0.0497. h Distribution of the cell line PANC-1, PGAPDH, PZT-2, and PZT-1 in cell cycle phases G0–G1, S and G2-M as examined by staining with BrdU and IP 24 h after synchronization in G0 by serum starvation for 48 h. The means ± SEM of three biological replicates is shown. Significance was analyzed by two-way ANOVA. *p value = 0.0415; ****p value ≤ 0.0001.
Fig. 3
Fig. 3. The knockdown of the three H2A.Z isoforms induce cellular senescence.
a SA-β-galactosidase activity in PANC-1, PGAPDH, PZT-2, and PZT-1 show senescent cells in blue. Two representative images at 20× and 40× are shown. Scale bar = 100 μm. The means ± SEM of three biological replicates is shown. b Quantification of senescent cells positive for SA-β-galactosidase. Significance was analyzed by one-way ANOVA. ****p value ≤ 0.0001. c, d. Total extracts of PANC-1, PGAPDH, PZT-2, and PZT-1 cell lines were analyzed by western blot using antibodies against the cell cycle inhibitor p16, and H2A.X and γH2A.X, which are associated with DNA damage. Actin was used as loading control (n = 3). e IL-8 levels in cell culture supernatants of PANC-1, PGAPDH, PZT-2, and PZT-1 cells after 24 and 48 h. The means ± SEM of three biological replicates are shown. Significance was analyzed by one-way ANOVA. **p value = 0.0045. f Kinetics of metabolic activity in PANC-1, PGAPDH, PZT-2, and PZT-1 cells as determined by MTT assay. The means ± SEM of three biological replicates is shown. Two-way ANOVA did not yield any significant difference (n = 3).
Fig. 4
Fig. 4. H2A.Z regulates the expression of genes associated with senescence and resistance to gemcitabine.
a RNA-seq heatmap of the expression profile of the 2695 differentially expressed genes in PANC-1 and PZT-2. The differential gene expression presents a false discovery rate (FDR) < 0.05. Overexpressed genes are shown in red and downregulated genes are shown in green. Two biological replicates are shown. b Ontology of genes (biological processes) of the differential gene expression in PZT-2. The overexpressed biological processes are shown in red and the diminished biological processes are shown in green. The enrichment groups have a p value < 0.05. Representative genes of each process are shown. c Gene set enrichment analysis (GSEA) of altered genes in PZT-2. A gene set associated with cellular senescence (GO_CELLULAR_SENESCENCE, Systematic name: M11558) is enriched in PZT-2. FDR = 0.05; FWER p value = 0.02. d Validation of RNA-seq by RT-qPCR for genes associated with senescence. The values are normalized to the untransduced PANC-1 cell line. GAPDH was used as house-keeping gene. The means ± SEM of three biological replicates is shown. Significance was analyzed by two-tailed Student’s t test. *p ≤ 0.05; **p = 0.0011; ***p = 0.0006; ****p ≤ 0.0001. e Heatmap of the differential gene expression profile in PANC-1 and PZT-2 associated with chemoresistance. The differential gene expression presents an FDR < 0.05. Overexpressed genes are shown in red and reduced genes in green. Two biological replicates are shown. f Validation by RT-qPCR for the genes DNM1 and CTSH. The values are normalized to the untransduced PANC-1 cell line. GAPDH was used as house-keeping gene. The means ± SEM of three biological replicates is shown. Significance was analyzed by two-tailed Student’s t value ***p = 0.0004. g Cytotoxicity assay using different gemcitabine concentrations in PANC-1, PZT-1, and PZT-2 cells after 72 h. IC50 values of three biological replicates with gemcitabine are shown. Significance was analyzed by two-tailed Student’s t value **p ≤ 0.01.
Fig. 5
Fig. 5. Depletion of H2A.Z decreases tumor growth.
a Weekly tumor volume from three mice per group subcutaneously injected with 5 × 106 PANC-1, PZT-1, and PZT-2 cells. The means ± SEM of three inoculated mice is shown. Significance was analyzed by two-way ANOVA. *p value = 0.0017; **p value = 0.0189. b Representative images of the tumors from mice injected with PANC-1, PZT-1, and PZT-2 cells. n = 2. c Graph showing the final tumor volume obtained from mice injected with PANC-1, PZT-1, and PZT-2. Means ± SEM are shown. Significance was analyzed by two-tailed Student’s t test. n = 2. d Tumors derived from PANC-1, PZT-1, and PZT-2 cells were immunostained for Ki67 and H2A.Z. H2A.Z knockdown tumors showed lower Ki67 and H2AZ staining than tumors derived from PANC-1 cells. Scale bars = 50 μm. e, f. Immunohistochemical score of Ki67 and H2A.Z signals in the tumors. Statistical differences between the two groups were evaluated by unpaired two-tailed Student’s t test. n = 2.
Fig. 6
Fig. 6. Overexpression of H2A.Z isoforms affects the oncogenic phenotype of PDAC cells.
a Expression of the three H2A.Z isoforms analyzed by RT-qPCR in the KD cell lines PZT-1 and PZT-2 transfected with plasmids coding for H2A.Z.1, H2A.Z.2.1, and H2A.Z.2.2 alone or together (Z3s). The values are normalized to the non-transfected PZT-2 and PZT-1 KD cell lines. GAPDH was used as house-keeping gene. The means ± SEM of three independent experiments is shown. Expression of CCNB1, E2F1 (b) and SCD1 (c) analyzed by RT-qPCR in the KD clones PZT-1 and PZT-2 transfected with H2A.Z.1, H2A.Z.2.1, and H2A.Z.2.2 alone or together as analyzed in (a). n = 3. d SA-β-galactosidase assay performed in the knockdown clones PZT-1 and PZT-2 overexpressing either H2A.Z.1, H2A.Z.2.1, and H2A.Z.2.2 alone or all isoforms together (Z3s). Representative images at 20× are shown. Scale bars = 100 μm. e Quantification of the SA-β-galactosidase assays (means ± SEM of three independent experiments). f Cytotoxicity assay using gemcitabine in the KD clones PZT-1 and PZT-2 transfected with H2A.Z.1 H2A.Z.2.1, and H2A.Z.2.2 alone or together. Cells were incubated in logarithmic concentrations of gemcitabine for 72 h. The IC50 of three biological replicates in two independent experiments are shown. ANOVA analysis gave p values of: *p ≤ 0.05; **p ≤ 0.01; ***p ≤ 0.001 ****p ≤ 0.0001.

References

    1. Neureiter D, Jager T, Ocker M, Kiesslich T. Epigenetics and pancreatic cancer: pathophysiology and novel treatment aspects. World J Gastroenterol. 2014;20:7830–48. doi: 10.3748/wjg.v20.i24.7830. - DOI - PMC - PubMed
    1. Kleeff J, Korc M, Apte M, La Vecchia C, Johnson CD, Biankin AV, et al. Pancreatic cancer. Nat Rev Dis Prim. 2016;2:16022. doi: 10.1038/nrdp.2016.22. - DOI - PubMed
    1. Oldfield LE, Connor AA, Gallinger S. Molecular events in the natural history of pancreatic cancer. Trends Cancer. 2017;3:336–46. doi: 10.1016/j.trecan.2017.04.005. - DOI - PubMed
    1. Rahib L, Smith BD, Aizenberg R, Rosenzweig AB, Fleshman JM, Matrisian LM. Projecting cancer incidence and deaths to 2030: the unexpected burden of thyroid, liver, and pancreas cancers in the United States. Cancer Res. 2014;74:2913–21. doi: 10.1158/0008-5472.CAN-14-0155. - DOI - PubMed
    1. Lomberk G, Blum Y, Nicolle R, Nair A, Gaonkar KS, Marisa L, et al. Distinct epigenetic landscapes underlie the pathobiology of pancreatic cancer subtypes. Nat Commun. 2018;9:1978. doi: 10.1038/s41467-018-04383-6. - DOI - PMC - PubMed

Publication types

MeSH terms