. 2021 Apr;16(4):1995-2022.
doi: 10.1038/s41596-020-00477-y. Epub 2021 Feb 24.

Use of stable isotope-tagged thymidine and multi-isotope imaging mass spectrometry (MIMS) for quantification of human cardiomyocyte division

Affiliations

Use of stable isotope-tagged thymidine and multi-isotope imaging mass spectrometry (MIMS) for quantification of human cardiomyocyte division

Jessie W Yester et al. Nat Protoc. 2021 Apr.

Abstract

Quantification of cellular proliferation in humans is important for understanding biology and responses to injury and disease. However, existing methods require administration of tracers that cannot be ethically administered in humans. We present a protocol for the direct quantification of cellular proliferation in human hearts. The protocol involves administration of non-radioactive, non-toxic stable isotope 15Nitrogen-enriched thymidine (15N-thymidine), which is incorporated into DNA during S-phase, in infants with tetralogy of Fallot, a common form of congenital heart disease. Infants with tetralogy of Fallot undergo surgical repair, which requires the removal of pieces of myocardium that would otherwise be discarded. This protocol allows for the quantification of cardiomyocyte proliferation in this discarded tissue. We quantitatively analyzed the incorporation of 15N-thymidine with multi-isotope imaging spectrometry (MIMS) at a sub-nuclear resolution, which we combined with correlative confocal microscopy to quantify formation of binucleated cardiomyocytes and cardiomyocytes with polyploid nuclei. The entire protocol spans 3-8 months, which is dependent on the timing of surgical repair, and 3-4.5 researcher days. This protocol could be adapted to study cellular proliferation in a variety of human tissues.


Figures

Fig. 1 |
Fig. 1 |. MIMS analysis demonstrates proliferation of white blood cells (WBCs).
15N-thymidine (50 mg/kg/d) was administered orally over 5 d to an infant with tetralogy of Fallot at the age of 3.5 weeks. Peripheral blood was drawn at the age of 7 months. The 12C14N, 31P, and 32S images demonstrate cellular morphology. The hue saturation intensity (HSI) image maps the ratio of 15N/14N. The rainbow scale is set from 0.37% (expressed as 0% above natural ratio) to red, where the ratio is twofold above natural ratio (expressed as 100%). White arrows indicate cells that are 15N-labeled and underwent S-phase during the period of 15N-thymidine administration. Scale bar, 10 μm.
Fig. 2 |
Fig. 2 |. MIMS analysis using ex vivo 15N-thymidine labeling of human fetal myocardium.
Human fetal myocardium was collected at 18 weeks gestation and cultured in the presence of 20 μM 15N-thymidine. Media was changed every 3 d. After 5 d, the myocardium was fixed and analyzed by MIMS. a, Mosaic 15N/14N HSI ratio image in which 50 × 50 μm imaging fields are tiled together. The rainbow scale is set from 0.37% (expressed as 0% above natural ratio) to red, where the ratio is fourfold above natural ratio (expressed as 300%). b, The region contained in the white square was reanalyzed at higher resolution with a 25 × 25 μm imaging field, demonstrating a cluster of 15N-labeled nuclei. Analysis of 500 cardiomyocytes demonstrated 16% of cardiomyocytes in the sample were 15N-positive. For both (a) and (b): scale bar = 10 μm.
Fig. 3 |
Fig. 3 |. Flowchart of the presented protocol to determine cardiomyocyte proliferation and formation of bi- and multinucleated cardiomyocytes and polyploid nuclei.
Infants with tetralogy of Fallot are given 15N-thymidine by mouth. At the time of surgical repair, resected right ventricle myocardium is collected. The tissue is fixed, embedded, and sectioned. Sections are mounted on silicon chips for analysis with MIMS and on glass slides for confocal microscopy analysis of number of nuclei and DNA content (ploidy analysis). Then, using OpenMIMS (a plug in for ImageJ/Fiji), individual nuclei are identified (regions of interest, ROI) and the incorporation of 15N-thymidine is quantified. In sections mounted on glass slides, nuclei are stained using Hoechst, photographed, and aligned with the MIMS images to determine bi- and multinucleation and nuclear ploidy.
Fig. 4 |
Fig. 4 |. Images of myocardial specimens and sections to highlight sample processing.
a, Specimens of freshly resected myocardium in a sample container are kept on ice. The size of the pieces can be estimated by using the diameter of the container (5 cm) as reference. The tissue pieces will be cut into cubes of 1–8 mm size before processing. b, After fixation and embedding, 500 nm sections are prepared. One tissue section adhered to a silicon chip in a capsule ready for shipping to the MIMS center is shown. The section is visualized by Toluidine blue staining. c, For every section placed on a silicon chip (b), 10 sections are placed on glass slides for later analysis by confocal microscopy (c). Scale bar, 100 μm.
Fig. 5 |
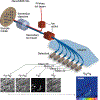
Fig. 5 |. MIMS.
Schematic depicting principles of the NanoSIMS instrument, which is central to MIMS. The surface of a sample is sputtered with a primary cesium ion beam. A fraction of the sputtered surface atoms and small polyatoms are ionized. These secondary ions are extracted by an immersion objective and directed through a series of ionic lenses and slits, shaping and focusing the secondary ion beam in a plane. A double sector mass spectrometer (“magnet”) separates ions by mass in the focusing plane. A series of seven moveable detectors can be aligned to capture data for seven different masses (Unit: Da) from the same sputtered surface material. A quantitative mass image is derived from the counts of each mass. For the purposes of this protocol, only four of the detectors were used. 12C14N, 31P, and 32S images provide histological detail (four black and white images, bottom left). 12C15N and 12C14N measurements are used for the 15N/14N isotope ratio. The isotope ratio can be visually displayed using a hue saturation intensity (HSI) transformation. The bottom right image shows the HSI image from 12C15N and 12C14N measurements shown in the schematic. In this case, the lower bound of the scale (blue) is set at the naturally occurring 15N/14N ratio of 0.37%. The upper bound of the scale is set to demonstrate regional differences in enrichment, such as the 15N-labeled nucleus (white arrows). In this case, the upper bound is set to 0.74% (or 100% above natural background). Importantly, any changes to the scale will affect the color pattern and thus the visual interpretation of the data but the underlying quantitative data remains unmodified. Scale bar, 10 μm.
Fig. 6 |
Fig. 6 |. Integration of 31P, 12C14N, and 12C15N isotope signals to identify DNA synthesis in cardiomyocyte nuclei.
Mosaic (.nrrd) images obtained from MIMS analysis are shown as depicted when using the openMIMS plug-in for ImageJ/Fiji. Regions highlighted by a dashed yellow rectangle are shown at a higher magnification to the right of each panel. a, All nuclei on the 31P MIMS image are identified and outined in red by the user to define regions of interest (ROI). b, ROIs are categorized by the user as cardiomyocyte nuclei, non-cardiomyocyte nuclei, or indeterminate nuclei using the 12C14N images (and/or 32S images, not shown). Far right panel demonstrates the appearance of sarcomeres, which are the defining structural feature of cardiomyocytes. Reanalysis of indeterminant nuclei at higher resolution can clarify cell type. c, The quantitative isotope ratio measurements, which are visually represented by the hue saturation image (HSI), can be extracted for each ROI. Those ROI that demonstrate a 15N/14N ratio above natural background indicate nuclei that underwent DNA replication during 15N-thymidine administration. Scale bar, 10 μm.
Fig. 7 |
Fig. 7 |. Distinguishing cardiomyocyte from non-cardiomyocyte nuclei with additional analysis of 32S images.
12C14N images demonstrate the cellular and subcellular architecture, especially sarcomeres. 31P images highlight the nucleus. 32S images reveal sulfur-rich sarcomere structures, which provide an additional means for identifying cardiomyocytes. a, A 15N-thymidine positive nucleus, identified by using the 15N/14N HSI image, is identified as a cardiomyocyte nucleus. b, A cluster of cells is depicted in which two nuclei demonstrate increased 15N labeling (yellow asterisks). Due to a combination of the sectioning orientation and sectioning artifact (arrows), the cells are categorized as indeterminate and excluded from the analysis. Scale bar, 10 μm.
Fig. 8 |
Fig. 8 |. Alignment of 15N/14N image with Hoechst-stained serial sections for quantification of nuclear ploidy.
a, An identified 15N-thymidine-positive cardiomyocyte nucleus on section k is indicated with a red arrow. The silicon chip used for MIMS imaging (31P, 15N/14N) is referred to as section k. b, Four adjacent sections (k-2, k-1, k+1, k+2, each 500 nm thick) were stained with Hoechst (blue staining) to detect DNA. The sections above the reference section k are k-1, k-2, and sections below are k+1, k+2. A reference pattern (yellow circle) was selected to assist the image alignment. c, To align the orientation of the reference pattern between section k and sections k±2, the Hoechst images were rotated and flipped. Squares outlined with interrupted yellow lines indicate magnified areas shown in (d). d, The nucleus of interest was outlined on the different sections and the Hoechst fluorescence intensities were measured by Fiji. The sum of all four images represents the total fluorescence of the nucleus. Scale bar, 10 μm.
Fig. 9 |
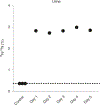
Fig. 9 |. Urinary 15N/14N ratio measurement confirms uptake after oral administration of 15N-thymidine.
During a 5 d oral administration of 15N-thymidine (50 mg/kg body weight) to an infant with ToF, cotton balls were placed in every diaper to collect urine. Urine from each day was pooled. The 15N/14N ratio was analyzed using IRMS. Control samples from the same patient before label administration demonstrated a 15N/14N ratio at natural abundance (0.37%, dashed line). Urine collected during 15N-thymidine labeling demonstrated 15N/14N ratios of approximately 3% (800% above natural background).

References

    1. Duque A. & Rakic P. Different effects of bromodeoxyuridine and [3h]thymidine incorporation into DNA on cell proliferation, position, and fate. J. Neurosci 31, 15205–15217 (2011). - PMC - PubMed
    1. Romar GA, Kupper TS & Divito SJ Research techniques made simple: techniques to assess cell proliferation. J. Invest. Dermatol 136, e1–e7 (2016). - PubMed
    1. Sullivan BA, Hollister-Lock J, Bonner-Weir S. & Weir GC Reduced Ki67 staining in the postmortem state calls into question past conclusions about the lack of turnover of adult human b-cells. Diabetes 64, 1698–1702 (2015). - PMC - PubMed
    1. Peck M. et al. Applications of PET imaging with the proliferation marker [18 F]-FLT. Q. J. Nucl. Med. Mol. Imaging 59, 95–104 (2015). - PMC - PubMed
    1. Costantini DL et al. A pilot study of 18F-FLT PET/CT in pediatric lymphoma. Int. J. Mol. Imaging 2016, 1–5 (2016). - PMC - PubMed

Publication types

LinkOut - more resources