. 2021 Mar;591(7851):633-638.
doi: 10.1038/s41586-021-03241-8. Epub 2021 Feb 24.

Multi-kingdom ecological drivers of microbiota assembly in preterm infants

Affiliations

Multi-kingdom ecological drivers of microbiota assembly in preterm infants

Chitong Rao et al. Nature. 2021 Mar.

Abstract

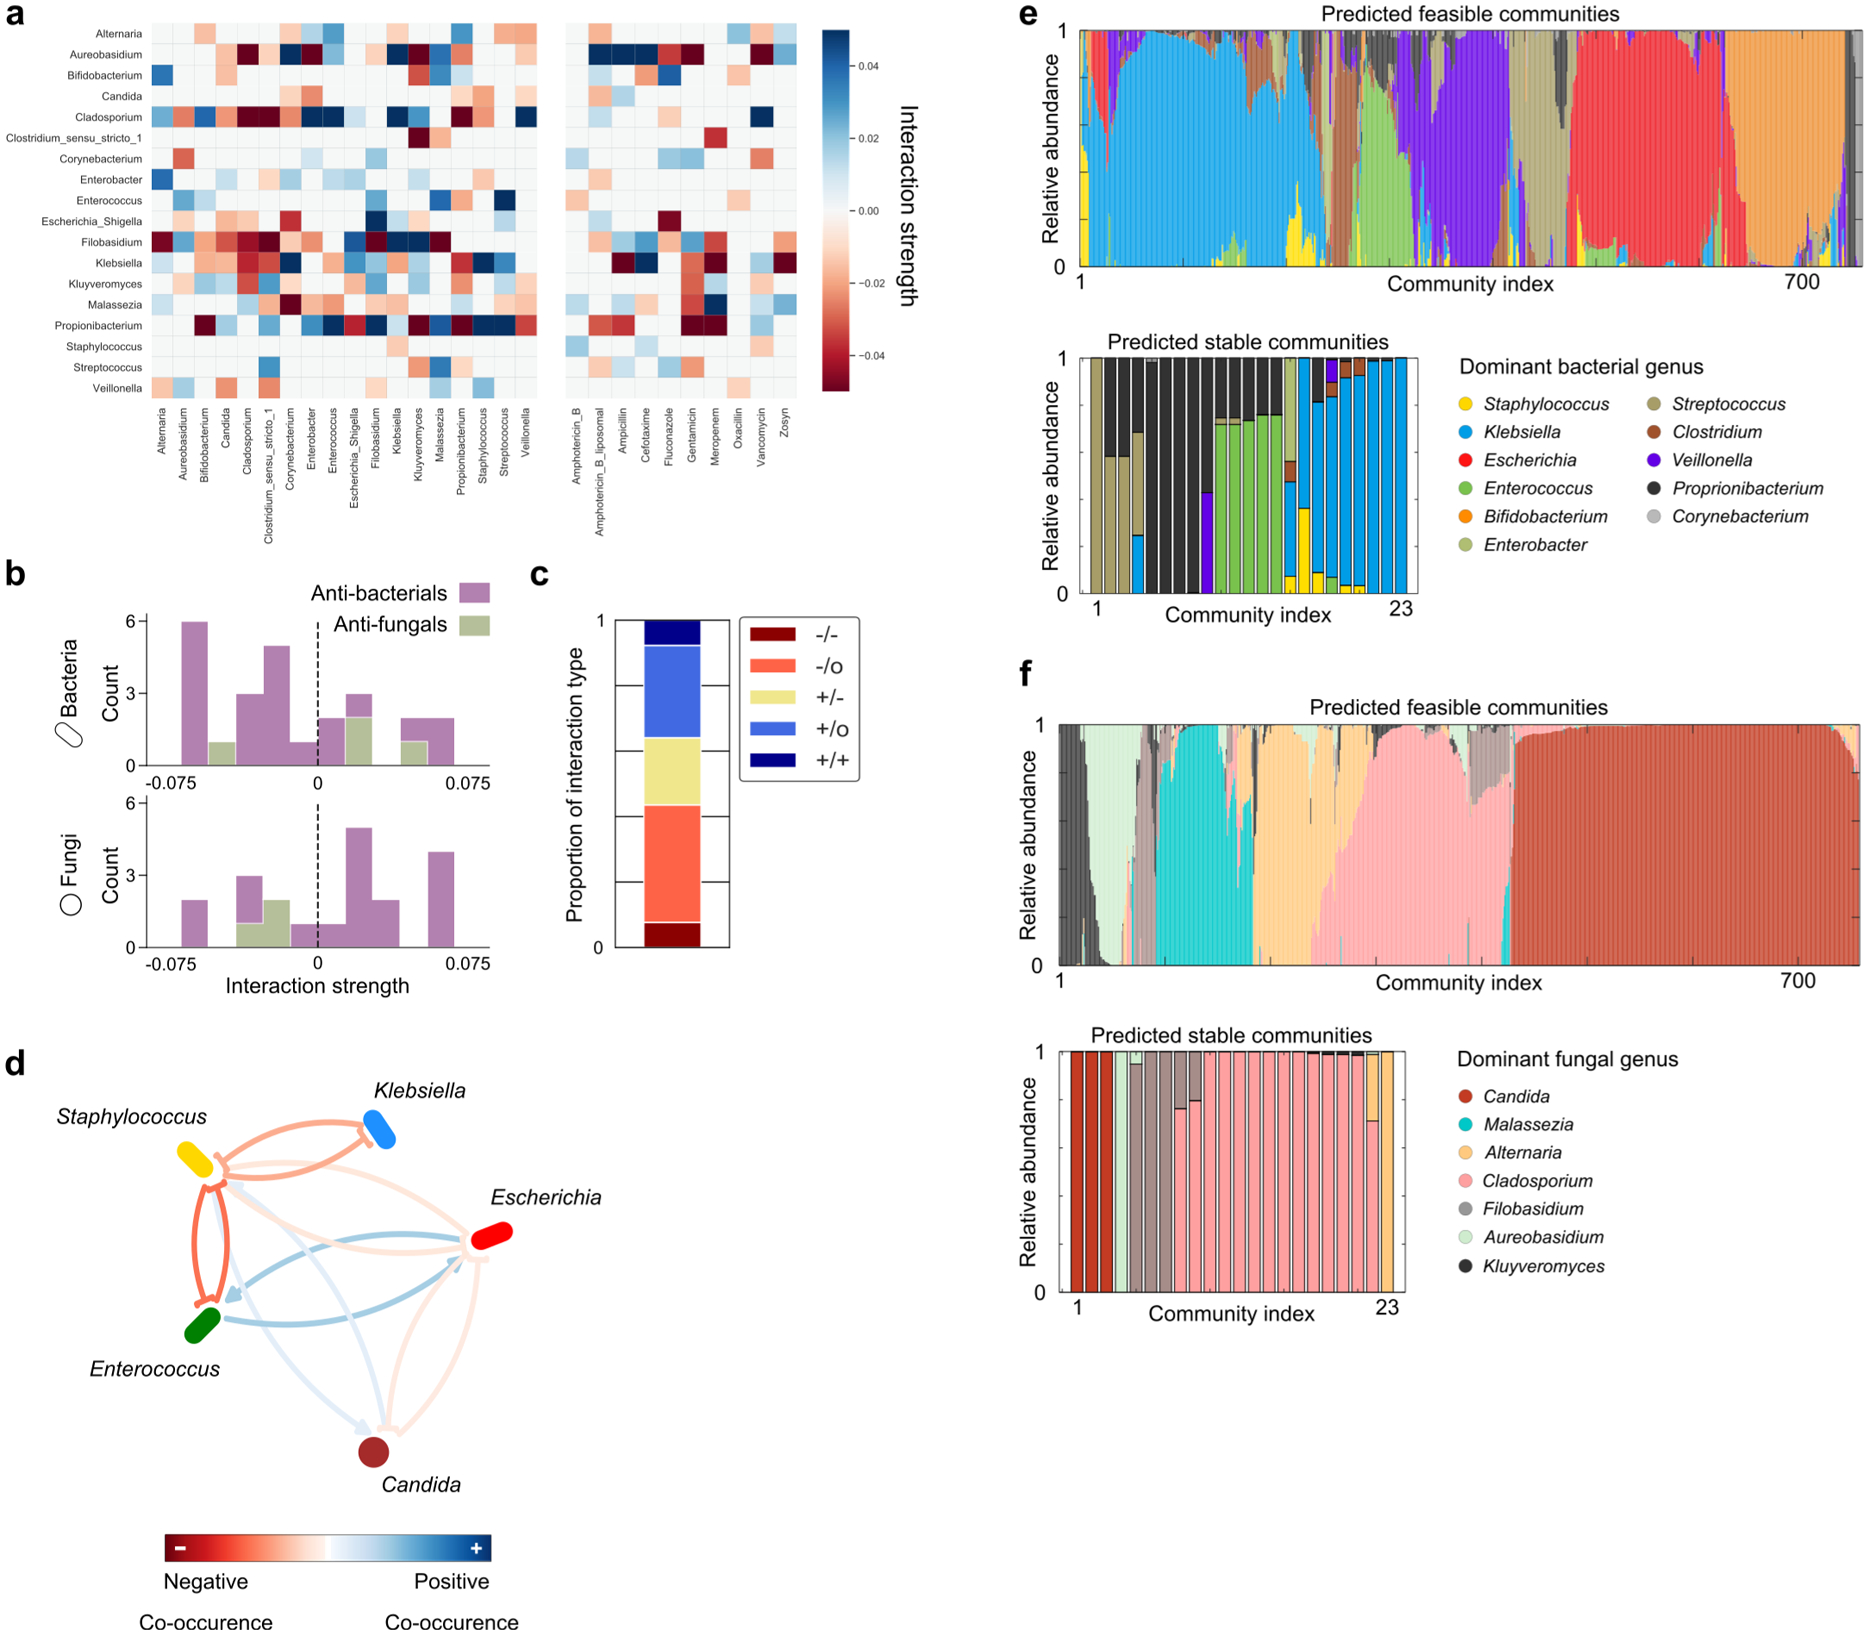
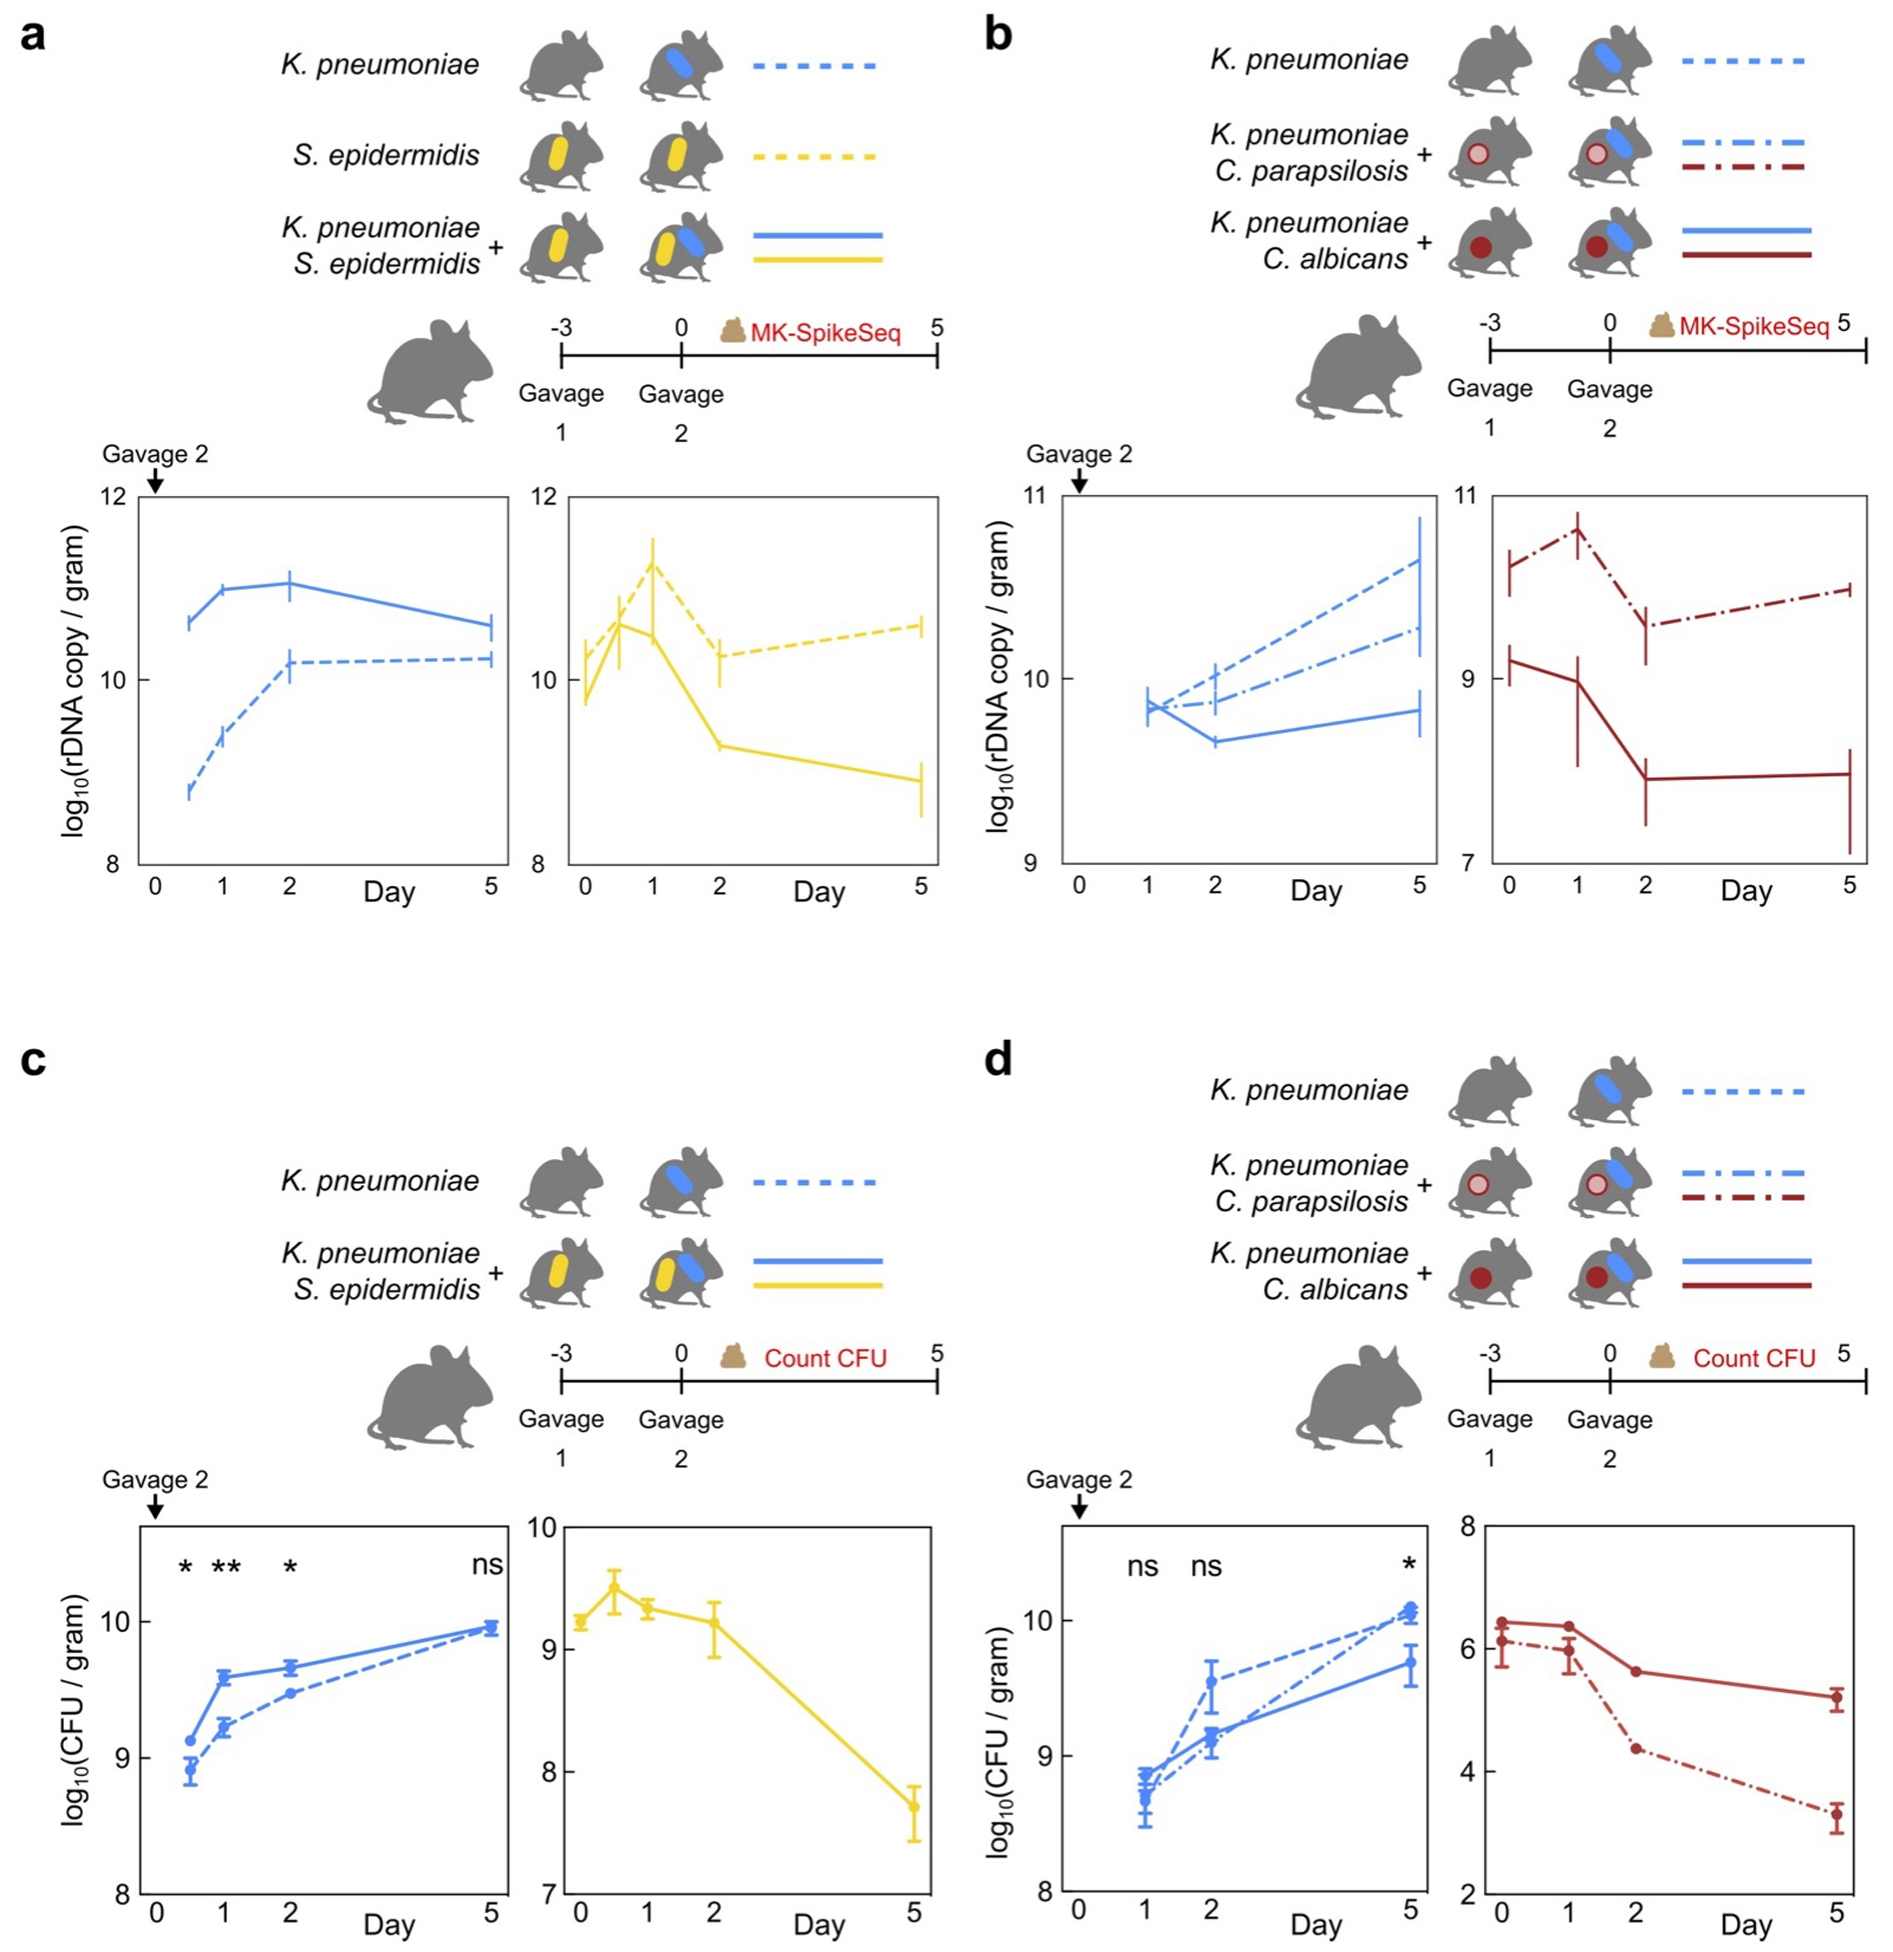
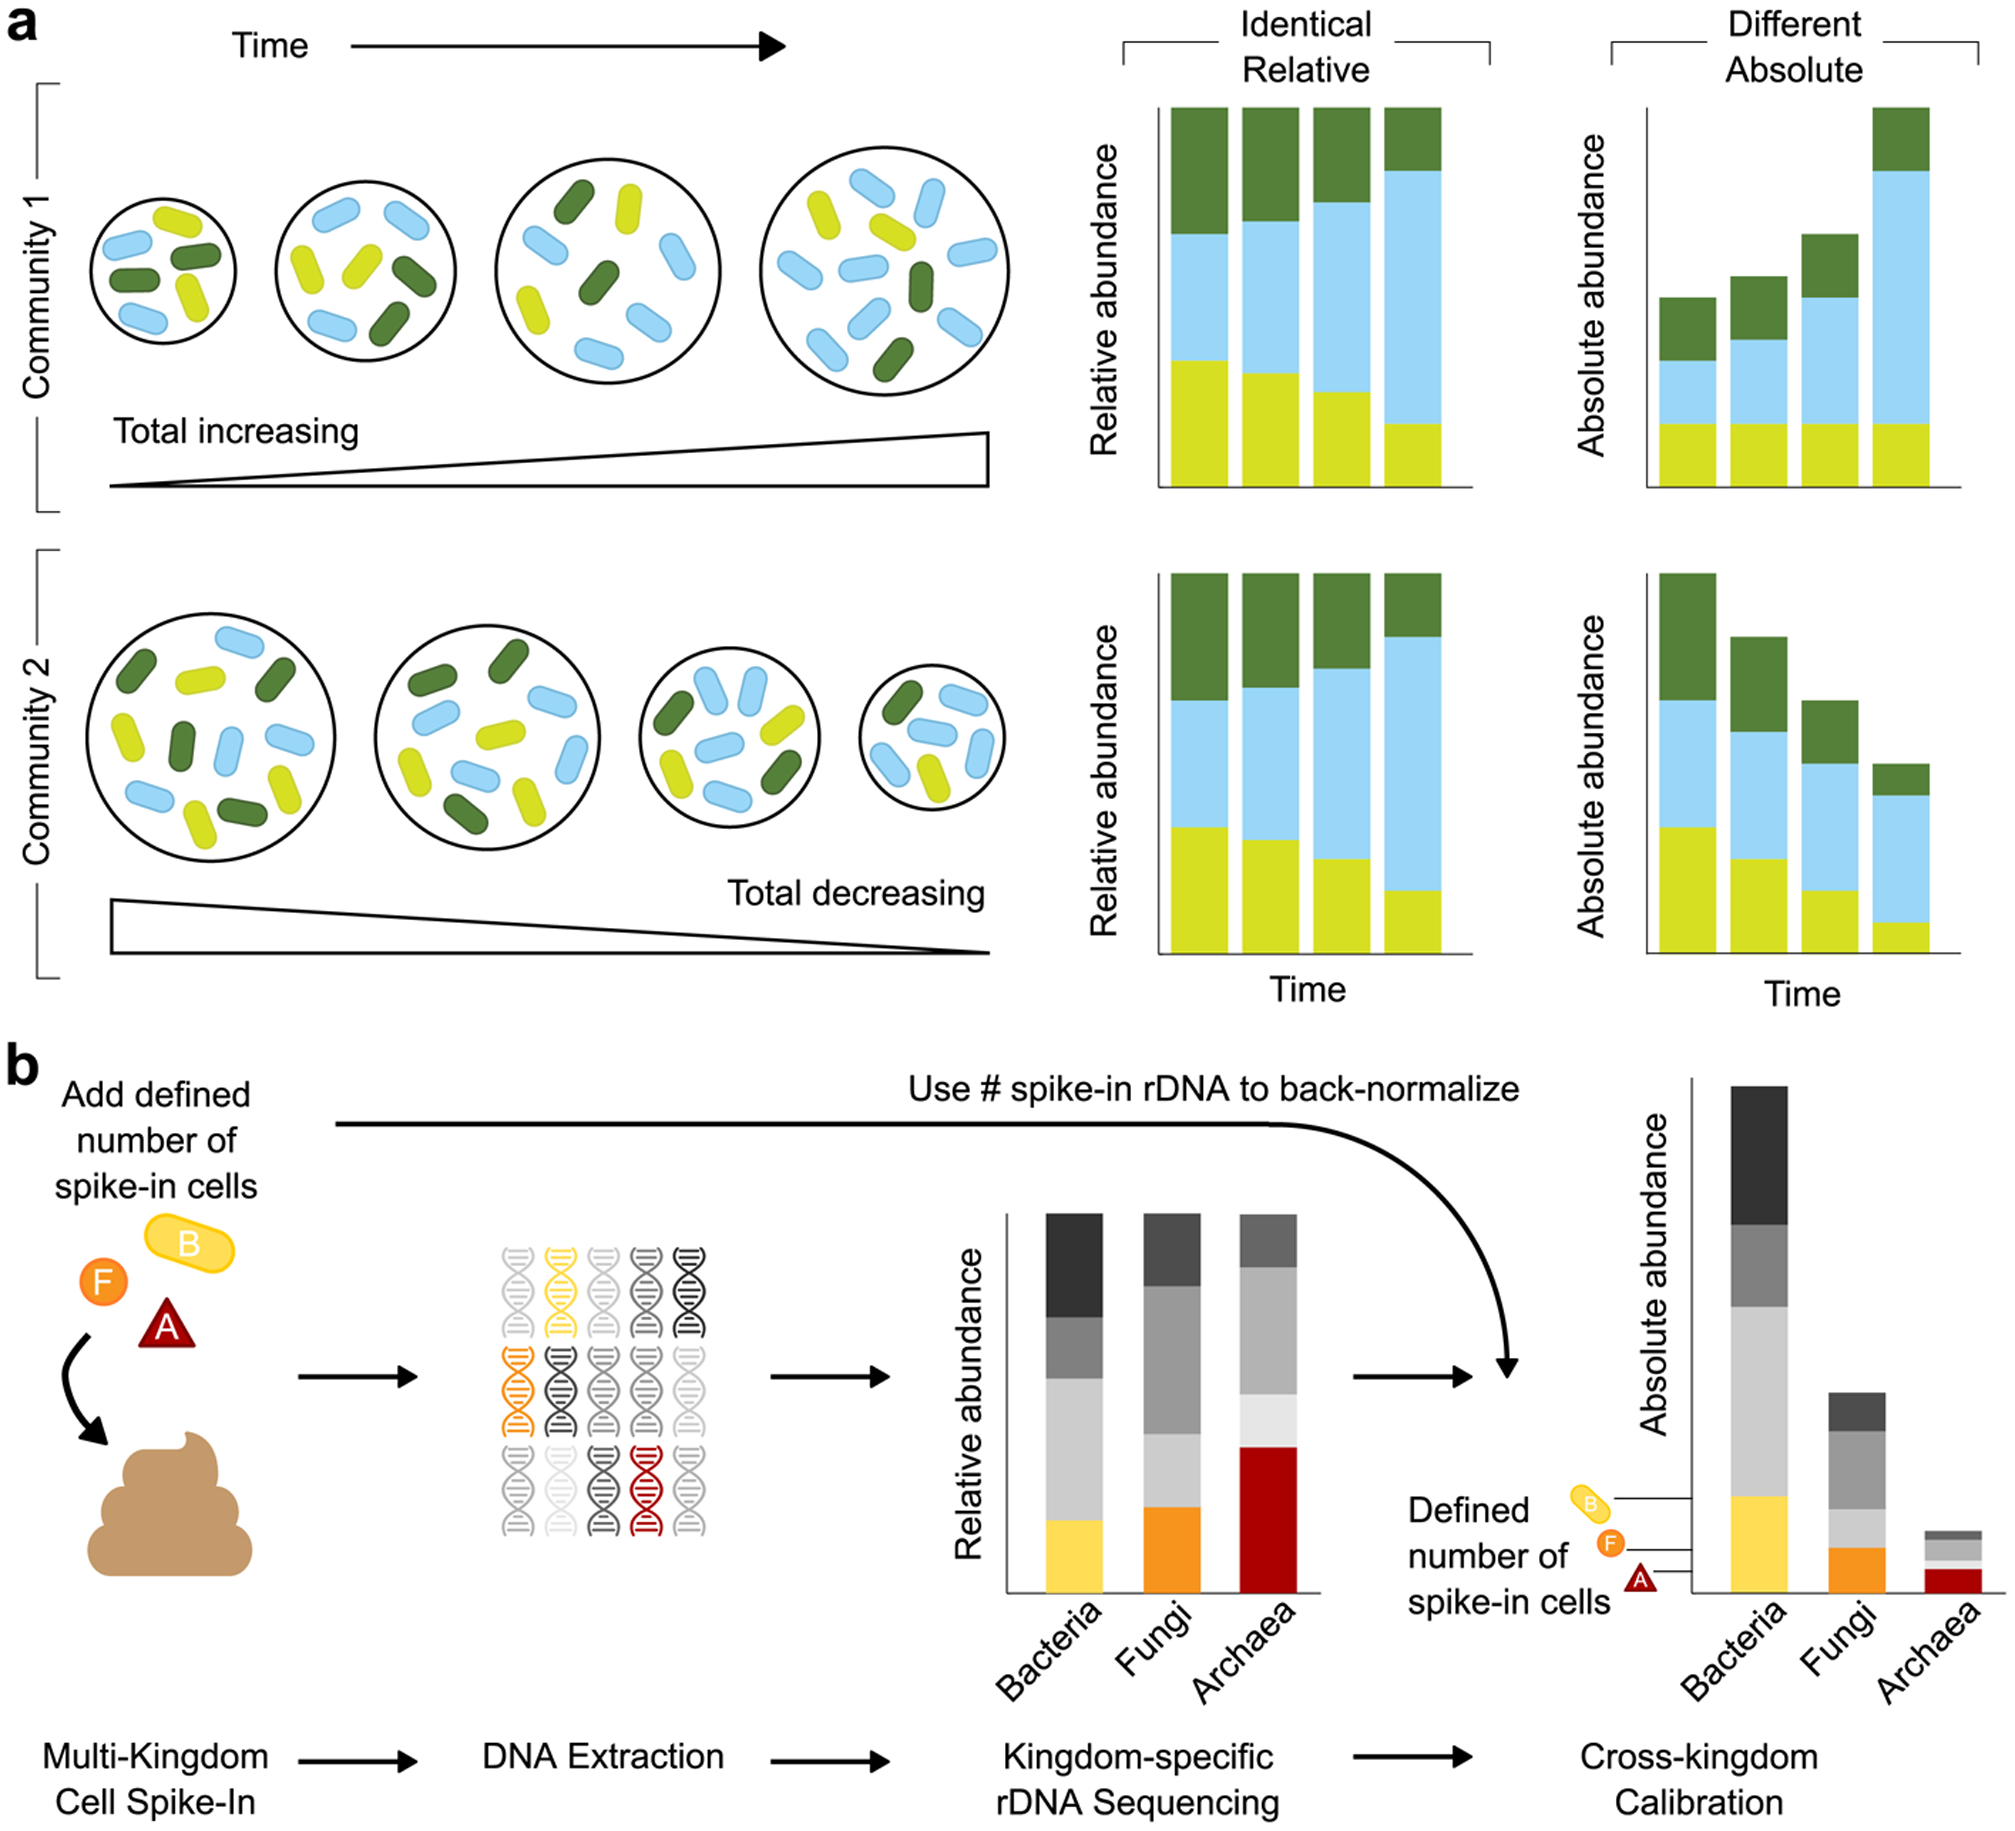
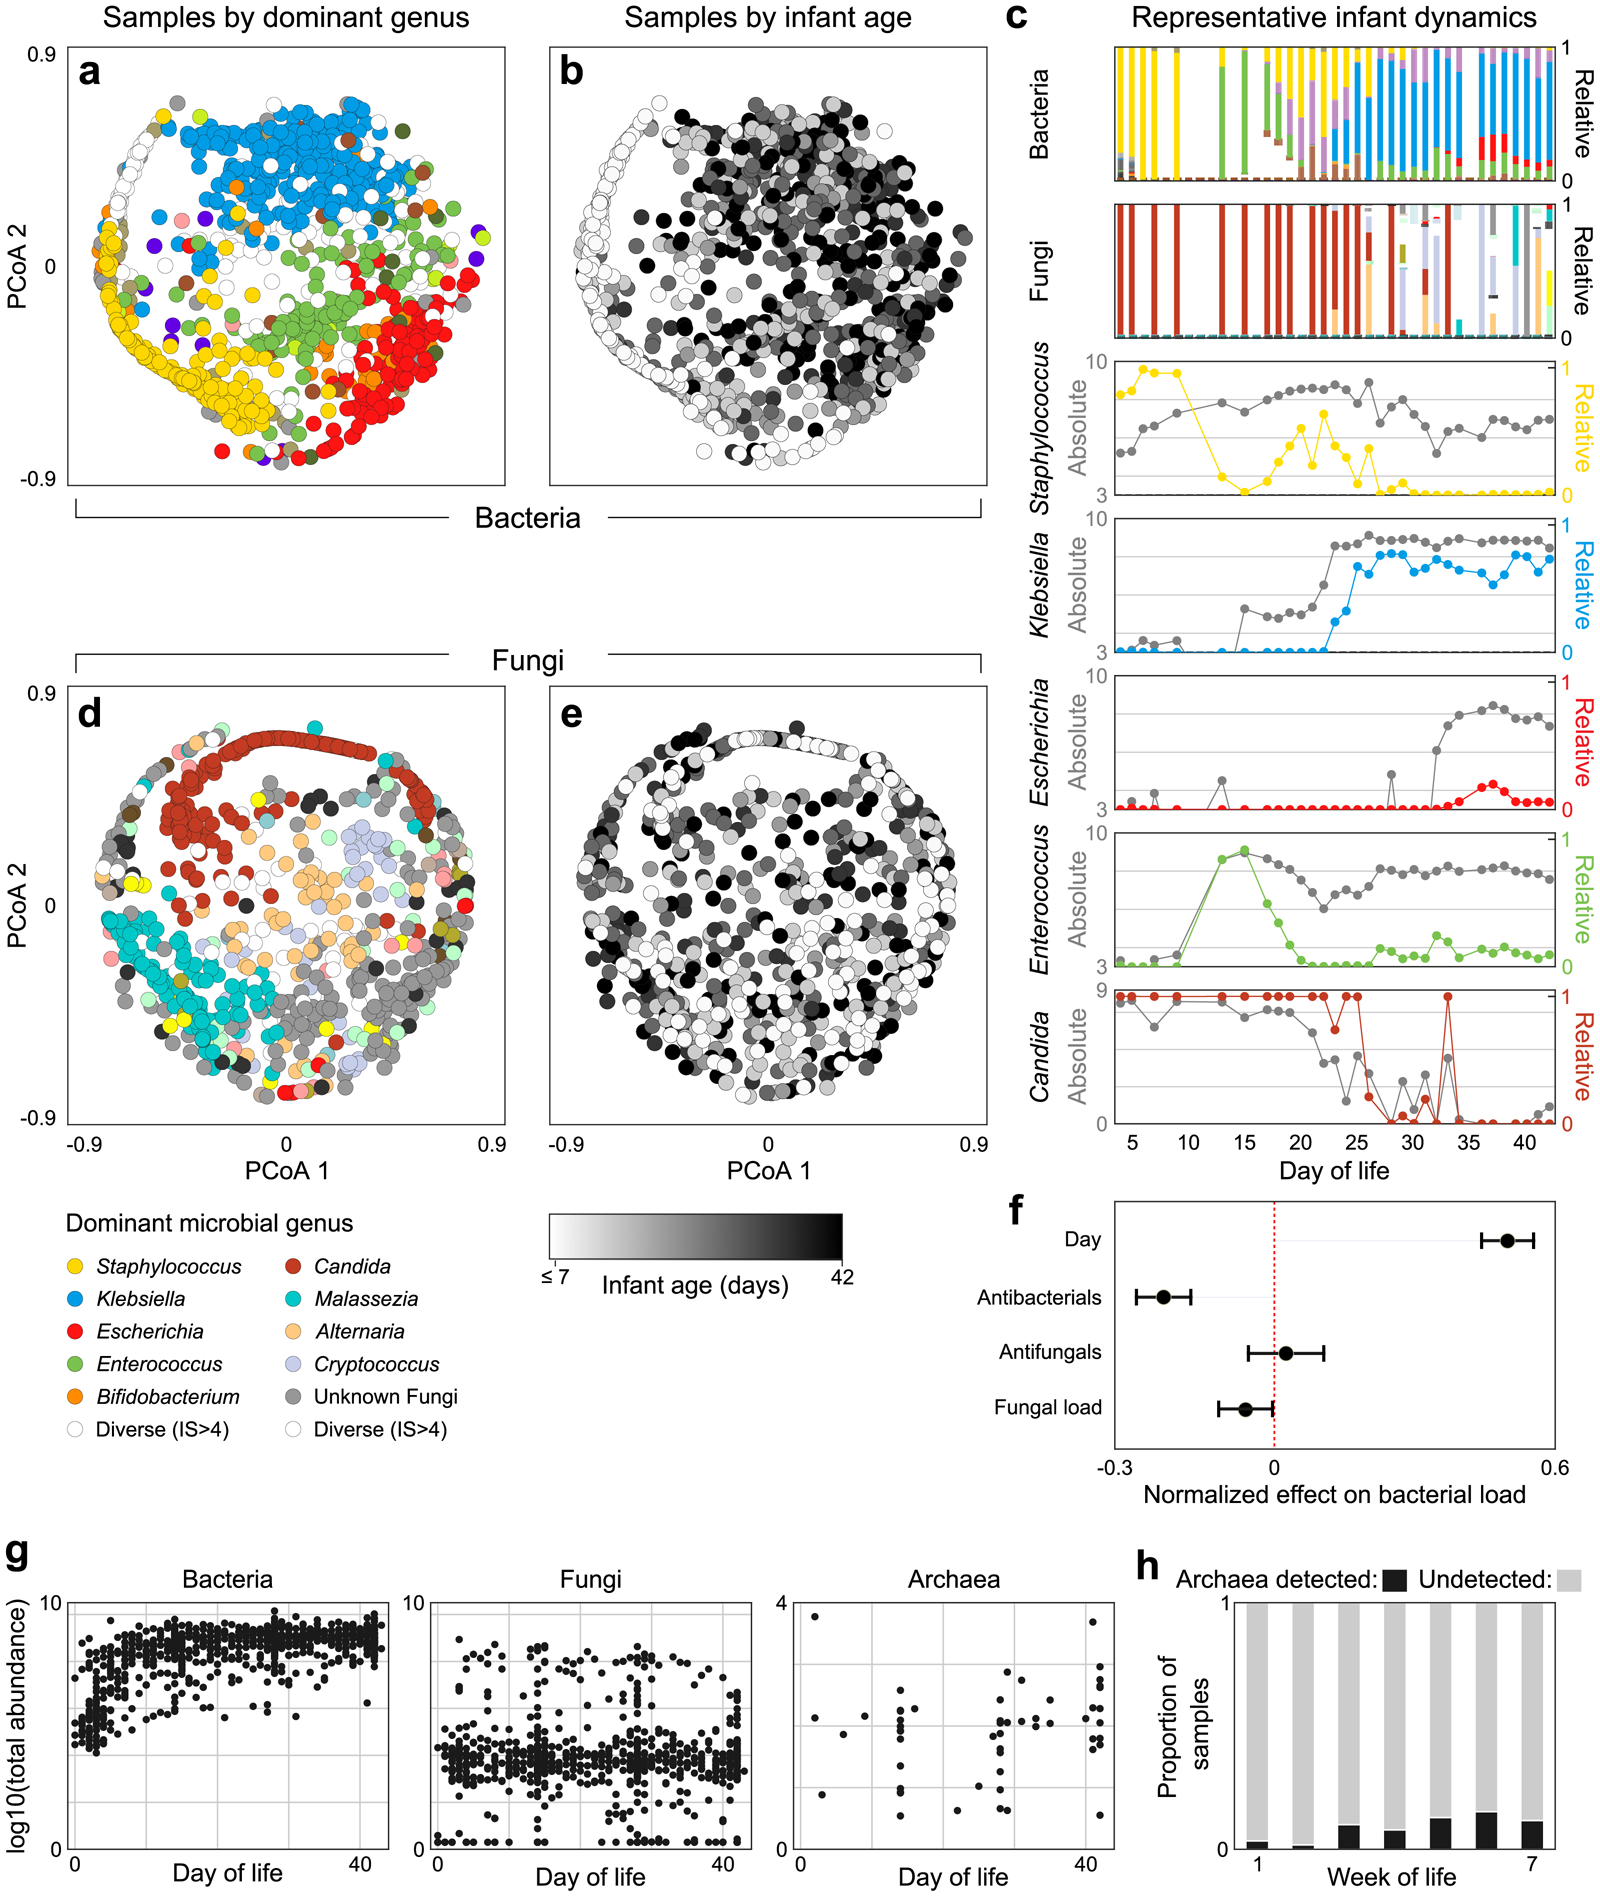
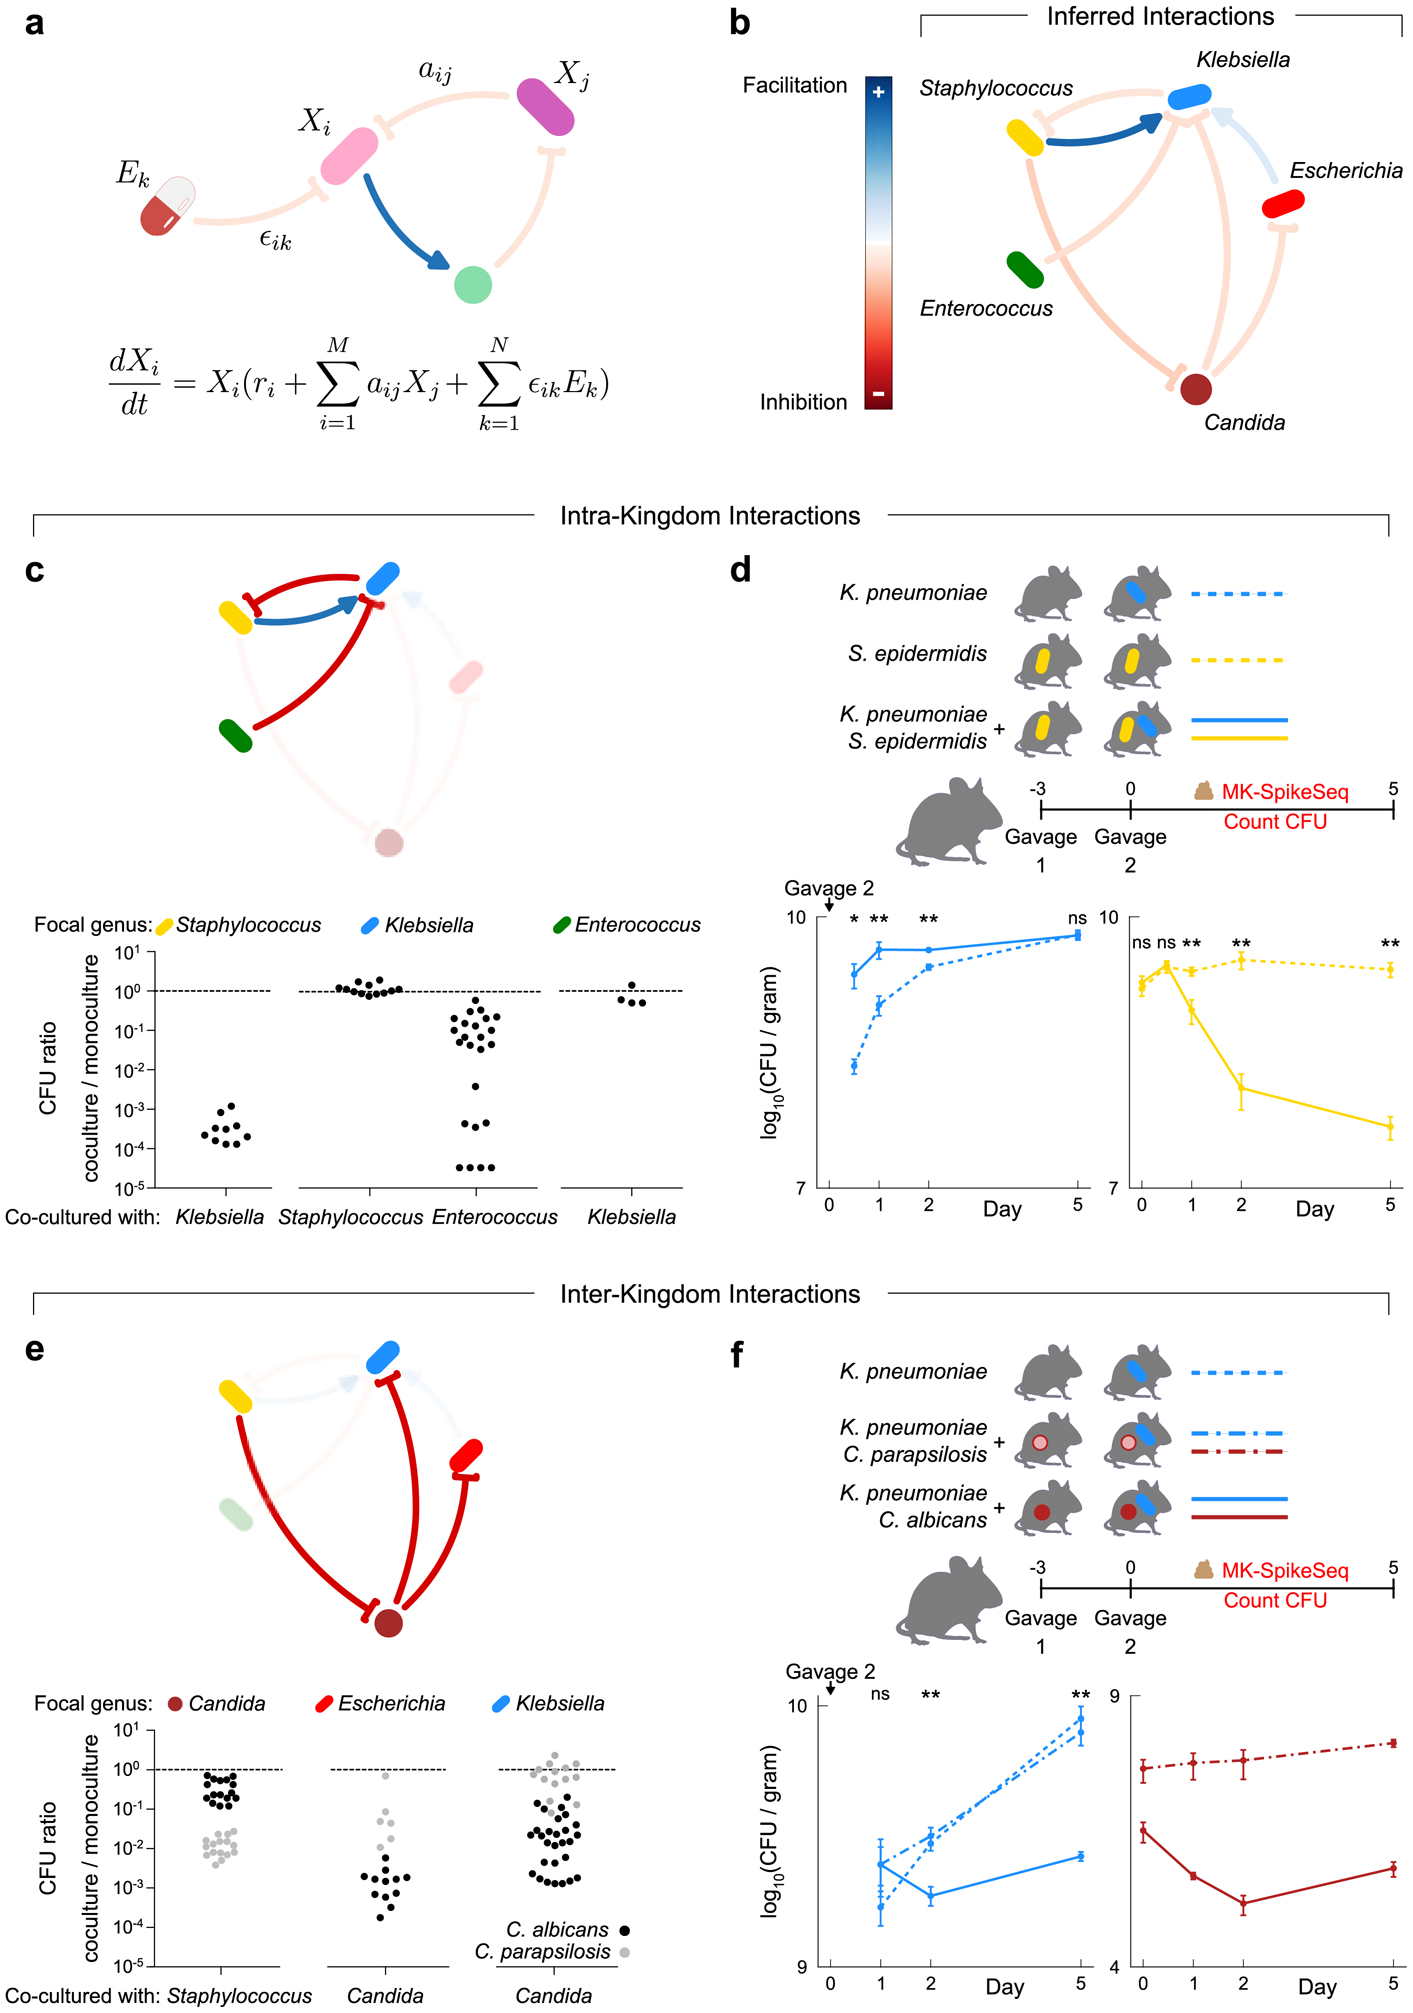
The gut microbiota of preterm infants develops predictably1-7, with pioneer species colonizing the gut after birth, followed by an ordered succession of microorganisms. The gut microbiota is vital to the health of preterm infants8,9, but the forces that shape these predictable dynamics of microbiome assembly are unknown. The environment, the host and interactions between microorganisms all potentially shape the dynamics of the microbiota, but in such a complex ecosystem, identifying the specific role of any individual factor is challenging10-14. Here we use multi-kingdom absolute abundance quantification, ecological modelling and experimental validation to address this challenge. We quantify the absolute dynamics of bacteria, fungi and archaea in a longitudinal cohort of 178 preterm infants. We uncover microbial blooms and extinctions, and show that there is an inverse correlation between bacterial and fungal loads in the infant gut. We infer computationally and demonstrate experimentally in vitro and in vivo that predictable assembly dynamics may be driven by directed, context-dependent interactions between specific microorganisms. Mirroring the dynamics of macroscopic ecosystems15-17, a late-arriving member of the microbiome, Klebsiella, exploits the pioneer microorganism, Staphylococcus, to gain a foothold within the gut. Notably, we find that interactions between different kingdoms can influence assembly, with a single fungal species-Candida albicans-inhibiting multiple dominant genera of gut bacteria. Our work reveals the centrality of simple microbe-microbe interactions in shaping host-associated microbiota, which is critical both for our understanding of microbiota ecology and for targeted microbiota interventions.


Conflict of interest statement

Competing interests

CRM receives grant funding from Mead Johnson Nutrition. CRM also provides consulting services for Mead Johnson Nutrition, Alcresta and Fresenius Kabi, and sits on the Scientific Advisory Boards of Plakous Therapeutics and LUCA Biologics. All other authors declare no competing interests.

Figures

Extended Data Figure 1.
Extended Data Figure 1.. MK-SpikeSeq reliably measures absolute abundances across kingdoms.
A set of single-kingdom mock communities with a fixed composition of 10 bacterial (a) or 10 fungal (d) species and variable total microbial loads (indicated by the pie chart schematics underneath), were quantified using MK-SpikeSeq for relative composition (colored bars) and absolute abundance (black/grey bars). b, e, Correlations between expected (based on initial microbial densities and known dilution factors) and MK-SpikeSeq-measured total absolute abundances show that MK-SpikeSeq reliably detects absolute abundances of bacteria and fungi. Note that for e, as exact rDNA copy numbers per fungal cell are undefined, the expected total ITS1 abundances are only estimates (here using 200 rDNA copies per fungal cell). c, f, Absolute abundance changes for individual members (color coded same as a, d) in the bacterial and fungal mock communities are largely consistent with known dilution factors. g, A set of serial dilutions of a human fecal sample was quantified using MK-SpikeSeq for relative composition (colored bars, shown are the phylum level taxa) and absolute abundance (empty bars). h, Absolute abundance changes for individual OTUs (color coded in phyla same as g) across kingdoms are largely consistent with known dilution factors.
Extended Data Figure 2.
Extended Data Figure 2.. MK-SpikeSeq reliably captures key ecological dynamics in multi-kingdom mock communities.
Two sets of defined multi-kingdom consortia, including ten bacteria and ten fungi (left panels, color coded same as Extended Data Fig. 2a/d), were assembled to model a “true” (a) and a “false” (b) negative interaction between one focal bacterium and one focal fungus, by varying the abundances of either these focal species or other background members. The MK-SpikeSeq quantitations of focal species highlight either consistent (a) or distinct (b) patterns between relative abundance and absolute abundance (middle panels). Relative abundance data may lead to a false prediction of cross-kingdom interaction between the focal species, while absolute abundance data measured by MK-SpikeSeq could disentangle these distinct mock ecological dynamics (right panels).
Extended Data Figure 3.
Extended Data Figure 3.. MK-SpikeSeq outperforms other quantitation methods in cross-kingdom specificity.
A set of 40 test samples including human stools and soil samples were used to compare kingdom-specific absolute abundance quantifications. a, MK-SpikeSeq compared with total DNA yields. Pearson correlation tests show that total DNA yields mostly only reflect bacterial community abundances. b, MK-SpikeSeq compared with flow cytometry cell enumerations using gating strategies targeted for either prokaryotes or fungi. For prokaryotic enumerations, two soil samples are highlighted due to their high archaeal loads that cannot be distinguished from bacterial counts by flow cytometry. For fungi enumerations, shown are results using one gating strategy; attempts using two additional gating strategies show similar over-estimation of fungal counts (Supplemental Table 4). c, MK-SpikeSeq compared with kingdom-specific qPCR. Horizontal dashed lines show the limit of detection using qPCR, based on the negative control (DNA extraction of water); vertical dashed line shows the limit of detection using MK-SpikeSeq, based on minimal one non-spike-in arch16S read normalized against the average arch16S sequencing depth. Samples below limit of detection are excluded from correlational tests. Note that some samples with arch16S below MK-SpikeSeq limit of detection showed arch16S qPCR signals higher than the negative control, likely due to bacterial signals bleeding into archaea-specific qPCR. For a-c: Pearson correlation r and two-sided p values were shown (no adjustment for multiple comparisons); ns, not significant. d, Comparison of 16S genus-level profiles sequenced with (s) or without (ns) spike-in shows largely unaltered community compositions having exogenous spike-in. e, f, Flow cytometry gating strategies used in prokaryote and fungi cell counting (b), with green showing bacterial and fungal cells and purple showing microsphere particles provided in the bacteria counting kit. Note that higher voltage settings were used in flow cytometry for prokaryote cell counting than for fungi cell counting.
Extended Data Figure 4.
Extended Data Figure 4.. MK-SpikeSeq outperforms qPCR in the sensitivity of detection and robustness to sample background.
a, Comparison of sensitivity between MK-SpikeSeq and qPCR using 10-fold serial dilutions of E. coli and C. albicans. MK-SpikeSeq showed 100~1000-fold increased sensitivity over qPCR in low bacterial abundance samples (detecting as few as 10 bacterial cells). For MK-SpikeSeq of E. coli samples, two levels of spike-in were used to cover the whole range of detection under the sequencing depth of 10~100k reads per sample. For qPCR, horizontal dashed lines indicate the negative control (DNA extraction of water) and vertical dashed line shows the threshold below which pooled 16S sequencing yielded <100 reads (sequencing failed likely due to too low signal). b, Comparison of robustness to host cell background between MK-SpikeSeq and qPCR using test samples with fixed amount of E. coli and C. albicans and variable number of Caco-2 colonic cells. MK-SpikeSeq detected consistent (< 2-fold variations) microbial abundances in samples with high host-cell background whereas qPCR under-measured microbial abundances by 10-fold (deltaCt > 3.3). n=2 for the 106 host cells group, n=1 for the other groups.
Extended Data Figure 5.
Extended Data Figure 5.. MK-SpikeSeq identifies errors in sample processing of fungal communities.
a, In our first phase of NICU sequencing (see Supplemental Text), we identified a number of samples, highlighted in red dots, that failed to yield >1k ITS1 reads per sample post quality filtering (red dashed line). Many of these sequencing-failed samples showed much lower (>5 deltaCt) ITS1 qPCR signals than the spike-in control (green dashed line), indicating poor DNA extractions of fungi in these samples. Shown next to the axes are frequency histograms of measurements. b, Reprocessing of 10 of these sequencing-failed samples led to increased ITS1 qPCR signals, indicating improved DNA extractions. c, These reprocessed samples also yielded desired >10k ITS1 reads, passing our rDNA sequencing criteria. For b/c, two-tailed paired student’s t test. d, Eight of the reprocessed samples showed non-zero fungal communities, and only two had no detectable fungal signal. Shown are the composition (colored bars) and total abundance (empty bars) of fungal communities in these reprocessed samples.
Extended Data Figure 6.
Extended Data Figure 6.. Bacterial samples cluster based on composition and infant age, but not diet, delivery mode, or gender.
a, Principle Coordinate Analysis (PCoA) based on Bray-Curtis dissimilarities of bacterial community composition between samples (genus level). Samples colored by dominant taxa or white when diversity is high (IS>4). b, PCoA colored by infant age. c, PCoA colored by infant diet close. d, PCoA with samples colored by infant gender. e, PCoA with samples colored by delivery mode. f, PCoA with samples colored by cluster membership, calculated using DBSCAN algorithm. g, Stacked bars represent distribution of dominant genus within each cluster and dot plots illustrate average day of life of samples within each cluster. Kruskal-Wallis test with Bonferroni correction showed statistically significant differences in day of life of samples between clusters (Chi square = 254, p-value << 0.0001, df = 3), error bars show mean +/− standard deviation. h, Stacked bars indicate the proportion of genera exhibiting each noise type per infant. Dark noise indicates increasing temporal dependence, with white noise suggesting temporal dynamics are entirely random.
Extended Data Figure 7.
Extended Data Figure 7.. Fungal community composition does not map to infant age, diet, gender or delivery mode.
a, Principle Coordinate Analysis (PCoA) based on Bray-Curtis dissimilarities of fungal community composition between samples (genus level). Samples colored by dominant taxa or white when diversity is high (IS>4). b, PCoA colored by infant age. c, PCoA colored by infant diet close. d, PCoA with samples colored by infant gender. e, PCoA with samples colored by delivery mode. f, PCoA with samples colored by cluster membership, calculated using DBSCAN algorithm. g, Stacked bars represent distribution of dominant genus within each cluster and dot plots illustrate average day of life of samples within each cluster. Kruskal-Wallis test with Bonferroni correction showed no statistically significant differences in day of life of samples between clusters (Chi square = 3.06, p-value = 0.69, df = 5), error bars show mean +/− standard deviation. h, Stacked bars indicate the proportion of genera exhibiting each noise type per infant. Dark noise indicates increasing temporal dependence, with white noise suggesting temporal dynamics are entirely random. Notably, 5 infants’ mycobiomes could not be classified.
Extended Data Figure 8.
Extended Data Figure 8.. Trends in total microbial loads for all three kingdoms.
Scatter plots of rDNA-based total abundances of bacteria (a), fungi (b) and archaea (c) against infant day of life (DOL), measured by MK-SpikeSeq in the first phase Nextseq sequencing. The red lines denote the linear regression fit and the 90% confidence bands of the best-fit line of absolute abundances in log scale. Spearman correlations show that bacterial and archaeal, but not fungal, loads are positively associated with infant age. Samples with undetectable kingdom-specific rDNA signal are not plotted. For archaea that show scarce signal in the cohort (c, left), a separate presence/absence plot and chi-square test of binned samples (c, right) also show a positive correlation between archaeal loads and infant age. d, Diagnostics for linear mixed effects model.
Extended Data Figure 9.
Extended Data Figure 9.. Microbe-microbe interactions are predominantly asymmetric, while inferring interactions from relative abundance data generates misleading results.
a, Heatmap plotting interactions inferred by the gLV model. Each row of the heatmap illustrates the effect upon the target genera by other members of the gut community (left columns) or documented usage of antimicrobials according the clinical metadata (right columns). b, Histogram of individual antibacterial (purple) or antifungal (green) interaction strengths, split by kingdom. Antibacterials primarily inhibit bacteria, and antifungals primarily inhibit fungi, however there is not a significant bias in the likelihood of either antimicrobial inhibiting their target kingdom (exact binomial tests, H0: P(Inhibition) = 0.5, p>0.05). c, Stacked bar illustrates the proportion of different interaction types occurring between genera. Over 80% of interactions are asymmetric, being either exploitative (+/−), commensal (+/0), or amensal (-/0). d, To confirm the value of our absolute abundance methods, we inferred inter-genus interactions from relative abundance data alone using the FastSpar algorithm. This approach robustly identifies co-occurrence relationships between different microbial taxa in a manner that accounts for the compositional nature of relative abundance data. Notably, correlation networks cannot infer asymmetric interactions thus this approach cannot detect the exploitation of Staphylococcus by Klebsiella. It also erroneously infers that Staphylococcus increases the growth of Candida, and cannot detect the inhibition of Klebsiella by Candida or Enterococcus. e, Steady-state bacterial relative abundances of those subcommunities predicted to be feasible and/or linearly asymptotically stable. f, Steady-state fungal relative abundances of those subcommunities predicted to be feasible and/or linearly asymptotically stable.
Extended Data Figure 10.
Extended Data Figure 10.. MK-SpikeSeq measurement and repeat experiments of in vivo colonization.
a/b, Biological replicate samples of mouse stools characterized by CFU counting of strains of interest in Fig. 3d/f were subjected to MK-SpikeSeq to determine rDNA-based absolute abundances of the specified strains. c/d, Repeat in vivo colonization experiments. Error bars denote the standard error of the mean (SEM); * p<0.05, ** p<0.01, ns not significant, by two-tailed student’s t test. For panel c: n=5 per group. For panel d: n=4 for C. albicans/K. pneumoniae group, n=3 for the other two groups; t test of K. pneumoniae CFU between C. albicans and C. parapsilosis groups. See Supplemental Table 15 for exact p-values.
Figure 1.
Figure 1.. Multiple Kingdom SpikeSeq (MK-SpikeSeq) enables robust quantitation of absolute abundances.
a, Schematic illustrating how relative abundance data can mask underlying community dynamics, rendering it challenging to distinguish different ecological scenarios. b, Overview of the MK-SpikeSeq pipeline. Prior to DNA extraction, defined amounts of each spike-in cell (bacteria (B), fungi (F) and archaea (A)) are added to each microbiome sample. Relative abundances of each microbial kingdom are then quantified using standard kingdom-specific rDNA amplicon sequencing. As the absolute abundances of each spike-in cell’s rDNA are known, these quantities can be used as back-normalization factors to calculate the absolute abundances of all other organisms present in each sample. The spike-in cells also serve as internal controls for the entire sample processing procedure, rendering the absolute quantification robust to factors such as sample-to-sample variability in DNA extraction efficiency.
Figure 2.
Figure 2.. The preterm infant gut exhibits rich bacterial and fungal community dynamics.
a, Principle Coordinate Analysis (PCoA) plot of Bray-Curtis dissimilarities between bacterial samples at the genus level. Each dot represents a sample, colored by the dominant genus present or white if diversity was high (Inverse Simpson index > 4). b, The same PCoA as panel a with samples instead colored by infant day of life, illustrating how bacterial community composition changes predictably over time. c, Microbiota dynamics of a single representative infant, highlighting the importance of gathering absolute abundances when studying microbiome ecology. Stacked bars represent total community composition (for full color schemes, see Extended Data Figs 3, 4). Line plots illustrate the relative (colored) and absolute (grey) abundances of individual genera. d-e, PCoA plots of fungal community composition colored by dominant genus (d) or infant age (e), indicating fungal community composition does not correlate with infant age. f, Effects of clinical and microbial factors on total bacterial load, quantified by a linear mixed effects model, suggesting a potential relationship between kingdoms within the preterm infant gut (centers and error bars indicate estimated fixed effects and 95% confidence intervals respectively). g, Total abundances of bacteria, fungi and archaea over time. h, Proportion of samples in which archaea could be detected during each week of life. For panels a/b/g left, number of samples n = 934, for d/e/g center n=772, for f n=770, for g right, h n = 596.
Figure 3.
Figure 3.. Pairwise intra- and inter-kingdom interactions drive predictable patterns of infant microbiome assembly.
a, Schematic illustrating the generalized Lotka-Volterra (gLV) model used to identify causative drivers of bacterial and fungal dynamics within the infant gut. This model assumes the growth rate of each taxon, dXidt is determined by its own intrinsic growth rate ri, its interaction with other community members aijXj, and any environmental perturbation ϵikEk. b, The gLV model identified a network of microbe-microbe interactions occurring between dominant members of the preterm gut that are predicted to affect microbiota dynamics. c, in vitro growth effects of infant isolates upon one another using monoculture and pairwise co-culture, testing the predicted within-kingdom interactions. d, CFU counts quantifying microbial fitness in vivo in a specific pathogen free (SPF) mouse model, reproducing the predicted exploitation of Staphylococcus by Klebsiella. Gavage 2 indicates day of inoculation with K. pneumoniae. e, in vitro growth of infant isolates when growing alone and in co-culture, testing the predicted cross-kingdom interactions. Black and grey dots indicate co-cultures with C. albicans and C. parapsilosis respectively. f, CFU counts quantifying microbial fitness in vivo in a SPF mouse model, reproducing the species-specific differences in the cross-kingdom inhibition observed in vitro. Gavage 2 indicates day of inoculation with K. pneumoniae. For panels c/e: each dot denotes one unique pair of strains of the indicated genera, with each pair replicated at least once (Supplemental Table 14a). For panels d/f: Klebsiella was undetected at time 0 upon gavage; n=5 per group, error bars denote the SEM; * p<0.05, ** p<0.01, ns not significant, by two-tailed student’s t test; see Supplemental Table 15 for exact p-values; see repeat in vivo experiments in Extended Data Fig 10c–d.

Comment in

References

    1. Charbonneau MR et al. Human developmental biology viewed from a microbial perspective. Nature 535, 48–55 (2016). - PMC - PubMed
    1. Bäckhed F et al. Dynamics and stabilization of the human gut microbiome during the first year of life. Cell Host Microbe 17, 690–703 (2015). - PubMed
    1. Stewart CJ et al. Temporal development of the gut microbiome in early childhood from the TEDDY study. Nature 562, 583–588 (2018). - PMC - PubMed
    1. Derrien M, Alvarez AS & de Vos WM The Gut Microbiota in the First Decade of Life. Trends in Microbiology 27, 997–1010 (2019). - PubMed
    1. Yatsunenko T et al. Human gut microbiome viewed across age and geography. Nature 486, 222–227 (2012). - PMC - PubMed

Publication types