. 2021 Feb 15;18(1):172-183.
doi: 10.20892/j.issn.2095-3941.2020.0211.

The IL-33/ST2 axis affects tumor growth by regulating mitophagy in macrophages and reprogramming their polarization

Affiliations

The IL-33/ST2 axis affects tumor growth by regulating mitophagy in macrophages and reprogramming their polarization

Huadan Xu et al. Cancer Biol Med. .

Abstract

Objective: Macrophages are a major component of the tumor microenvironment. M1 macrophages secrete pro-inflammatory factors that inhibit tumor growth and development, whereas tumor-associated macrophages (TAMs) mainly exhibit an M2 phenotype. Our previous studies have shown that the interleukin-33/ST2 (IL-33/ST2) axis is essential for activation of the M1 phenotype. This study investigates the role of the IL-33/ST2 axis in TAMs, its effects on tumor growth, and whether it participates in the mutual conversion between the M1 and M2 phenotypes.

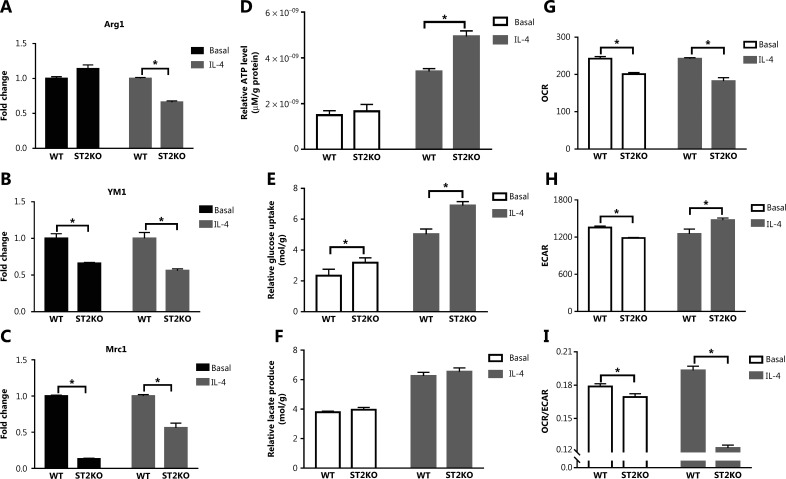
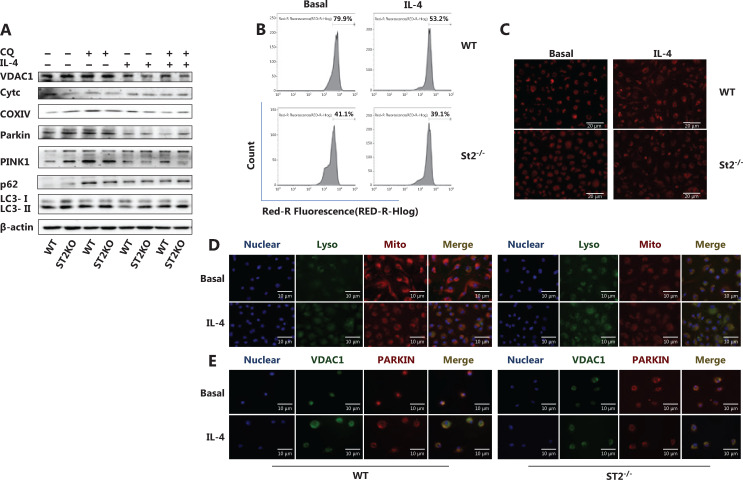
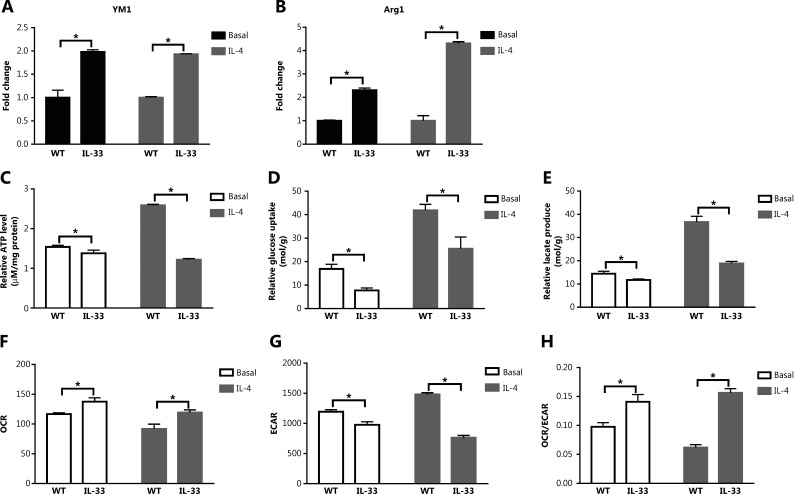
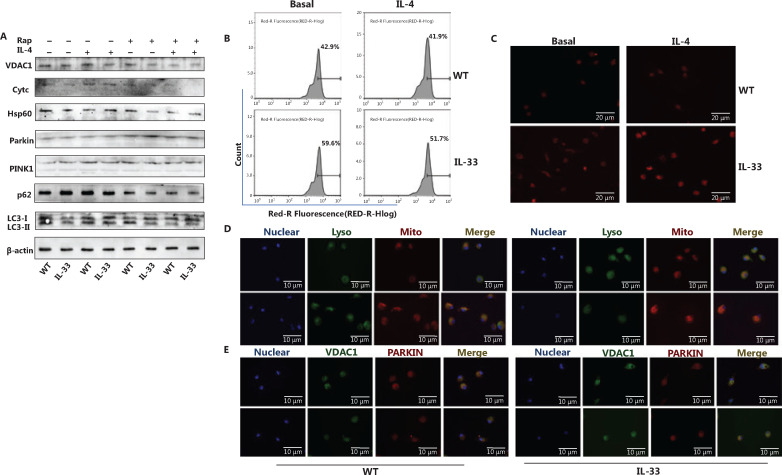
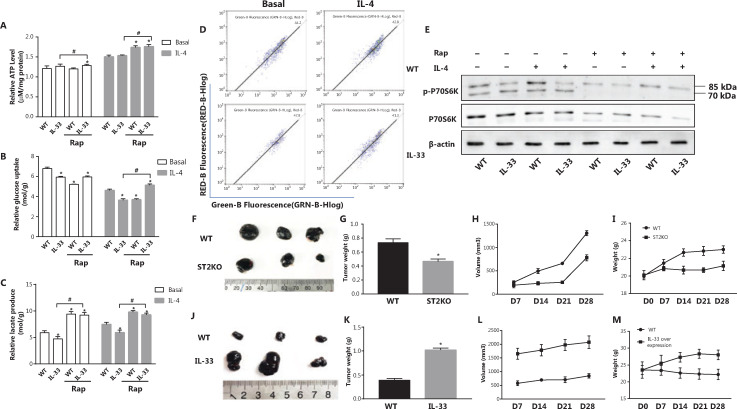
Methods: Bone marrow-derived macrophages were extracted from wildtype, ST2 knockout (ST2-/-), and Il33-overexpressing mice and differentiated with IL-4. The mitochondrial and lysosomal number and location, and the expression of related proteins were used to analyze mitophagy. Oxygen consumption rates and glucose and lactate levels were measured to reveal metabolic changes.

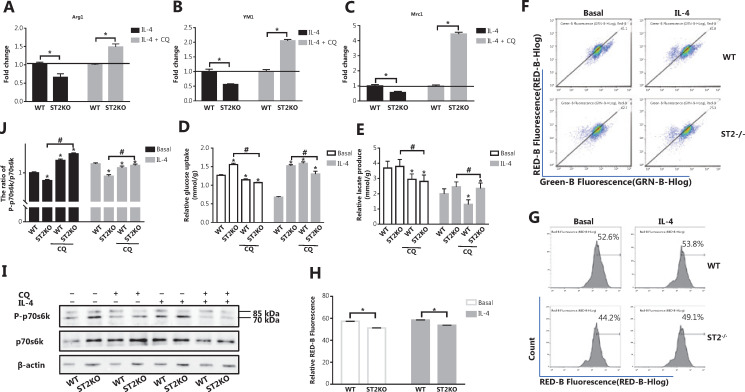
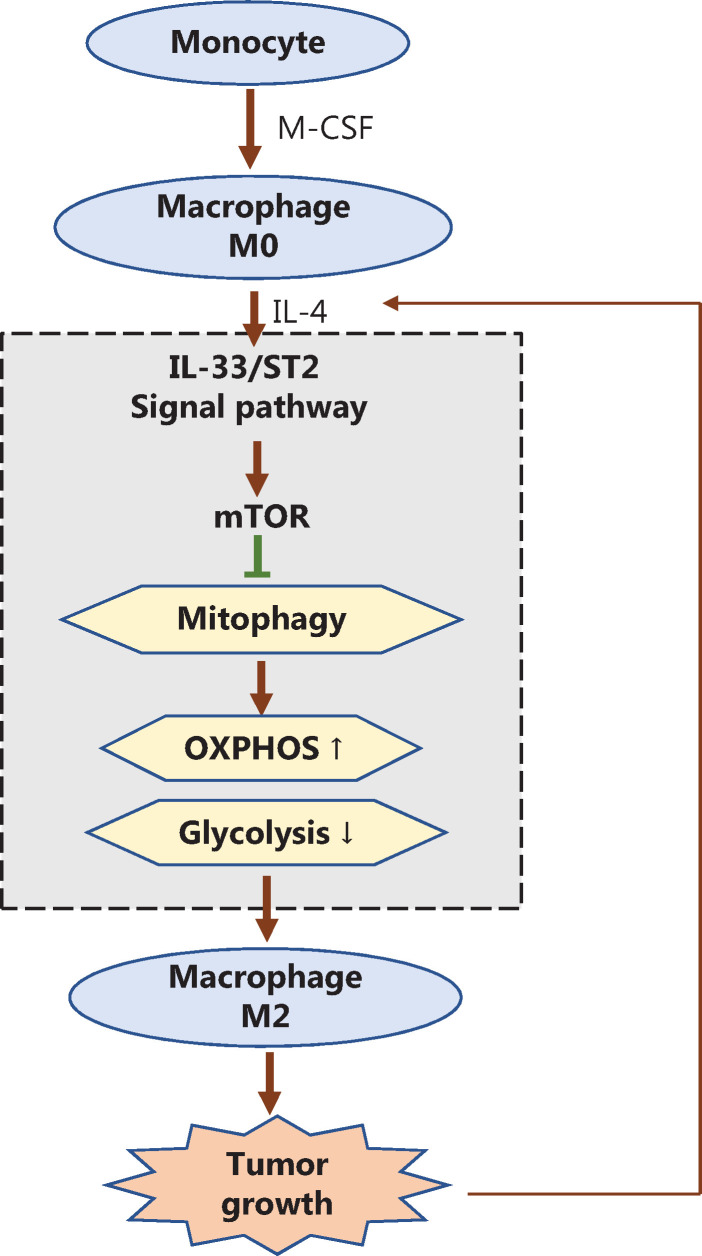
Results: The IL-33/ST2 axis was demonstrated to play an important role in the metabolic conversion of macrophages from OXPHOS to glycolysis by altering mitophagy levels. The IL-33/ST2 axis promoted enhanced cell oxidative phosphorylation, thereby further increasing M2 polarization gene expression and ultimately promoting tumor growth (P < 0.05) (Figure 4). This metabolic shift was not due to mitochondrial damage, because the mitochondrial membrane potential was not significantly altered by IL-4 stimulation or ST2 knockout; however, it might be associated with the mTOR activity.

Conclusions: These results clarify the interaction between the IL-33/ST2 pathway and macrophage polarization, and may pave the way to the development of new cancer immunotherapies targeting the IL-33/ST2 axis.

Keywords: IL-33/ST2; glucose metabolism; macrophage polarization; mitophagy; tumor microenvironment.


Conflict of interest statement

Conflicts of interest statement No potential conflicts of interest are disclosed.

Figures

Figure 1
Figure 1
ST2−/− reduces M2 marker gene expression in macrophages, and increases glucose uptake and lactic acid production. BMDMs were stimulated with IL-4 (25 ng/mL) for 24 h. The expression of Arg1 (A), Ym1 (B) and Mrc1 (C) was detected by qPCR. The extracellular relative ATP level (D), relative glucose uptake (E), and relative lactic acid production (F) were measured after the above treatment. The extracellular oxygen consumption rate (OCR) (G) was measured immediately with an oxygen-sensitive probe. The extracellular acidification rate (ECAR) (H) after incubation at 37 °C for 3 h. Quantitative graph of the ratio of OCR to ECAR (I). Vertical bars = SEM (n = 3). * P < 0.05 ST2KO vs. WT at the same treatment.
Figure 2
Figure 2
A decreased mitochondrial number in ST2−/− macrophages is associated with increased mitochondrial autophagy. BMDMs were cultured as described above with/without IL-4 (25 ng/mL) and CQ (10 μM) for 24 h. Analysis of VDAC1, Cytc, COXIV, Parkin, PINK1, p62, LC3II and I by Western blot (A), and incubation with MitoTracker probe at 37 °C for half an hour, and flow cytometry (B) and fluorescence staining (C) (scale bar: 20 μm) to detect the number of labeled mitochondria are shown. BMDMs were cultured as described above. Fluorescence staining was used to detect the localization of mitochondria and lysosomes (scale bar: 10 μm) (D). Different fluorescent tags were used to detect the localization of VDAC1 and Parkin (scale bar: 10 μm) (E). Data are representative of 3 experiments.
Figure 3
Figure 3
After CQ treatment, the expression of M2 marker genes in ST2−/− BMDMs stimulated by IL-4 increases, and metabolic changes in ST2−/− macrophages are not associated with mitochondrial damage. BMDMs were cultured as described in Figure 2. Arg1 (A), Ym1 (B), and Mrc1 (C) expression was assessed by qPCR, * P < 0.05 ST2KO vs. WT at the same treatment. Glucose uptake (D) and lactic acid production (E) were detected with specific absorbance analysis, * P < 0.05 vs. WT at the basal level, # P < 0.05 treatment with CQ vs. no CQ when ST2 was knocked out. BMDMs were cultured as described in Figure 1, and detection of JC-1 stained mitochondrial membrane potential (F) and MitoSOX stained mitochondrial ROS (G) by flow cytometry (H) were performed, on the basis of the statistical results represented in Figure 3G. BMDMs were cultured as described in Figure 2, and p70s6k and P-p70s6k were analyzed by Western blot (I). Quantitative graph of the intensity of P-p70s6k to p70s6k protein in (I) (J). Vertical bars = SEM (n = 3). * P < 0.05 vs. WT in basal or IL-4 treated conditions, # P < 0.05 treatment with CQ vs. no CQ when ST2 was knocked out.
Figure 4
Figure 4
IL-33 overexpression increases M2 marker gene expression in macrophages, and decreases glucose uptake and lactic acid production. BMDMs from BALB/c or Il33 overexpressing (Il33Tg) mice were cultured in fresh medium or stimulated with IL-4 (25 ng/mL) for 24 h. The expression of Ym1 (A) and Arg1 (B) was evaluated with qPCR. Extracellular relative ATP levels (C), relative glucose uptake (D), and relative lactic acid production (E). An oxygen-sensitive probe was used to immediately measure the extracellular oxygen consumption rate (OCR) (F). The extracellular acidification rate (ECAR) was measured by incubation at 37 °C for 3 h (G). A quantitative graph of the ratio of OCR to ECAR (H). Vertical bars = SEM (n = 3). * P < 0.05 Il33Tg vs. WT under the same treatment.
Figure 5
Figure 5
IL-33 overexpression increases the number of mitochondria and decreases mitochondrial autophagy. BMDMs from BALB/c or Il33Tg mice were cultured in fresh medium, with or without IL-4 (25 ng/mL) and rapamycin (Rap) (10 μM). After 24 h of stimulation, the expression of VDAC1, Cytc, Hsp60, Parkin, PINK1, p62, LC3II and I was analyzed by Western blot (A). BMDMs were cultured as described in Figure 6. The number of labeled mitochondria was measured by flow cytometry (B) and fluorescence staining (C) (scale bar: 20 μm). BMDMs were cultured as described in Figure 6. LysoTracker was used to label lysosomes, and MitoTracker was used to label mitochondria to detect the localization of mitochondria and lysosomes (scale bar: 10 μm) (D). After BMDMs were treated as described above and incubated overnight at 4 °C, they were incubated with secondary antibodies with different fluorescent tags for 1 h to detect the localization of VDAC1 and Parkin (scale bar: 10 μm) (E). Data are representative of 3 experiments.
Figure 6
Figure 6
Rap increases IL-4 stimulated glucose uptake and lactate production of Il33Tg BMDMs, and IL-33/ST2 signals in macrophages promote tumor growth in mice. BMDMs were cultured as described in Figure 1. Relative ATP levels (A), glucose uptake (B) and relative lactic acid production (C). * P < 0.05 vs. WT in basal or IL-4 treated conditions, # P < 0.05 treatment with Rap vs. no Rap when IL-33 was overexpressed. BMDMs from BALB/c or Il33Tg mice were cultured with or without IL-4 (25 ng/mL). After 24 h of stimulation, the MMPs stained with JC-1 were detected by flow cytometry (D). After the same treatment as in (A), p70s6k and P-p70s6k were analyzed by Western blot (E). Wild-type and ST2KO mice were inoculated with B16 cells on the back (6 mice per group; representative results are shown). Tumor pictures (F) were taken, and average tumor weights (G) were determined on the 28th day for tumor-bearing mice; average tumor volume (H) was measured every 7 days. Average mouse body weight (I) was determined. B16 cells were inoculated on the backs of wild-type and IL-33 overexpressing mice, and tumor pictures were taken on day 28, when tumor-bearing mice were sacrificed (J). The average tumor weight (K), average tumor volume (L) and average mouse weight (M) were measured every 7 days. Vertical bars = SEM (n = 3). Data are representative of 3 experiments.
Figure 7
Figure 7
Schematic diagram of how the IL-33/ST2 axis affects tumor growth in the microenvironment by regulating mitophagy of macrophages, thus reshaping their polarization. During the polarization of M2 macrophages induced by IL-4, the IL-33/ST2 axis in differentiated macrophages stimulated by M-CSF inhibits mitophagy by promoting the activity of mTOR, thereby weakening cellular glycolysis. Cellular oxidative phosphorylation is further enhanced, so that the M2 polarization of macrophages is further increased and ultimately promotes tumor growth. In addition, with further tumor development, the microenvironment continues to recruit IL-4 secreting immune cells (such as Th2 and mast cells), which further promote the transformation of macrophages to tumor-promoting M2 through the IL-33/ST2 axis; positive feedback promotes the continuous growth of tumors.

References

    1. Sica A, Larghi P, Mancino A, Rubino L, Porta C, Totaro MG, et al. Macrophage polarization in tumour progression. Semin Cancer Biol. 2008;18:349–55. - PubMed
    1. Locati M, Mantovani A, Sica A. Macrophage activation and polarization as an adaptive component of innate immunity. Adv Immunol. 2013;120:163–84. - PubMed
    1. Movahedi K, Laoui D, Gysemans C, Baeten M, Stange G, Van den Bossche J, et al. Different tumor microenvironments contain functionally distinct subsets of macrophages derived from Ly6C(high) monocytes. Cancer Res. 2010;70:5728–39. - PubMed
    1. Lawrence T, Natoli G. Transcriptional regulation of macrophage polarization: enabling diversity with identity. Nat Rev Immunol. 2011;11:750–61. - PubMed
    1. Yue ZQ, Liu YP, Ruan JS, Zhou L, Lu Y. Tumor-associated macrophages: a novel potential target for cancer treatment. Chin Med J (Engl) 2012;125:3305–11. - PubMed

Publication types

LinkOut - more resources