

Comparative transcriptome analysis of differentially expressed genes related to the physiological changes of yellow-green leaf mutant of maize
- PMID: 33628629
- PMCID: PMC7894110
- DOI: 10.7717/peerj.10567
Comparative transcriptome analysis of differentially expressed genes related to the physiological changes of yellow-green leaf mutant of maize
Abstract
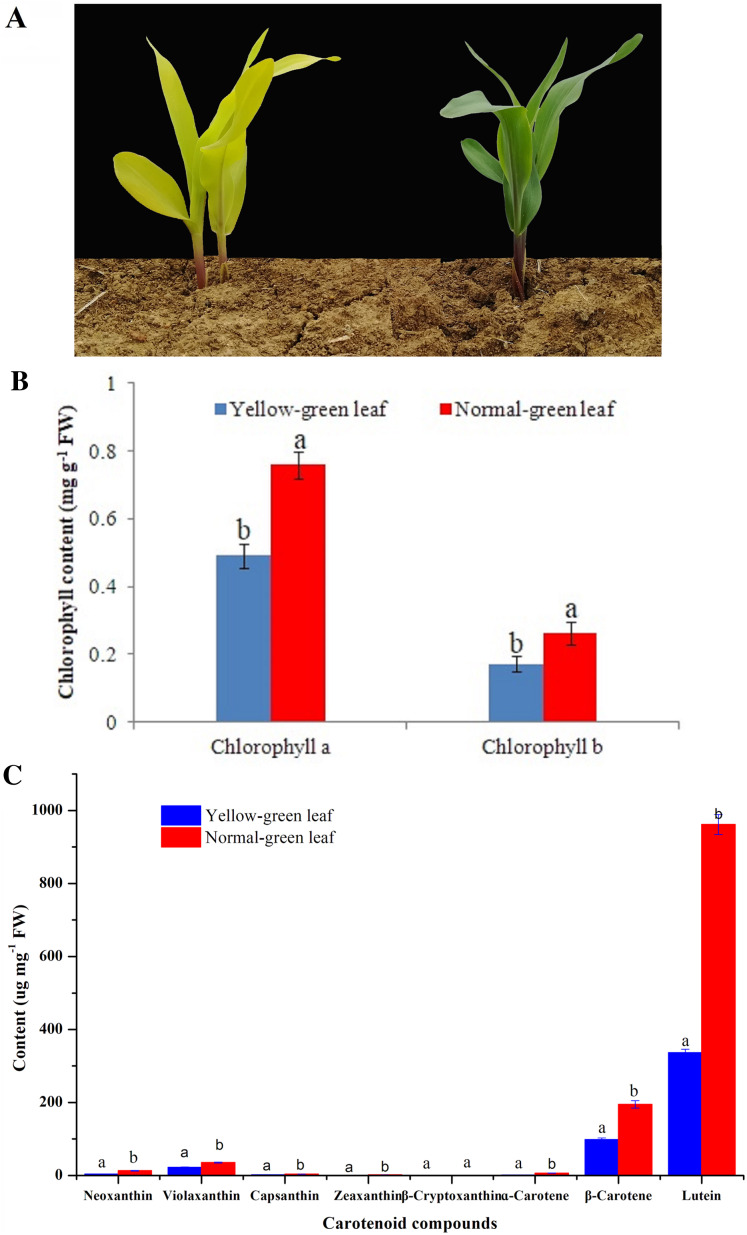
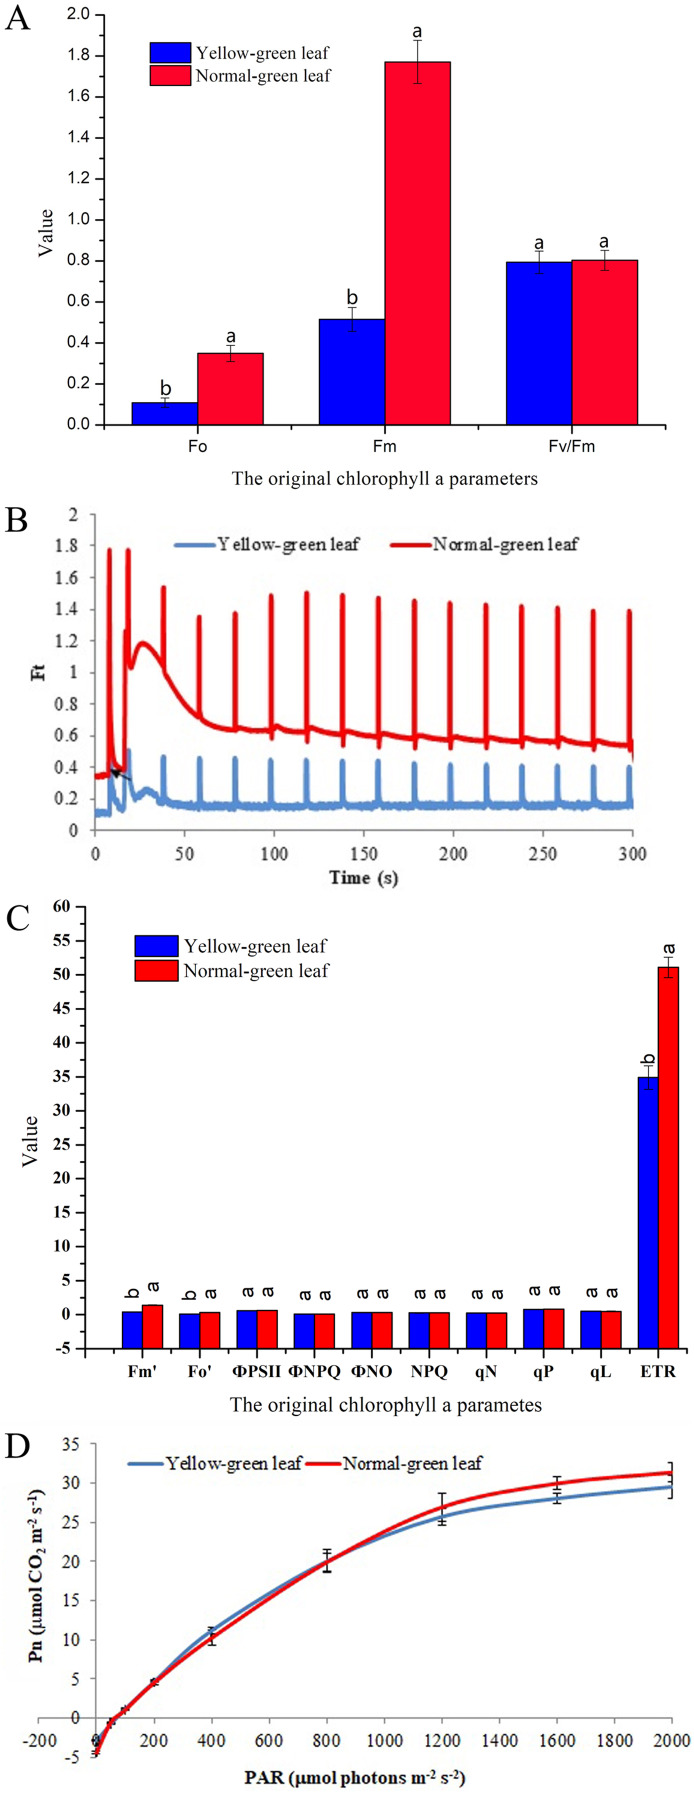
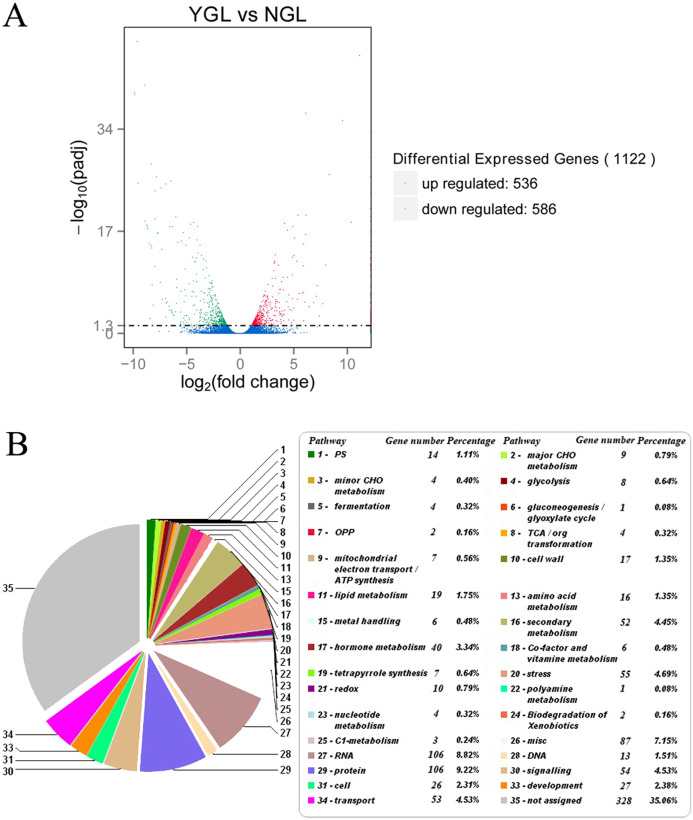
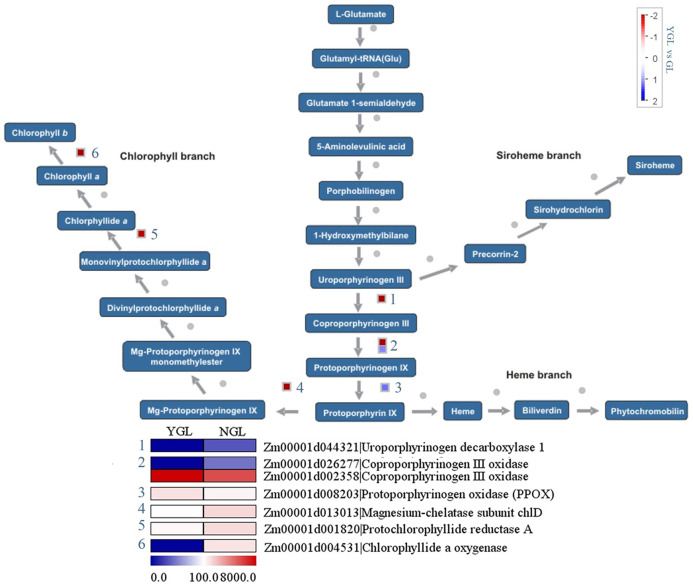
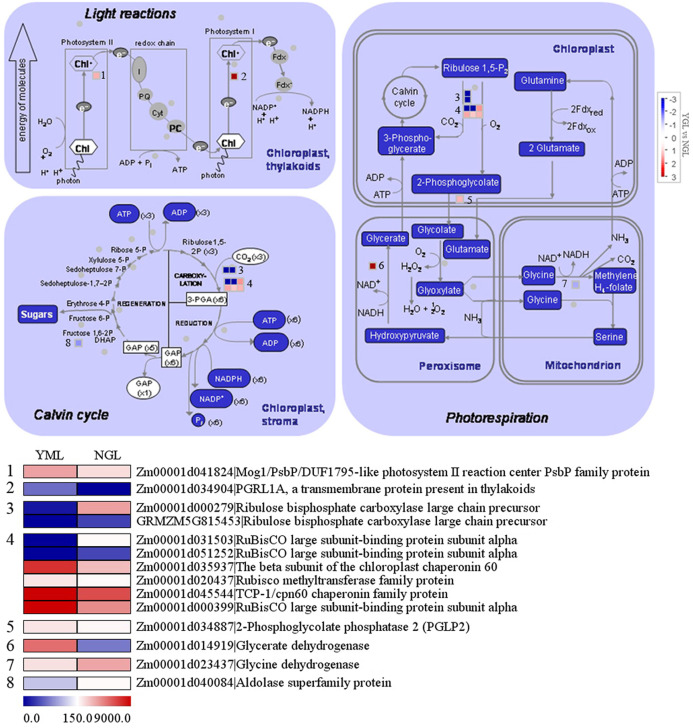
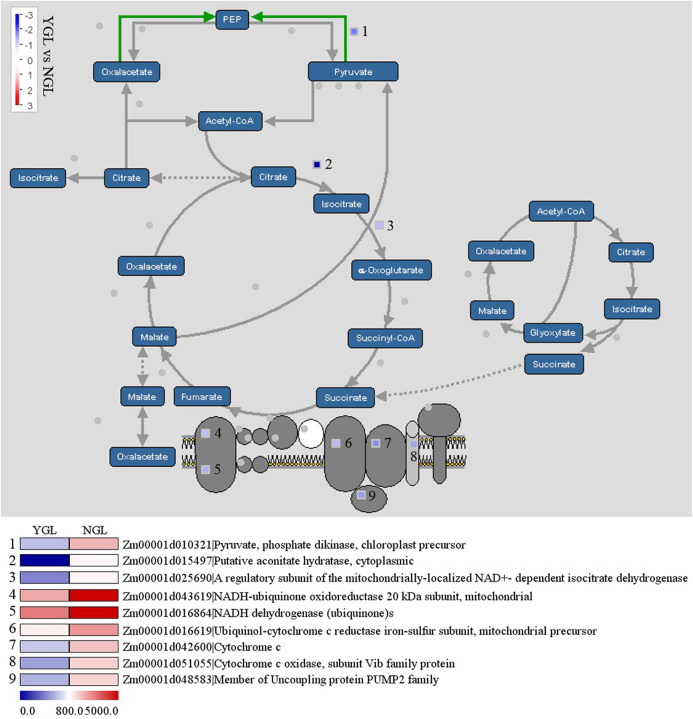
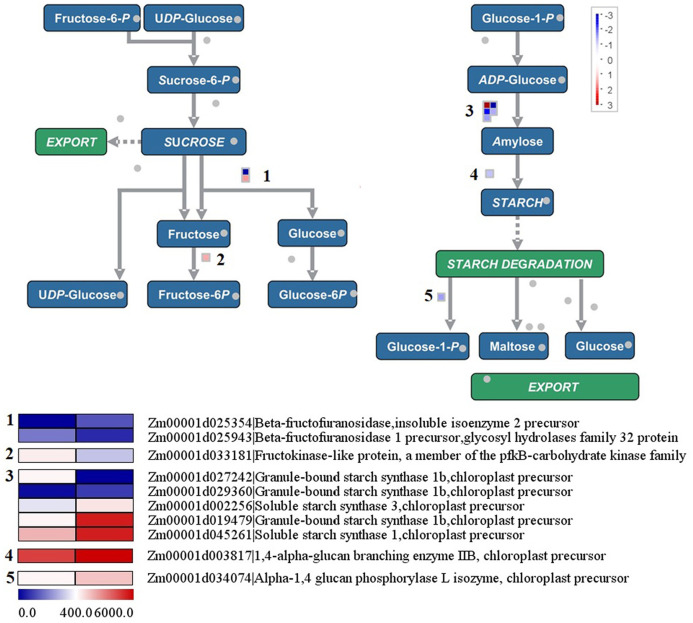
Chlorophylls, green pigments in chloroplasts, are essential for photosynthesis. Reduction in chlorophyll content may result in retarded growth, dwarfism, and sterility. In this study, a yellow-green leaf mutant of maize, indicative of abnormity in chlorophyll content, was identified. The physiological parameters of this mutant were measured. Next, global gene expression of this mutant was determined using transcriptome analysis and compared to that of wild-type maize plants. The yellow-green leaf mutant of maize was found to contain lower contents of chlorophyll a, chlorophyll b and carotenoid compounds. It contained fewer active PSII centers and displayed lower values of original chlorophyll fluorescence parameters than the wild-type plants. The real-time fluorescence yield, the electron transport rate, and the net photosynthetic rate of the mutant plants showed reduction as well. In contrast, the maximum photochemical quantum yield of PSII of the mutant plants was similar to that of the wild-type plants. Comparative transcriptome analysis of the mutant plants and wild-type plants led to the identification of differentially expressed 1,122 genes, of which 536 genes were up-regulated and 586 genes down-regulated in the mutant. Five genes in the chlorophyll metabolism pathway, nine genes in the tricarboxylic acid cycle and seven genes related to the conversion of sucrose to starch displayed down-regulated expression. In contrast, genes encoding a photosystem II reaction center PsbP family protein and the PGR5-like protein 1A (PGRL1A) exhibited increased transcript abundance.
Keywords: Chlorophyll biosynthesis; Photosynthesis; Secondary metabolism; Transcriptome analysis; Tricarboxylic acid cycle; Yellow-green leaf.
© 2021 Li et al.
Conflict of interest statement
The authors declare that they have no competing interests.
Figures
Similar articles
-
Characterization and transcriptomic analysis of a novel yellow-green leaf wucai (Brassica campestris L.) germplasm.BMC Genomics. 2021 Apr 12;22(1):258. doi: 10.1186/s12864-021-07573-7. BMC Genomics. 2021. PMID: 33845769 Free PMC article.
-
Molecular and Photosynthetic Performance in the Yellow Leaf Mutant of Torreya grandis According to Transcriptome Sequencing, Chlorophyll a Fluorescence, and Modulated 820 nm Reflection.Cells. 2022 Jan 27;11(3):431. doi: 10.3390/cells11030431. Cells. 2022. PMID: 35159241 Free PMC article.
-
Comparative transcriptome analysis reveals that chlorophyll metabolism contributes to leaf color changes in wucai (Brassica campestris L.) in response to cold.BMC Plant Biol. 2021 Sep 28;21(1):438. doi: 10.1186/s12870-021-03218-9. BMC Plant Biol. 2021. PMID: 34583634 Free PMC article.
-
Photosynthetic characteristics and genetic mapping of a yellow-green leaf mutant jym165 in soybean.BMC Plant Biol. 2024 Oct 26;24(1):1009. doi: 10.1186/s12870-024-05740-y. BMC Plant Biol. 2024. PMID: 39455920 Free PMC article.
-
Mutation in Mg-Protoporphyrin IX Monomethyl Ester Cyclase Decreases Photosynthesis Capacity in Rice.PLoS One. 2017 Jan 27;12(1):e0171118. doi: 10.1371/journal.pone.0171118. eCollection 2017. PLoS One. 2017. PMID: 28129387 Free PMC article.
Cited by
-
Genome-wide association study reveals genetic basis and candidate genes for chlorophyll content of leaves in maize (Zea mays L.).PeerJ. 2024 Oct 7;12:e18278. doi: 10.7717/peerj.18278. eCollection 2024. PeerJ. 2024. PMID: 39391824 Free PMC article.
-
Genome-Wide Association Study Identified Novel SNPs Associated with Chlorophyll Content in Maize.Genes (Basel). 2023 Apr 29;14(5):1010. doi: 10.3390/genes14051010. Genes (Basel). 2023. PMID: 37239370 Free PMC article.
-
Comparative Transcriptome Analysis Identified Key Pathways and Genes Regulating Differentiated Stigma Color in Melon (Cucumis melo L.).Int J Mol Sci. 2022 Jun 16;23(12):6721. doi: 10.3390/ijms23126721. Int J Mol Sci. 2022. PMID: 35743161 Free PMC article.
-
Physiological and Biochemical Responses of Sagittaria trifolia L. to Phytotoxic Ethyl Acetate Fungal Extract from Curvularia lunata Strain CLST-01.Plants (Basel). 2023 Apr 25;12(9):1758. doi: 10.3390/plants12091758. Plants (Basel). 2023. PMID: 37176815 Free PMC article.
-
Integrating Physiology, Cytology, and Transcriptome to Reveal the Leaf Variegation Mechanism in Phalaenopsis Chia E Yenlin Variegata Leaves.Biomolecules. 2024 Aug 7;14(8):963. doi: 10.3390/biom14080963. Biomolecules. 2024. PMID: 39199351 Free PMC article.
References
-
- Benjamini Y, Hochberg Y. Controlling the false discovery rate: a practical and powerful approach to multiple testing. Journal of the Royal Statistical Society. Series B. 1995;57(1):289–300. doi: 10.1111/j.2517-6161.1995.tb02031.x. - DOI
LinkOut - more resources
Full Text Sources
Other Literature Sources
