

Magnetic resonance diffusion tensor imaging applied to rat model of contrast-induced acute kidney injury
- PMID: 33628631
- PMCID: PMC7891085
- DOI: 10.7717/peerj.10620
Magnetic resonance diffusion tensor imaging applied to rat model of contrast-induced acute kidney injury
Abstract
Objectives: In this preclinical investigation, the feasibility of using diffusion tensor imaging (DTI) to study contrast-induced acute kidney injury (CIAKI) is explored, comparing radiographic outcomes with histopathologic and immunohistochemical findings after repeated animal exposures to iodinated contrast agent.
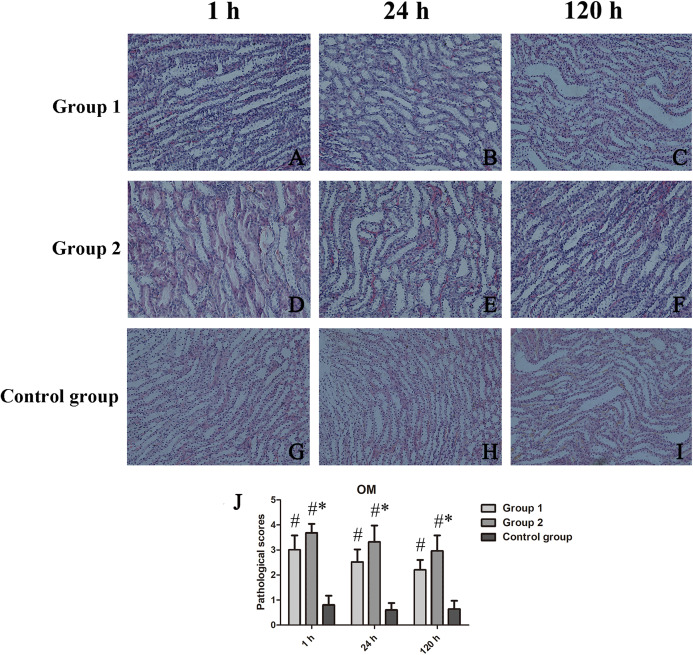
Materials and methods: Forty-five male wistar rats were allocated to three groups (n = 15 each), each receiving two separate injections 1 day apart: group 1 (iodixanol then saline); group 2 (iodixanol twice); and control group (saline twice). Five rats were then randomly selected from each group at three separate time points (1 h, 24 h, and 120 h) for magnetic resonance imaging (MRI). Upon MRI completion, the animals were sacrificed, examining renal tissue and serum creatinine level. DTI data served to calculate fractional anisotropy (FA) and apparent diffusion coefficient (ADC).
Results: FA values were significantly lower in group 2 than in the others. Compared with controls, FA assessments at 1 h, 24 h, and 120 h after injections commenced were significantly lower in group 2; and ADC was significantly more pronounced at 24 h. Serum creatinine levels at 24 h were markedly elevated in both groups 1 and 2. Pearson correlation analysis revealed significant negative correlations between FA (r = -0.730; p < 0.05) or ADC (r = -0.827; p < 0.05) and tubular injury and between FA (r = -0.563; p < 0.05) or ADC (r = -0.805; p < 0.05) and hypoxia-inducible factor-1α.
Conclusions: Analytic approaches to DTI with better reproducibility should aid in monitoring the early pathophysiologic derangements of CIAKI, thus facilitating timely reversal of the detrimental effects.
Keywords: Contrast-induced acute kidney injury; Chronic kidney disease; Diffusion tensor imaging; Hypoxia-inducible factor-1α.
© 2021 Wang et al.
Conflict of interest statement
The authors declare that they have no competing interests.
Figures


Similar articles
-
Application of diffusion tensor imaging and blood oxygenation level-dependent magnetic resonance imaging to assess bilateral renal function induced by Iohexol in rabbits.BMC Nephrol. 2020 Jun 3;21(1):210. doi: 10.1186/s12882-020-01857-y. BMC Nephrol. 2020. PMID: 32493274 Free PMC article.
-
Application of BOLD MRI and DTI for the evaluation of renal effect related to viscosity of iodinated contrast agent in a rat model.J Magn Reson Imaging. 2017 Nov;46(5):1320-1331. doi: 10.1002/jmri.25683. Epub 2017 Mar 1. J Magn Reson Imaging. 2017. PMID: 28248433
-
Diffusion weighted imaging and diffusion tensor imaging in the evaluation of transplanted kidneys.Eur J Radiol Open. 2015 May 16;2:71-80. doi: 10.1016/j.ejro.2015.05.001. eCollection 2015. Eur J Radiol Open. 2015. PMID: 26937439 Free PMC article.
-
The role of diffusion tensor imaging and fractional anisotropy in the evaluation of patients with idiopathic normal pressure hydrocephalus: a literature review.Neurosurg Focus. 2016 Sep;41(3):E12. doi: 10.3171/2016.6.FOCUS16192. Neurosurg Focus. 2016. PMID: 27581308 Review.
-
The role of diffusion tensor imaging in the evaluation of ischemic brain injury - a review.NMR Biomed. 2002 Nov-Dec;15(7-8):561-9. doi: 10.1002/nbm.786. NMR Biomed. 2002. PMID: 12489102 Review.
Cited by
-
Early Diagnosis of Acute Rejection and Acute Tubular Necrosis After Kidney Transplantation Using Magnetic Resonance Imaging: Evaluation of the Diffusion-Weighted Imaging Method.Cureus. 2025 Apr 23;17(4):e82879. doi: 10.7759/cureus.82879. eCollection 2025 Apr. Cureus. 2025. PMID: 40416269 Free PMC article.
-
Impact of Cordyceps sinensis on coronary computed tomography angiography image quality and renal function in a beagle model of renal impairment.Front Pharmacol. 2025 Jan 29;16:1538916. doi: 10.3389/fphar.2025.1538916. eCollection 2025. Front Pharmacol. 2025. PMID: 39944630 Free PMC article.
References
LinkOut - more resources
Full Text Sources
Other Literature Sources
