. 2021 Feb 9:2021:6613162.
doi: 10.1155/2021/6613162. eCollection 2021.

Schistosoma japonicum Infection in Treg-Specific USP21 Knockout Mice

Affiliations

Schistosoma japonicum Infection in Treg-Specific USP21 Knockout Mice

Youxiang Zhang et al. J Immunol Res. .

Abstract

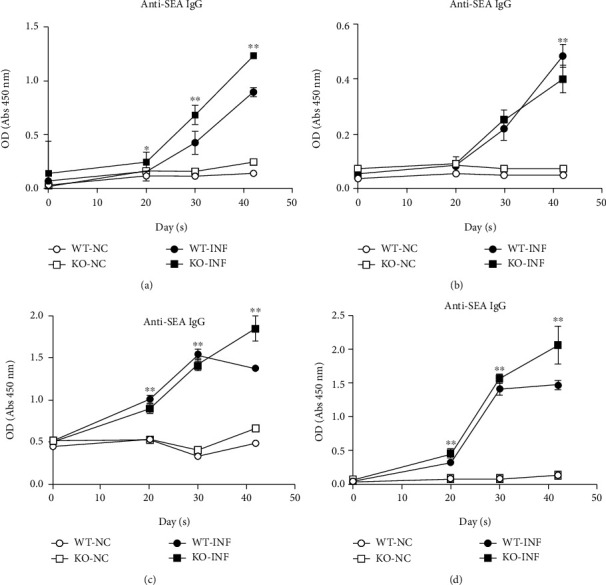
The E3 deubiquitinating enzyme ubiquitin-specific proteolytic enzyme 21 (USP21) plays vital roles in physiological activities and is required for Treg-cell-mediated immune tolerance. Using a murine model infected with Schistosoma japonicum, we observed that there were more cercariae developed into adults and more eggs deposited in the livers of the USP21fl/flFOXP3Cre (KO) mice. However, immunohistochemistry showed that the degree of egg granuloma formation and liver fibrosis was reduced. In USP21fl/flFOXP3Cre mice, levels of IFN-gamma, IL-4, anti-soluble egg antigen (SEA) IgG and anti-soluble worm antigen preparation (SWAP) IgG increased in blood, as determined using ELISAs and multiplex fluorescent microsphere immunoassays, while the levels of IL-10, lL-17A, IL-23, IL-9, and anti-SEA IgM decreased. In addition, the levels of the USP21 protein and mRNA in the liver and spleen of KO mice decreased. We further observed increased Th1 responses amplified by Tregs (regulatory T cells) and compromised Th17 responses, which alleviated the liver immunopathology. We speculated that these changes were related to polarization of Th1-like Tregs. Our results revealed the roles of USP21 in Treg-cell-mediated regulation of immune interactions between Schistosoma and its host. USP21 may have potential for regulating hepatic fibrosis in patients with schistosomiasis.


Conflict of interest statement

The authors declare that no conflicts of interest exist regarding the publication of this paper.

Figures

Figure 1
Figure 1
Deletion of USP21 in Tregs reduces the resistance to S. japonicum in infected mice. (a–e) FOXP3Cre (WT) and USP21fl/flFOXP3Cre (KO) mice (n = 26 ± 2/group) were infected with 25 ± 2 cercariae through the abdomen and were sacrificed 6 weeks after infection. The liver and spleen tissues were collected, and the adults were recovered. (a) Comparison of the number of females, males, pairs, and adults recovered from the WT- and KO-infected (INF) groups (n = mean ± SD), p = 0.01 for the total number of adults and ∗∗p = 0.036 for the total number of worm pairs. (b) Representative images of the livers of the WT and KO mice from the NC and INF groups. (c) Liver weight of the WT and KO mice in the NC and INF groups (weight = mean ± SD); p > 0.05 was considered a difference that was not statistically significant between the normal control group and the infected group. (d) Representative images of the spleens of the WT and KO mice in the NC and INF groups. (e) Spleen weight of the WT and KO mice in the NC and INF groups (weight = mean ± SD); ∗∗p = 0.007 compared with the normal control group; p > 0.05 represented a difference that was not statistically significant compared with the infected group.
Figure 2
Figure 2
Effect of USP21 on S. japonicum eggs in infected KO mice. (a–c) The livers were harvested from the mice on the 42nd day after the infection for HE staining, and the number of eggs was counted under the microscope (n = 2 from the uninfected group and n = 10 from the infected group). (a) Statistical graph of the eggs in the livers of the WT-INF group and the KO-INF group (the data are presented as the means ± SD, p = 0.043). (b) Representative images of HE staining in the livers of WT-INF and KO-INF groups (original magnification: 100x). The arrows indicate the granulomas. (c) Comparison of the liver egg granuloma areas between the WT-INF and KO-INF groups. The data are presented as the means ± SD, p = 0.022.
Figure 3
Figure 3
Changes in liver fibrosis in USP21fl/flFOXP3cre mice infected with S. japonicum. (a–e) The livers were harvested from the mice on the 42nd day after the infection and stained with Masson's trichrome (n = 10 animals/group). (a) Representative images of collagen deposition in the WT-INF and KO-INF mice (original magnification: 100x) were obtained. The blue areas are collagen granules. (b) Comparison of the percentages of the hepatic fibrosis area between the WT-INF and KO-INF groups. The data are presented as the means ± SD, p = 0.039. (c) Comparison of the levels the α-SMA, Collagen I, and Collagen III mRNAs in the WT and KO mice in the NC and INF groups. The data are presented as the means ± SD. Comparison of the levels of the α-SMA, Collagen I, and Collagen III mRNAs between the infected groups. The data are presented as the means ± SD. In the infection group, α-SMA: ∗∗p < 0.001; collagen I: ∗∗p = 0.008, and Collagen III: ∗∗p = 0.006. (d) Representative images of SMA, Collagen I, and Collagen III protein expression in the WT and KO mice from the NC and INF groups, as determined by Western blotting. (e) Comparison of protein expression between WT and KO mice in the NC and INF groups. The data are presented as the means ± SD. In the infection group, α-SMA: p = 0.034, Collagen I: ∗∗p = 0.006, and Collagen III: p = 0.03.
Figure 4
Figure 4
Liver immunity in USP21fl/flFOXP3cre mice infected with S. japonicum. (a) Representative images of USP21 protein expression in the in WT and KO mice in the NC and INF groups determined using Western blotting (n = 6 mice/group). (b) Comparison of protein expression in the WT and KO mice in the NC and INF groups (n = 6 mice/group). The data are presented as the means ± SD, and the difference between the infection groups was significant (∗∗p < 0.001). (c) Comparison of the USP21 mRNA levels between WT and KO mice in the NC and INF groups (n = 6 mice/group). The data are presented as the means ± SD, ∗∗p = 0.001 for the comparison between the infection groups. (d) Comparison of the levels of the FOXP3, IL-10, and IL-17 mRNAs in the WT and KO mice from the NC and INF groups (n = 6 mice/group). The data are presented as the means ± SD; for the comparison between the infection groups: IL-10 ∗∗p = 0.003 and IL-17 p = 0.026.
Figure 5
Figure 5
Changes in splenic immunity in USP21fl/flFOXP3cre mice infected with S. japonicum. (a–c) The spleens were harvested from the mice on the 42nd day after the infection. (a) CD4+CD25+FOXP3high cells directly isolated from the spleens of WT and KO mice in the NC and INF groups were identified using flow cytometry at 42 days after the infection with S. japonicum. Comparison of the proportion of CD4+CD25+FOXP3high cells among the CD4+ T cell population in the WT and KO mice in the NC and INF groups. The data are presented as the means ± SD, infection groups: ∗∗p = 0.007. (b) Comparison of the mRNA levels of FOXP3, IL-10, IL-17, and USP21 in the WT and KO mice in the NC and INF groups, and the data are presented as the means ± SD. For the comparison between the infection groups, FOXP3 ∗∗p = 0.001, IL-10 ∗∗p < 0.001, IL-17 ∗∗p < 0.001, and USP21 ∗∗p < 0.001. (c) The splenic cells were cultured in vitro (n = 6/group). Comparison of the levels of IFN-gamma, IL-4, IL-10, IL-17A, IL-23, and IL-9 in cultured spleen cells from the WT and KO mice in the NC and INF groups. The data are presented as the means ± SD. In the NC group, IFN-gamma ∗∗p = 0.002 and IL-4 p = 0.002; for the comparison between the infection groups, IFN-gamma p = 0.013, IL-4 ∗∗p = 0.005, and IL-10 ∗∗p = 0.004.
Figure 6
Figure 6
Specific antibody responses in USP21fl/flFOXP3Cre mice infected with S. japonicum. (a–d) Serum collected from the WT and KO mice in the NC and INF groups (n = 26 ± 2/group) at different stages of the infection (uninfected, day 20, day 30, day 42). (a) Comparison of the changes in the anti-SEA IgG content. The data are presented as the means ± SD. For the comparison between infection groups, p = 0.01 on day 20, ∗∗p < 0.001 on day 30, and∗∗p < 0.001 on day 42. (b) Comparison of the anti-SEA IgM content. The data are presented as the means ± SD, and ∗∗p = 0.002 on day 42 when comparing between the infection groups. (c) Comparison of the anti-SWAP IgG contents. The data are presented as the means ± SD; for the comparison between infection groups, ∗∗p < 0.001 on day 20, ∗∗p = 0.003 on day 30, and ∗∗p < 0.001 on day 42. (d) Comparison of the anti-SWAP IgM contents. The data are presented as the means ± SD. For the comparison between infection groups, ∗∗p < 0.001 on day 20, ∗∗p = 0.004 on day 30, and ∗∗p < 0.001 on day 42.
Figure 7
Figure 7
Serum cytokines in USP21fl/flFOXP3Cre mice infected with S. japonicum. (a) Comparison of the concentrations of IFN-gamma, IL-4, IL-10, IL-17A, IL-23, and IL-9 in the cultures of peripheral blood lymphocytes isolated from the WT and KO mice in the NC and INF groups 42 days after the infection (n = 10 mice/group). The data are presented as the means ± SD, IL-4 ∗∗p = 0.008, and IL-23 p = 0.035 for the comparison between the infection groups. (b) Comparison of the serum IFN-gamma, IL-4, IL-10, IL-17A, IL-23, and IL-9 levels in the WT- and KO-INF groups (n = 26 ± 2/group) at different time points (uninfected, 20th day after infection, 30th day after infection, and 42nd day after infection). The data are presented as the means ± SD. IFN-γp = 0.024 on day 20 and ∗∗p < 0.001 on day 42; IL-10 ∗∗p < 0.001 on day 20 and p = 0.017 on day 30; IL-17A p = 0.026 on day 20, p < 0.001 on day 30, and ∗∗p < 0.001 on day 42; IL-23 ∗∗p < 0.001 on day 30; and IL-9 ∗∗p < 0.001 on day 42.

Similar articles

Cited by

References

    1. Mutapi F., Maizels R., Fenwick A., Woolhouse M. Human schistosomiasis in the post mass drug administration era. The Lancet Infectious Diseases. 2017;17(2):e42–e48. doi: 10.1016/S1473-3099(16)30475-3. - DOI - PMC - PubMed
    1. McManus D. P., Dunne D. W., Sacko M., Utzinger J., Vennervald B. J., Zhou X. N. Schistosomiasis. Nature Reviews Disease Primers. 2018;4(1):p. 13. doi: 10.1038/s41572-018-0013-8. - DOI - PubMed
    1. Allen J. E., Maizels R. M. Diversity and dialogue in immunity to helminths. Nature Reviews Immunology. 2011;11(6):375–388. doi: 10.1038/nri2992. - DOI - PubMed
    1. Yang Q., Qu J., Jin C., et al. Schistosoma japonicum infection promotes the response of Tfh cells through down-regulation of caspase-3-mediating apoptosis. Frontiers in Immunology. 2019;10, article 2154 doi: 10.3389/fimmu.2019.02154. - DOI - PMC - PubMed
    1. Zhan T., Ma H., Jiang S., et al. Interleukin-9 blockage reduces early hepatic granuloma formation and fibrosis during Schistosoma japonicum infection in mice. Immunology. 2019;158(4):296–303. doi: 10.1111/imm.13111. - DOI - PMC - PubMed

MeSH terms

LinkOut - more resources