. 2021 Feb 12:2021:6617841.
doi: 10.1155/2021/6617841. eCollection 2021.

Identification of a New Prognostic Risk Signature of Clear Cell Renal Cell Carcinoma Based on N6-Methyladenosine RNA Methylation Regulators

Affiliations

Identification of a New Prognostic Risk Signature of Clear Cell Renal Cell Carcinoma Based on N6-Methyladenosine RNA Methylation Regulators

Yan Zhang et al. J Immunol Res. .

Abstract

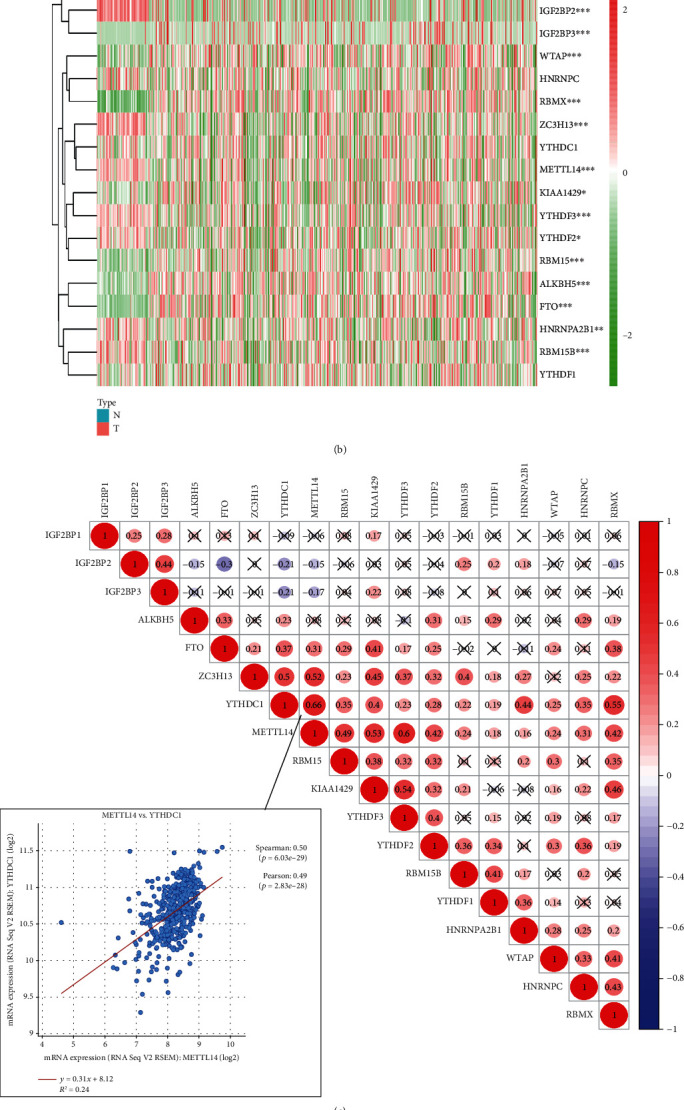
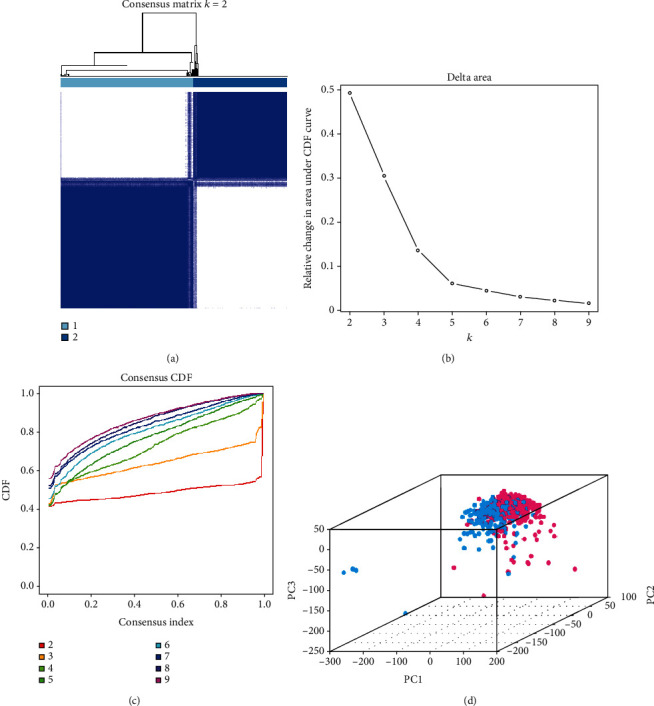
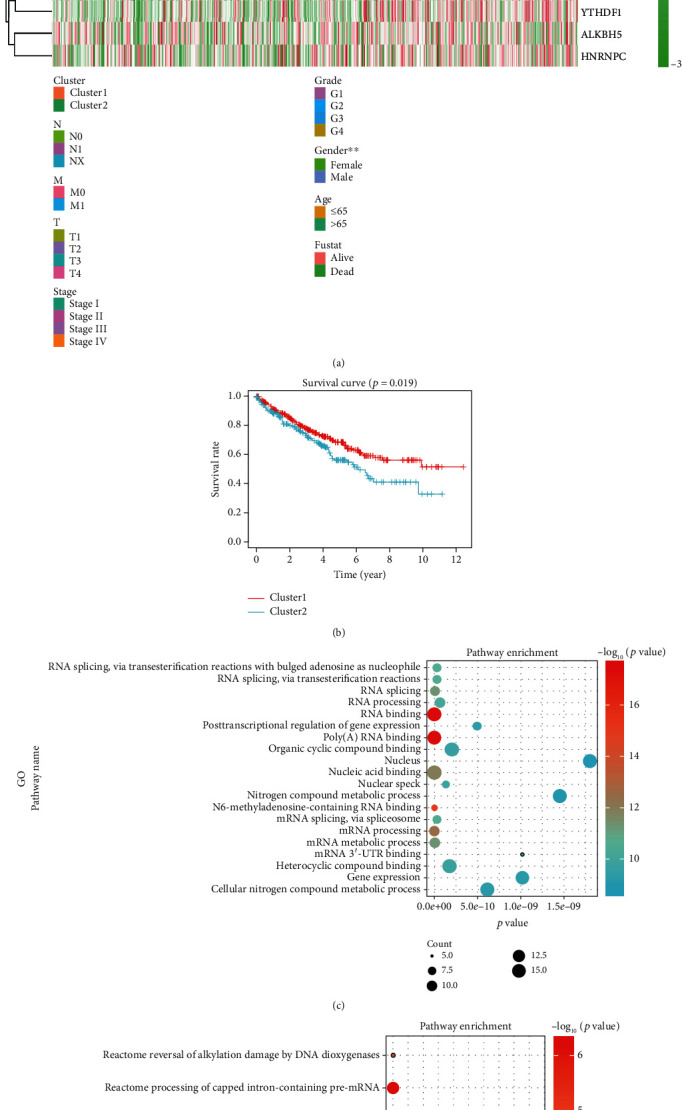
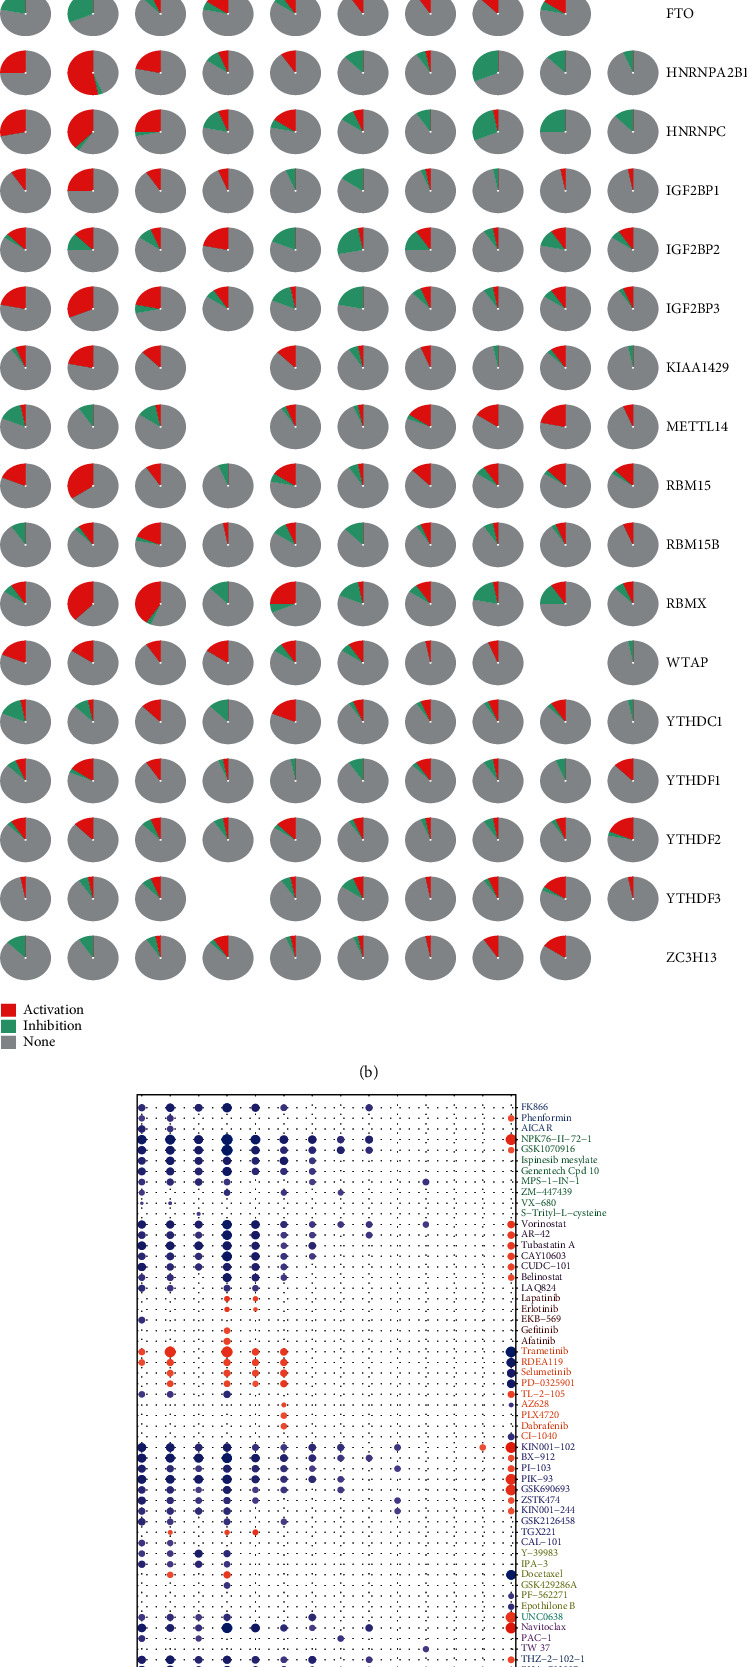
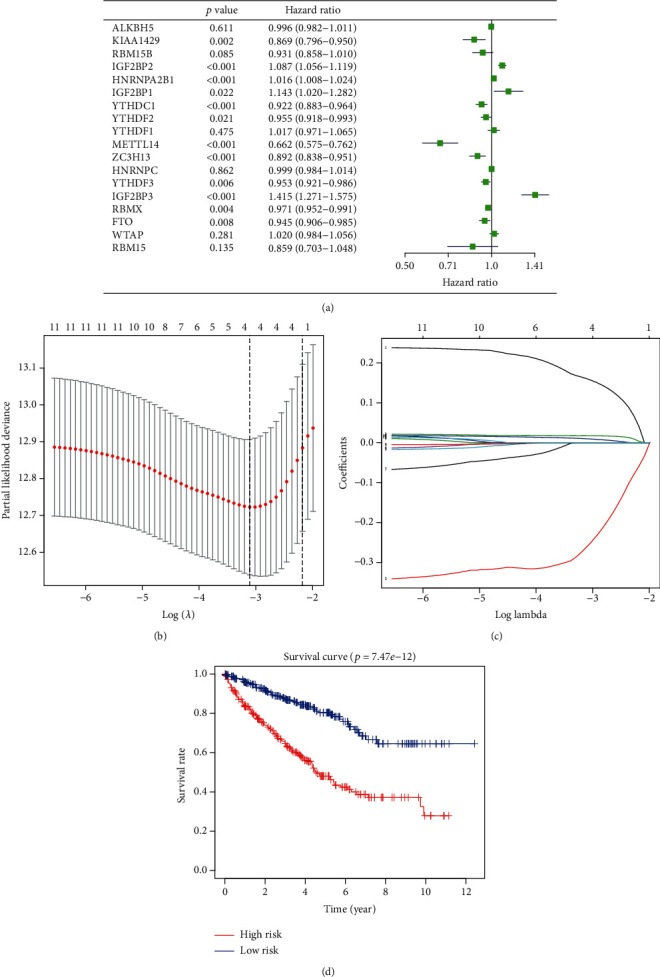
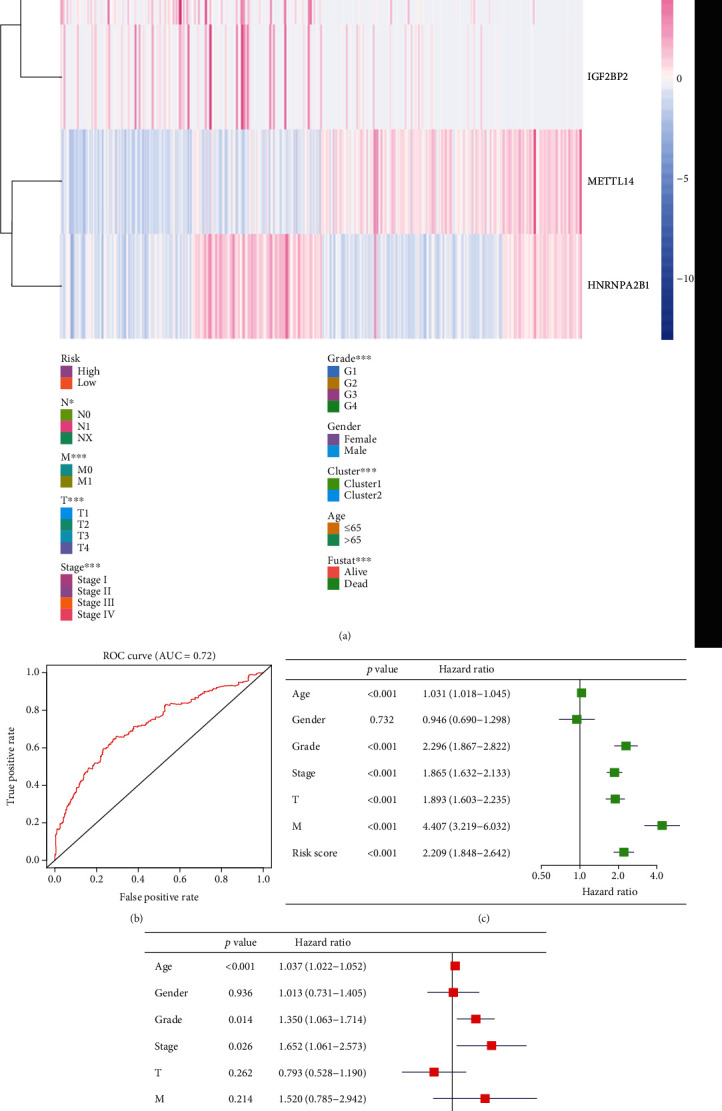
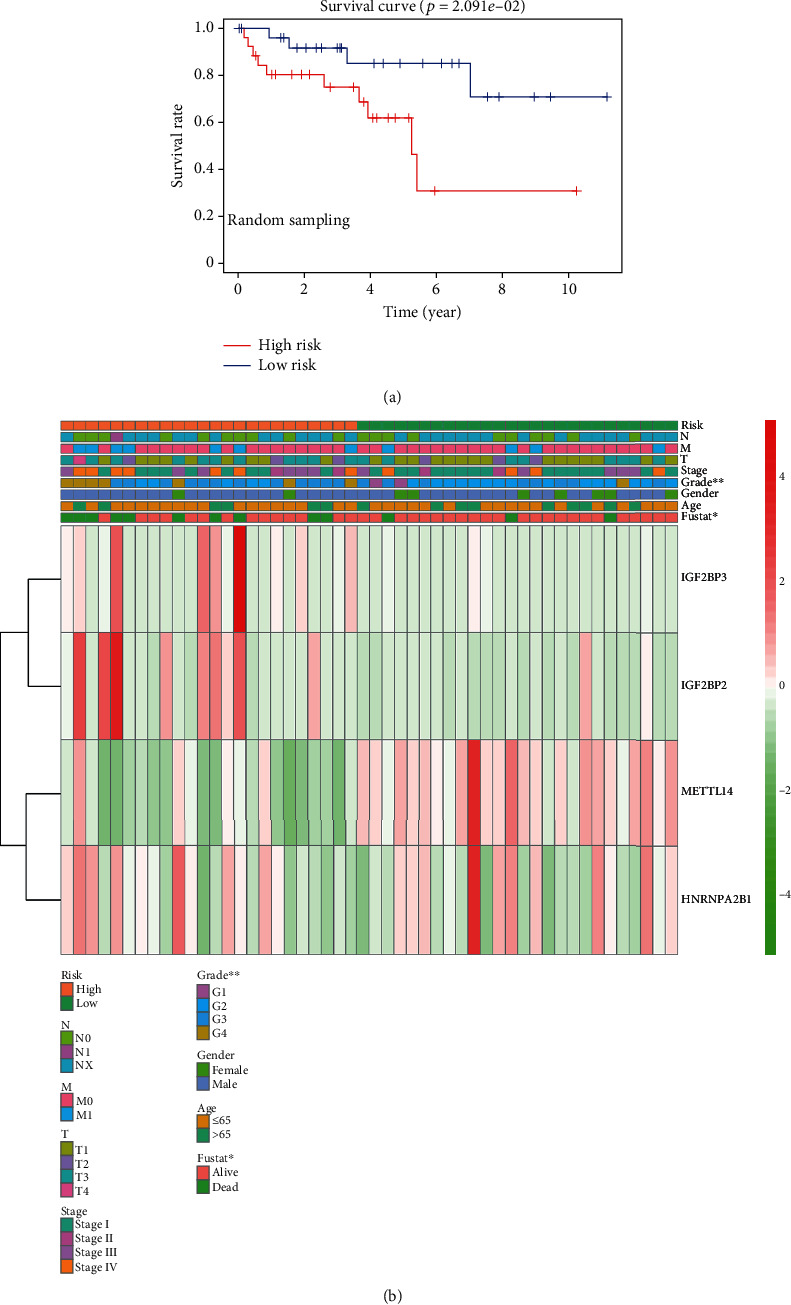
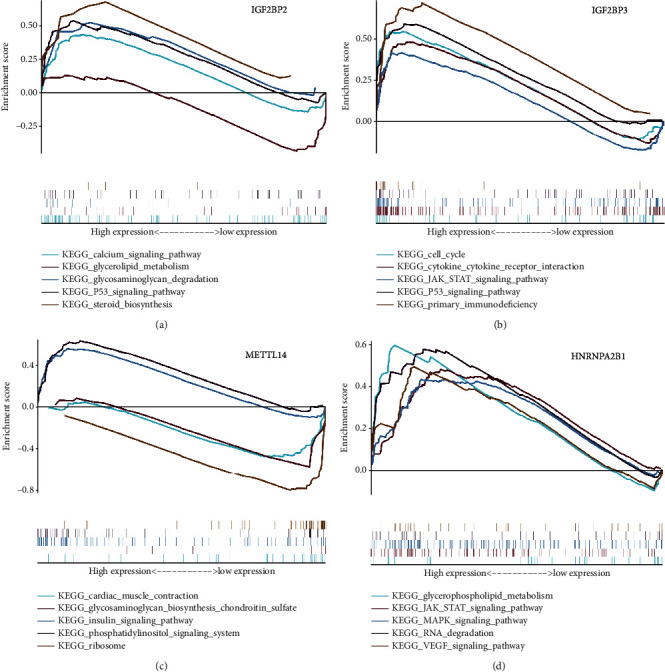
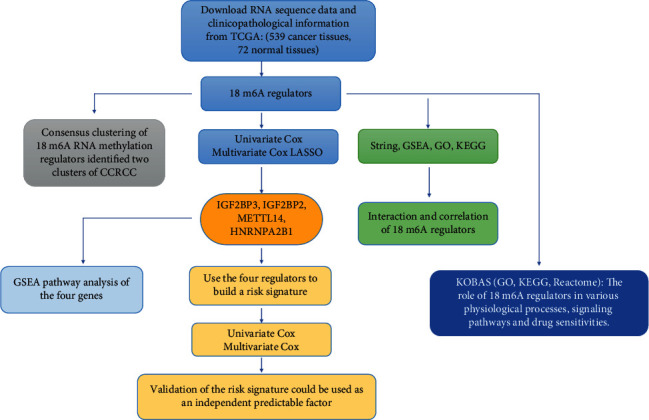
As the most prevalent internal eukaryotic modification, N6-methyladenosine (m6A) is installed by methyltransferases, removed by demethylases, and recognized by readers. However, there are few studies on the role of m6A in clear cell renal cell carcinoma (ccRCC). In this study, we researched the RNA-seq transcriptome data of ccRCC in the TCGA dataset and used bioinformatics analyses to detect the relationship between m6A RNA methylation regulators and ccRCC. First, we compared the expression of 18 m6A RNA methylation regulators in ccRCC patients and normal tissues. Then, data from ccRCC patients were divided into two clusters by consensus clustering. LASSO Cox regression analysis was used to build a risk signature to predict the prognosis of patients with ccRCC. An ROC curve, univariate Cox regression analysis, and multivariate Cox regression analysis were used to verify this risk signature's predictive ability. Then, we internally validated this signature by random sampling. Finally, we explored the role of the genes in the signature in some common pathways. Gene distribution between the two subgroups was different; cluster 2 was gender-related and had a worse prognosis. IGF2BP3, IGF2BP2, HNRNPA2B1, and METTL14 were chosen to build the risk signature. The overall survival of the high- and low-risk groups was significantly different (p = 7.47e - 12). The ROC curve also indicated that the risk signature had a decent predictive significance (AUC = 0.72). These results imply that the risk signature has a potential value for ccRCC treatment.


Conflict of interest statement

The authors declare that there is no conflict of interests.

Figures

Figure 1
Figure 1
The panorama of m6A RNA methylation regulators in ccRCC. (a) The m6A RNA methylation process and the regulators involved. (b) Expression levels of 18 m6A RNA methylation regulators in ccRCC and normal tissues. The upper tree diagram represents grouping results for the samples, whereas the tree on the left represents cluster analysis results for regulators. Highly expressed genes are represented by a red-colored gradient: the highest the expression, the darker the red tone. In contrast, lowly expressed genes are represented by a green-colored gradient, being the genes with the lowest expression the darker ones. (c) Spearman correlation analysis of the 18 m6A RNA methylation regulators in ccRCC and verification of the correlation between YTHDC1 and RBM15. (d) Vioplot visualizing differentially expressed m6A RNA methylation regulators in ccRCC. The x-axis represents different genes, the y-axis represents gene expression, blue represents normal kidney tissue, and red represents ccRCC tissue. p < 0.05, ∗∗p < 0.01, and ∗∗∗p < 0.001.
Figure 2
Figure 2
Identification of consensus clusters by m6A RNA methylation regulators. (a) When k = 2: correlation between groups. (b) Relative change in the area under the cumulative distribution function (CDF) curve for k values from 2 to 9. (c) Consensus clustering CDF when k value ranges from 2 to 9. (d) Principal component analysis of the total RNA expression profile in the TCGA dataset (cluster 1 is marked in red and cluster 2 in blue).
Figure 3
Figure 3
Prognosis and clinicopathological features of ccRCC. (a) The heat map and clinicopathological features of the two clusters were identified by m6A RNA methylation regulators. (b) Kaplan-Meier overall survival (OS) rate curve of patients with ccRCC (cluster 1 patients: red; cluster 2 patients: blue). (c, d) Results from pathway enrichment of the data using Gene Ontology (GO), KEGG, and Reactome. The size of each dot represents the pathway count. High p values are represented by a red-colored dot: the highest the value, the darker the red tone. In contrast, low p values are represented by a blue-colored dot, being the lowest values the darker ones. p < 0.05, ∗∗p < 0.01, and ∗∗∗p < 0.001.
Figure 4
Figure 4
Physiological processes, signaling pathways, and drug sensitivities relevant to m6A methylation regulators. (a) Effect of m6A methylation regulators on physiological processes and signaling pathways. A: active; I: inhibited; the darker the color, the stronger the inhibition (blue) or activation (red). If a regulator activates a process or a pathway, the activation index is higher than the inhibition index. On the contrary, if the inhibition index has the highest value, then the process is inhibited. (b) Pie chart showing the results from (a) (red: activation; green: inhibition). (c) Drug sensitivities of m6A methylation regulators (ordinate axis: various drugs; abscissa axis: regulators).
Figure 5
Figure 5
Risk signature for ccRCC. (a) Hazard ratios (HRs) and 95% confidence intervals (CIs) were calculated using univariate Cox regression. (b, c) Coefficients calculated by the least absolute shrinkage and selection operator (LASSO) multivariate Cox regression algorithm. (d) Kaplan-Meier overall survival (OS) rate curve for high-risk (red) and low-risk (blue) groups of patients.
Figure 6
Figure 6
Prognosis value and accuracy of the risk signature. (a) Comparison of clinicopathological characteristics and expression of IGF2BP3, IGF2BP2, HNRNPA2B1, and METTL14 between the two groups defined by the risk signature. (b) ROC curve representing the efficiency and accuracy of the risk signature: the ROC curve for 5-year survival prediction by risk signature (date from TCGA). (c) Univariate Cox regression analysis of the association between clinicopathological factors, risk score, and overall survival of patients from TCGA datasets. (d) Multivariate Cox regression analysis of the association between clinicopathological factors, risk score, and overall survival of patients from TCGA datasets. p < 0.05, ∗∗p < 0.01, and ∗∗∗p < 0.001.
Figure 7
Figure 7
Random sampling of data in TCGA to validate the accuracy of the signature. (a) Kaplan-Meier overall survival (OS) rate curve of high-risk (red) and low-risk (blue) patients with ccRCC. Data was obtained by random sampling from TCGA. (b) Heat map of clinicopathological features and expression levels of IGF2BP3, IGF2BP2, HNRNPA2B1, and METTL14 genes in the randomly sampled data.
Figure 8
Figure 8
Nomogram to predict 5-year, 7-year, and 10-year OS of ccRCC patients.
Figure 9
Figure 9
GSEA pathway analysis of IGF2BP3, IGF2BP2, HNRNPA2B1, and METTL14 genes. (a–d) An upward parabola indicates that the indicated gene promotes the pointed pathway; otherwise, the pathway is suppressed.
Figure 10
Figure 10
The flowchart of this study.

Similar articles

Cited by

References

    1. Siegel R. L., Miller K. D., Jemal A. Cancer statistics, 2019. CA: a Cancer Journal for Clinicians. 2019;69(1):7–34. doi: 10.3322/caac.21551. - DOI - PubMed
    1. Leibovich B. C., Lohse C. M., Crispen P. L., et al. Histological subtype is an independent predictor of outcome for patients with renal cell carcinoma. The Journal of Urology. 2010;183(4):1309–1316. doi: 10.1016/j.juro.2009.12.035. - DOI - PubMed
    1. Harshman L. C., Choueiri T. K., Drake C., Stephen Hodi F. Subverting the B7-H1/PD-1 pathway in advanced melanoma and kidney cancer. Cancer Journal. 2014;20(4):272–280. doi: 10.1097/PPO.0000000000000055. - DOI - PMC - PubMed
    1. Desrosiers R., Friderici K., Rottman F. Identification of methylated nucleosides in messenger RNA from Novikoff hepatoma cells. Proceedings of the National Academy of Sciences of the United States of America. 1974;71(10):3971–3975. doi: 10.1073/pnas.71.10.3971. - DOI - PMC - PubMed
    1. Ke S., Alemu E. A., Mertens C., et al. A majority of m6A residues are in the last exons, allowing the potential for 3' UTR regulation. Genes & Development. 2015;29(19):2037–2053. doi: 10.1101/gad.269415.115. - DOI - PMC - PubMed

MeSH terms