. 2020 Oct 26;2(2):fcaa178.
doi: 10.1093/braincomms/fcaa178. eCollection 2020.

Magnetic resonance imaging pattern recognition in childhood bilateral basal ganglia disorders

Collaborators, Affiliations

Magnetic resonance imaging pattern recognition in childhood bilateral basal ganglia disorders

Shekeeb S Mohammad et al. Brain Commun. .

Erratum in

Abstract

Bilateral basal ganglia abnormalities on MRI are observed in a wide variety of childhood disorders. MRI pattern recognition can enable rationalization of investigations and also complement clinical and molecular findings, particularly confirming genomic findings and also enabling new gene discovery. A pattern recognition approach in children with bilateral basal ganglia abnormalities on brain MRI was undertaken in this international multicentre cohort study. Three hundred and five MRI scans belonging to 201 children with 34 different disorders were rated using a standard radiological scoring proforma. In addition, literature review on MRI patterns was undertaken in these 34 disorders and 59 additional disorders reported with bilateral basal ganglia MRI abnormalities. Cluster analysis on first MRI findings from the study cohort grouped them into four clusters: Cluster 1-T2-weighted hyperintensities in the putamen; Cluster 2-T2-weighted hyperintensities or increased MRI susceptibility in the globus pallidus; Cluster 3-T2-weighted hyperintensities in the globus pallidus, brainstem and cerebellum with diffusion restriction; Cluster 4-T1-weighted hyperintensities in the basal ganglia. The 34 diagnostic categories included in this study showed dominant clustering in one of the above four clusters. Inflammatory disorders grouped together in Cluster 1. Mitochondrial and other neurometabolic disorders were distributed across clusters 1, 2 and 3, according to lesions dominantly affecting the striatum (Cluster 1: glutaric aciduria type 1, propionic acidaemia, 3-methylglutaconic aciduria with deafness, encephalopathy and Leigh-like syndrome and thiamine responsive basal ganglia disease associated with SLC19A3), pallidum (Cluster 2: methylmalonic acidaemia, Kearns Sayre syndrome, pyruvate dehydrogenase complex deficiency and succinic semialdehyde dehydrogenase deficiency) or pallidum, brainstem and cerebellum (Cluster 3: vigabatrin toxicity, Krabbe disease). The Cluster 4 pattern was exemplified by distinct T1-weighted hyperintensities in the basal ganglia and other brain regions in genetically determined hypermanganesemia due to SLC39A14 and SLC30A10. Within the clusters, distinctive basal ganglia MRI patterns were noted in acquired disorders such as cerebral palsy due to hypoxic ischaemic encephalopathy in full-term babies, kernicterus and vigabatrin toxicity and in rare genetic disorders such as 3-methylglutaconic aciduria with deafness, encephalopathy and Leigh-like syndrome, thiamine responsive basal ganglia disease, pantothenate kinase-associated neurodegeneration, TUBB4A and hypermanganesemia. Integrated findings from the study cohort and literature review were used to propose a diagnostic algorithm to approach bilateral basal ganglia abnormalities on MRI. After integrating clinical summaries and MRI findings from the literature review, we developed a prototypic decision-making electronic tool to be tested using further cohorts and clinical practice.

Keywords: MRI; basal ganglia; pattern recognition; striatal necrosis; striatum.


Conflict of interest statement

None of the authors have any competing interests to declare. All research at Great Ormond Street Hospital NHS Foundation Trust and UCL Great Ormond Street Institute of Child Health is made possible by the National institute for health research, (NIHR) Great Ormond Street Hospital Biomedical Research Centre. The views expressed are those of the author(s) and not necessarily those of the NHS, the NIHR or the Department of Health.

Figures

Graphical Abstract
Graphical Abstract
Figure 1
Figure 1
‘Best fit’ Euclidean-average four cluster plot. Cluster plot derived using Euclidean distance and average agglomeration algorithm divides the cohort of 201 first MRI scans into four clusters. Each individual number within the clusters represents one patient. The major MRI features that determined cluster distribution are: Cluster 1: T2W hyperintensities in the putamen, Cluster 2: T2W hyperintensities or increased susceptibility in the GP/SN/STN, Cluster 3: T2W hyperintensities in the GP, brainstem and cerebellum with diffusion restriction and Cluster 4: T1W hyperintensities in the basal ganglia without T2W hyperintensities or diffusion restriction. Dim, dimension; GP, globus pallidus; SN, substantia nigra; STN, subthalamic nucleus.
Figure 2
Figure 2
Proportion-based heatmap of selected MRI features on first included scan. The figure describes the presence and absence of specific MRI features on the first included MRI from 201 patients. Diagnostic categories are shown in the second column and are organized according to grouping in one of four clusters depicted in the first column. The third column shows the number of cases for each diagnostic category that grouped in the respective cluster depicted by the heat map shading as per the included scale. Increasingly darker shades depict higher proportions of patients. The fourth column shows the total number of cases for each diagnostic category included in the study. The remaining cells provide a heat map of the proportion of patients in each diagnostic category demonstrating the specific MRI features. An overall picture of the percentage of patients demonstrating specific MRI features can be gained by the heat map colour scheme with the included scale providing a guide to increasing proportion of patients with increasing depth of the blue shading. ADEM, acute-disseminated encephalomyelitis; ANE, acute necrotizing encephalopathy; BGE, autoimmune basal ganglia encephalitis; BPAN, beta-propeller protein-associated degeneration; CP, cerebral palsy; GA1, glutaric aciduria type 1; GM, grey matter; GP, globus pallidus; MEGDEL, 3-methylglutaconic aciduria with sensori-neural deafness, encephalopathy, and Leigh-like syndrome; MMA, methyl malonic acidaemia; MPAN, mitochondrial membrane protein-associated neurodegeneration; PDHC, pyruvate dehydrogenase complex deficiency; PKAN, panthothenate kinase-associated degeneration; PLAN, PLA2G6-associated neurodegeneration; SSADH, succinic semialdehyde dehydrogenase deficiency.
Figure 3
Figure 3
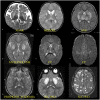
Cluster 1. T2W (A–H) and diffusion (I) axial MRI images from patients in Cluster 1, all of whom had putaminal T2W hyperintensities. (A) MRI of a 9-month-old boy with bi-allelic ADAR mutations showing bilateral T2W hyperintensities in the putamina along with bilateral fronto-temporal atrophy; (B) MRI of an 18-month-old girl with MEGDEL associated with bi-allelic SERAC1 mutations showing bilateral T2W hyperintensities with regions of sparing in the posterior third of both putamina; (C) MRI of a 3-year-old boy with sporadic ANE showing patchy T2W hyperintensities in bilateral putamina and thalami, thalamic swelling and a rim of T2W hyperintensity in the external capsule and claustrum around both putamina; (D) MRI of a 16-year-old girl with myelinolysis showing T2W hyperintensities in bilateral posterior putamina along with a rim of brighter T2W hyperintensities along the internal and external capsules around the putamina; (E) MRI of a 6-year-old boy with dystonic CP after HIE at birth (40 weeks of gestation) showing T2W hyperintensities in posterior putamina and ventrolateral thalami; (F) MRI of the same 6-year-old boy as in ‘E’ with dystonic CP showing T2W hyperintensities in the cortical grey matter in bilateral rolandic regions and parasagittal regions as well as surrounding white matter; (G) MRI of a 4-year-old girl with propionic acidaemia showing T2W hyperintensities in bilateral caudate nuclei and anterior putamina along with linear T2W hyperintensities in the internal medullary lamina of bilateral thalami; (H) MRI of a 3-year-old boy with thiamine responsive basal ganglia disease associated with bi-allelic SLC19A3 mutations at presentation showing bilateral putaminal swelling and T2W hyperintensity; (I) MRI of a 2-year-old girl with thiamine responsive basal ganglia disease associated with bi-allelic SLC19A3 mutations at presentation showing bilateral, extensive multifocal regions of cortical grey matter diffusion restriction.
Figure 4
Figure 4
Cluster 2. Patterns of MRI changes seen with T2W hyperintensities or increased susceptibility in the GP in patients in Cluster 2. (A) MRI of a 6-year-old boy with a TUBB4A mutation showing hypomyelination of the white matter along with T2W hypointensities in bilateral globi pallidi and relatively hypointense appearing thalami due to surrounding hypomyelinated white matter; (B) MRI of a 3-year-old girl with succinic semialdehyde dehydrogenase deficiency (SSADH) showing T2W hyperintensities in bilateral anterior globus pallidi; (C) MRI of a 5-year-old boy with methylmalonic acidaemia (MMA) showing T2W hyperintensities in bilateral globus pallidi; (D) MRI of a 4-year-old girl with PDHC showing T2W hyperintensities in bilateral globus pallidi, adjacent posterior tips of both putamina and dorsomedial nuclei of the thalamus; (E) MRI of a 1.5-year-old boy with kernicterus showing T2W hyperintensities in bilateral globi pallidi; (F) MRI of a 7-year-old boy with PKAN showing T2W hypointensities in bilateral globus pallidi, with persisting anterior T2W hyperintensities (‘eye of the tiger’); (G) MRI image of a 6-year-old girl with MPAN showing T2W hypointensities in bilateral globus pallidi and sparing of bilateral internal medullary lamina; (H) Susceptibility-weighted MRI image of a 2-year-old girl with fucosidosis showing increased susceptibility in bilateral globi pallidi with sparing of the internal medullary and accessory lamina with the pallidi; (I) Earlier MRI of the same patient with PKAN as in ‘F’ at the age of 3 years showing T2W hyperintensities in bilateral anterior globus pallidi.
Figure 5
Figure 5
Clusters 3 and 4. Patterns of MRI changes in patients in Clusters 3 and 4 (A) Diffusion-weighted MRI of a 9-month-old boy with vigabatrin toxicity areas that were diffusion restricted—bilateral globus pallidi and ventral diencephalic regions including the hypothalamus; (B) Diffusion-weighted MRI of a the same patient as in ‘A’ with vigabatrin toxicity showing hyperintensity of the central tegmental tracts in the dorsal pons and in the dentate nuclei; (C) MRI of the same patient as in ‘A’ with vigabatrin toxicity showing T2 hyperintensities in the midbrain; (D) MRI of a 8-month-old girl with Krabbe disease showing expansion of the optic tract; (E) MRI of a 4-year-old boy with hypermanganesemia associated with SLC30A10 showing T1W hyperintensity in a linear pattern from the GP, STN, pons to the cerebellar white matter as well as T1W hyperintensity in the anterior pituitary (F) MRI of the same patient as in ‘E’ showing diffuse T1W hyperintensities in bilateral putamen and GP as well as diffuse but less intense T1W signal change diffusely in the white matter; (G) MRI of the same patient as in ‘E’ showing T1W hyperintensity in the dentate nuclei and deep cerebellar grey matter; (H) MRI of an 11-year-old girl with hypermanganesemia associated with SLC39A14 showing T1W hyperintensities in bilateral globi pallidi as well as diffuse but less intense T1W signal change diffusely in the white matter; (I) MRI of the same patient as in ‘H’ at 18 years of age showing diffuse T1W hyperintensities in bilateral caudate, putamen and GP and a rim of hyperintensity around the STN as well as diffuse T1W hyperintensity diffusely in the white matter.
Figure 6
Figure 6
Branching algorithm to approach bilateral basal ganglia abnormalities on MRI. The algorithm is based on cluster analysis of MRI features from 34 diagnostic categories included in this study and review of literature of a further 59 diagnostic categories. End-points of the algorithm denoted by alphabets correspond to rows in Table 2 and to sections in discussion as noted. SN, substantia nigra. *Either striatal or GP abnormalities only amongst the basal ganglia nuclei. Other brain regions could be abnormal.

References

    1. Anderson JC, Costantino MM, Stratford T. Basal ganglia: anatomy, pathology, and imaging characteristics. Curr Probl Diagn Radiol 2004; 33: 28–41. - PubMed
    1. Appenzeller S, Schirmacher A, Halfter H, Baumer S, Pendziwiat M, Timmerman V, et al. Autosomal-dominant striatal degeneration is caused by a mutation in the phosphodiesterase 8B gene. Am J Hum Genet 2010; 86: 83–7. - PMC - PubMed
    1. Autti T, Joensuu R, Aberg L. Decreased T2 signal in the thalami may be a sign of lysosomal storage disease. Neuroradiology 2007; 49: 571–8. - PubMed
    1. Barkovich AJ. MR of the normal neonatal brain: assessment of deep structures. AJNR Am J Neuroradiol 1998; 19: 1397–403. - PMC - PubMed
    1. Basel-Vanagaite L, Muncher L, Straussberg R, Pasmanik-Chor M, Yahav M, Rainshtein L, et al. Mutated nup62 causes autosomal recessive infantile bilateral striatal necrosis. Ann Neurol 2006; 60: 214–22. - PubMed

LinkOut - more resources