. 2021 Mar 21;12(6):2442-2456.
doi: 10.1039/d0fo03457f. Epub 2021 Feb 25.

Blueberry polyphenols alter gut microbiota & phenolic metabolism in rats

Affiliations

Blueberry polyphenols alter gut microbiota & phenolic metabolism in rats

Dennis P Cladis et al. Food Funct. .

Abstract

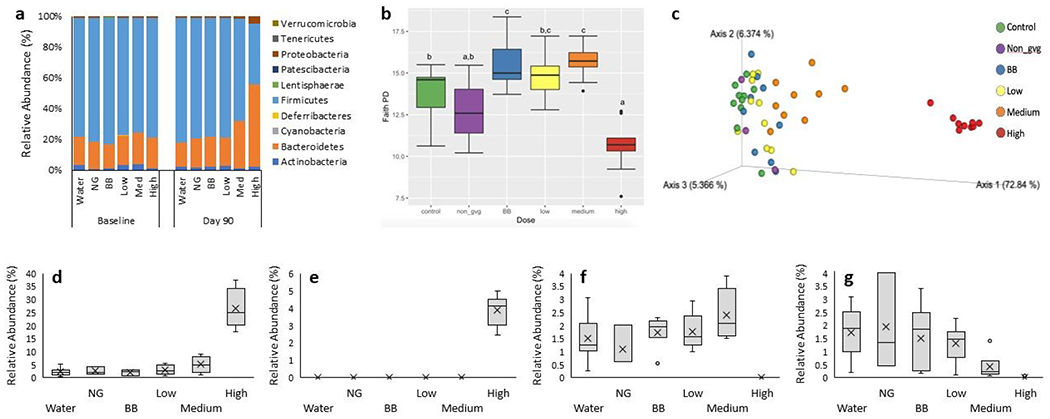
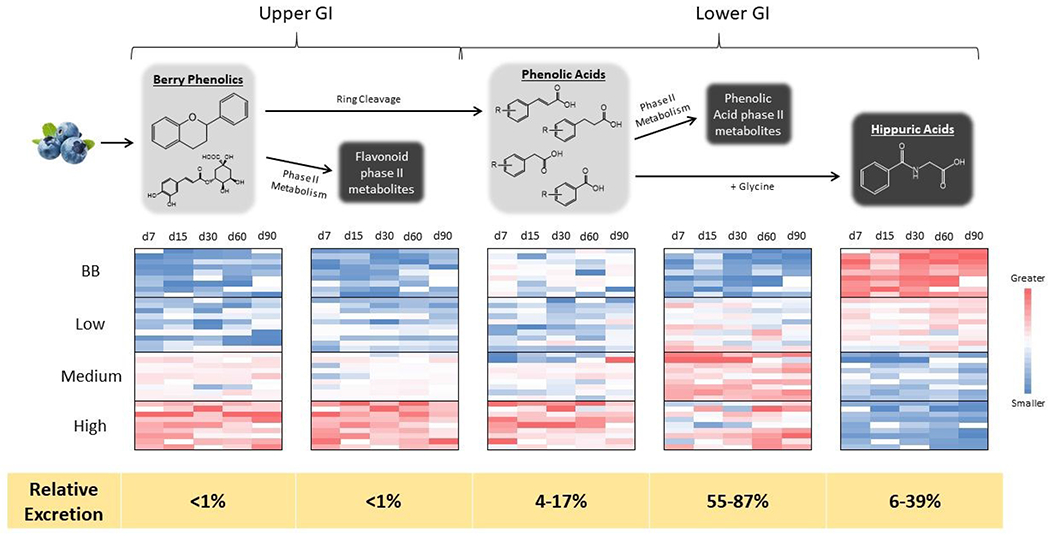
Consuming polyphenol-rich fruits and vegetables, including blueberries, is associated with beneficial health outcomes. Interest in enhancing polyphenol intakes via dietary supplements has grown, though differences in fruit versus supplement matrix on gut microbiota and ultimate phenolic metabolism to bioactive metabolites are unknown. To evaluate this, 5-month-old, ovariectomized, Sprague-Dawley rats were gavaged for 90 d with a purified extract of blueberry polyphenols (0, 50, 250, or 1000 mg total polyphenols per kg bw per d) or lyophilized blueberries (50 mg total polyphenols per kg bw per d, equivalent to 150 g fresh blueberries per day in humans). Urine, feces, and tissues were assessed for gut microbiota and phenolic metabolism. Significant dose- and food matrix-dependent effects were observed at all endpoints measured. Gut microbial populations showed increased diversity at moderate doses but decreased diversity at high doses. Urinary phenolic metabolites were primarily observed as microbially derived metabolites and underwent extensive host xenobiotic phase II metabolism. Thus, blueberry polyphenols in fruit and supplements induce differences in gut microbial communities and phenolic metabolism, which may alter intended health effects.


Conflict of interest statement

CONFLICT OF INTEREST

There are no conflicts to declare.

Figures

Figure 1 –
Figure 1 –
Characterization of gut microbiota, a) Relative abundances of phyla in gut microbiota of rats at baseline and end of study. b) Faith’s PD illustrating alpha diversity at end of study; lowercase letters indicate significant differences between groups (q < 0.05). c) PCoA plot from weighted Unifrac analysis, illustrating beta diversity for all samples at end of study. d-g) Relative abundances of a few representative differentially abundant taxa identified by LEfSe at end of study. d) B. dorei and e) Lachnoclostridium exhibited dominance in the high dose group, while f) Rickenellaceae RC9 gut group was most abundant in the medium dose group and g) Eubacterium coprostanoligenes group decreased in relative abundance as the phenolic dose increased.
Figure 2 –
Figure 2 –
Urinary excretion kinetics of total and selected individual phenolic metabolites, illustrating metabolite excretion patterns over 90d (see text for details). a) Total phenolic excretion, b) 3-hydroxyphenyl propionic acid, c) quercetin, d) delphinidin glucuronide, and e) 3-hydroxy-4-methoxyphenylpropionic acid. Data shown as mean ± SEM. Statistical analysis for total phenolic excretion is given in Table 2, while graphs of all quantified individual phenolic metabolites and their statistical comparisons are given in the Supporting Information (Figures SI1–SI3).
Figure 3 –
Figure 3 –
Metabolic flux of phenolic metabolites. The top half of the figure illustrates a simplified schema of phenolic metabolism throughout the GI tract. The five boxes represent the five different metabolite pools produced (light grey boxes indicate metabolites produced within the GI tract, while dark grey boxes indicate host xenobiotic metabolites). The heat maps compare the relative differences between treatments for each metabolite pool. These plots were generated from the percent contribution of each metabolite pool to the total phenolic excretion, enabling meaningful comparisons between treatments. Finally, as illustrated by the yellow bar at the bottom of the figure, regardless of treatment, metabolites derived from lower intestinal metabolism, and specifically host xenobiotic metabolism of gut microbial metabolites, accounted for a large majority of the metabolites observed.

References

    1. Hussain T, Tan B, Yin YL, Blachier F, Tossou MCB and Rahu N, Oxidative stress and inflammation: what polyphenols can do for us?, Oxid. Med. Cell. Longev, 2016, 2016, 7432797. - PMC - PubMed
    1. Navaei N, Pourafshar S, Akhavan NS, Litwin NS, Foley EM, George KS, et al. , Influence of daily fresh pear consumption on biomarkers of cardiometabolic health in middle-aged/older adults with metabolic syndrome: a randomized controlled trial, Food Funct., 2019, 10, 1062–1072. - PubMed
    1. Spencer JPE, The impact of fruit flavonoids on memory and cognition, Brit. J. Nutr, 2010, 104, S40–S47. - PubMed
    1. Del Rio D, Rodriguez-Mateos A, Spencer JPE, Tognolini M, Borges G and Crozier A, Dietary (poly)phenolics in human health: structures, bioavailability, and evidence of protective effects against chronic diseases, Antioxid. Redox Signal, 2013, 18, 1818–1892. - PMC - PubMed
    1. Boeing H, Bechthold A, Bub A, Ellinger S, Haller D, Kroke A, et al. Critical review: vegetables and fruit in the prevention of chronic diseases, Eur. J. Nutr, 2012, 51, 637–663. - PMC - PubMed

LinkOut - more resources