Parkinson's Disease-Associated LRRK2 Interferes with Astrocyte-Mediated Alpha-Synuclein Clearance
- PMID: 33629273
- PMCID: PMC8257537
- DOI: 10.1007/s12035-021-02327-8
Parkinson's Disease-Associated LRRK2 Interferes with Astrocyte-Mediated Alpha-Synuclein Clearance
Abstract
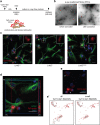
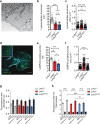
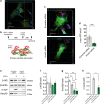
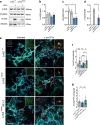
Parkinson's disease (PD) is a neurodegenerative, progressive disease without a cure. To prevent PD onset or at least limit neurodegeneration, a better understanding of the underlying cellular and molecular disease mechanisms is crucial. Mutations in the leucine-rich repeat kinase 2 (LRRK2) gene represent one of the most common causes of familial PD. In addition, LRRK2 variants are risk factors for sporadic PD, making LRRK2 an attractive therapeutic target. Mutations in LRRK2 have been linked to impaired alpha-synuclein (α-syn) degradation in neurons. However, in which way pathogenic LRRK2 affects α-syn clearance by astrocytes, the major glial cell type of the brain, remains unclear. The impact of astrocytes on PD progression has received more attention and recent data indicate that astrocytes play a key role in α-syn-mediated pathology. In the present study, we aimed to compare the capacity of wild-type astrocytes and astrocytes carrying the PD-linked G2019S mutation in Lrrk2 to ingest and degrade fibrillary α-syn. For this purpose, we used two different astrocyte culture systems that were exposed to sonicated α-syn for 24 h and analyzed directly after the α-syn pulse or 6 days later. To elucidate the impact of LRRK2 on α-syn clearance, we performed various analyses, including complementary imaging, transmission electron microscopy, and proteomic approaches. Our results show that astrocytes carrying the G2019S mutation in Lrrk2 exhibit a decreased capacity to internalize and degrade fibrillar α-syn via the endo-lysosomal pathway. In addition, we demonstrate that the reduction of α-syn internalization in the Lrrk2 G2019S astrocytes is linked to annexin A2 (AnxA2) loss of function. Together, our findings reveal that astrocytic LRRK2 contributes to the clearance of extracellular α-syn aggregates through an AnxA2-dependent mechanism.
Keywords: Astrocytes; Glia; LRRK2; Neurodegeneration; Parkinson’s disease; α-Synuclein.
Conflict of interest statement
The authors declare that they have no competing interests.
Figures


Similar articles
-
Astrocytes carrying LRRK2 G2019S exhibit increased levels of clusterin chaperone via miR-22-5p and reduced ability to take up α-synuclein fibrils.Acta Neuropathol Commun. 2025 May 12;13(1):98. doi: 10.1186/s40478-025-02015-x. Acta Neuropathol Commun. 2025. PMID: 40355981 Free PMC article.
-
LRRK2 modifies α-syn pathology and spread in mouse models and human neurons.Acta Neuropathol. 2019 Jun;137(6):961-980. doi: 10.1007/s00401-019-01995-0. Epub 2019 Mar 29. Acta Neuropathol. 2019. PMID: 30927072 Free PMC article.
-
Viral mediated α-synuclein overexpression results in greater transgene levels and α-synuclein overload in mice bearing kinase dead mutation of LRRK2.Sci Rep. 2025 Mar 22;15(1):9992. doi: 10.1038/s41598-025-94165-0. Sci Rep. 2025. PMID: 40121347 Free PMC article.
-
The role of posttranslational modifications of α-synuclein and LRRK2 in Parkinson's disease: Potential contributions of environmental factors.Biochim Biophys Acta Mol Basis Dis. 2019 Aug 1;1865(8):1992-2000. doi: 10.1016/j.bbadis.2018.11.017. Epub 2018 Nov 24. Biochim Biophys Acta Mol Basis Dis. 2019. PMID: 30481588 Free PMC article. Review.
-
Interaction of LRRK2 and α-Synuclein in Parkinson's Disease.Adv Neurobiol. 2017;14:209-226. doi: 10.1007/978-3-319-49969-7_11. Adv Neurobiol. 2017. PMID: 28353286 Review.
Cited by
-
Sex and Brain: The Role of Sex Chromosomes and Hormones in Brain Development and Parkinson's Disease.Cells. 2023 May 27;12(11):1486. doi: 10.3390/cells12111486. Cells. 2023. PMID: 37296608 Free PMC article. Review.
-
Cell biology of Parkinson's disease: Mechanisms of synaptic, lysosomal, and mitochondrial dysfunction.Curr Opin Neurobiol. 2024 Apr;85:102841. doi: 10.1016/j.conb.2024.102841. Epub 2024 Feb 1. Curr Opin Neurobiol. 2024. PMID: 38306948 Free PMC article. Review.
-
Astrocyte contribution to dysfunction, risk and progression in neurodegenerative disorders.Nat Rev Neurosci. 2023 Jan;24(1):23-39. doi: 10.1038/s41583-022-00641-1. Epub 2022 Oct 31. Nat Rev Neurosci. 2023. PMID: 36316501 Free PMC article. Review.
-
Disruption of lysosomal proteolysis in astrocytes facilitates midbrain organoid proteostasis failure in an early-onset Parkinson's disease model.Nat Commun. 2024 Jan 10;15(1):447. doi: 10.1038/s41467-024-44732-2. Nat Commun. 2024. PMID: 38200091 Free PMC article.
-
Cellular and subcellular localization of Rab10 and phospho-T73 Rab10 in the mouse and human brain.Acta Neuropathol Commun. 2023 Dec 18;11(1):201. doi: 10.1186/s40478-023-01704-9. Acta Neuropathol Commun. 2023. PMID: 38110990 Free PMC article.
References
-
- Jankovic J. Parkinson’s disease: clinical features and diagnosis. J Neurol Neurosurg Psychiatry. 2008;79:368–376. - PubMed
-
- Spillantini MG, Schmidt ML, Lee VM, Trojanowski JQ, Jakes R, Goedert M. Alpha-synuclein in Lewy bodies. Nature. 1997;388:839–840. - PubMed
-
- Tu PH, Galvin JE, Baba M, Giasson B, Tomita T, Leight S, Nakajo S, Iwatsubo T, Trojanowski JQ, Lee VM. Glial cytoplasmic inclusions in white matter oligodendrocytes of multiple system atrophy brains contain insoluble alpha-synuclein. Ann Neurol. 1998;44:415–422. - PubMed
-
- Wakabayashi K, Hayashi S, Yoshimoto M, Kudo H, Takahashi H. NACP/alpha-synuclein-positive filamentous inclusions in astrocytes and oligodendrocytes of Parkinson’s disease brains. Acta Neuropathol. 2000;99:14–20. - PubMed
-
- Terada S, Ishizu H, Yokota O, Tsuchiya K, Nakashima H, Ishihara T, Fujita D, Ueda K, Ikeda K, Kuroda S. Glial involvement in diffuse Lewy body disease. Acta Neuropathol. 2003;105:163–169. - PubMed
MeSH terms
Substances
LinkOut - more resources
Full Text Sources
Other Literature Sources
Medical
Research Materials
Miscellaneous

