Membrane potential regulates Hedgehog signalling in the Drosophila wing imaginal disc
- PMID: 33629503
- PMCID: PMC8024891
- DOI: 10.15252/embr.202051861
Membrane potential regulates Hedgehog signalling in the Drosophila wing imaginal disc
Abstract
While the membrane potential of cells has been shown to be patterned in some tissues, specific roles for membrane potential in regulating signalling pathways that function during development are still being established. In the Drosophila wing imaginal disc, Hedgehog (Hh) from posterior cells activates a signalling pathway in anterior cells near the boundary which is necessary for boundary maintenance. Here, we show that membrane potential is patterned in the wing disc. Anterior cells near the boundary, where Hh signalling is most active, are more depolarized than posterior cells across the boundary. Elevated expression of the ENaC channel Ripped Pocket (Rpk), observed in these anterior cells, requires Hh. Antagonizing Rpk reduces depolarization and Hh signal transduction. Using genetic and optogenetic manipulations, in both the wing disc and the salivary gland, we show that membrane depolarization promotes membrane localization of Smoothened and augments Hh signalling, independently of Patched. Thus, membrane depolarization and Hh-dependent signalling mutually reinforce each other in cells immediately anterior to the compartment boundary.
Keywords: Drosophila; Hedgehog; membrane potential; signaling.
© 2021 The Authors. Published under the terms of the CC BY 4.0 license.
Conflict of interest statement
The authors declare that they have no conflicts of interest.
Figures
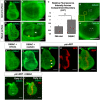
- A, B
Live third‐instar discs incubated in DiBAC. DiBAC fluorescence is observed in the wing imaginal disc in both apical (A–A′) and basal (B–B′) optical sections. Increased fluorescence is observed in the centre of the pouch (white arrow, B′) and at the dorsoventral (D‐V) compartment boundary in the anterior compartment (yellow arrow, (B′), and inset, (D)).
- C–E
Comparison of DiBAC with the voltage‐insensitive dye FM4‐64. Incubation of live discs in FM4‐64 (E) shows more uniform fluorescence when compared to DiBAC (D). Quantitative comparison of fluorescence in the two white boxes in each panel is shown in (C). N = 7 discs for each treatment, data compared using an unpaired t‐test, ** indicates P < 0.001, error bars are standard deviations. The region boxed in yellow in (D) is shown at higher magnification to show DiBAC fluorescence at the D‐V compartment boundary.
- F, G
Incubation in ouabain results in brighter and more uniform DiBAC fluorescence.
- H–H″
Live wing discs expressing UAS‐RFP anterior to the compartment boundary, under the control of ptc‐Gal4, were incubated in DiBAC, showing that the stripe of increased DiBAC fluorescence coincides with the posterior edge of ptc expression. White arrowhead in (H) indicates the stripe in the wing pouch; yellow arrowheads indicate the stripe in the dorsal and ventral hinge.
- I, I′
Early L3 discs incubated in DiBAC. Patterned depolarization is evident throughout the third larval instar, with the stripe of increased fluorescence becoming narrower in more mature discs with developmental time (Compare I with A, bracket in I indicates width of increased DiBAC fluorescence).
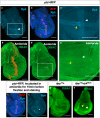
- A–A″
Expression of Rpk is increased anterior to the A‐P compartment boundary and in two rows of cells flanking the D‐V compartment boundary in the A compartment.
- B–B″
Blockade of DEG/ENaC channels by incubation in amiloride abolishes the stripe of increased DiBAC fluorescence along the A‐P compartment boundary (white arrowhead). White boxes indicate regions used to calculate the average DiBAC fluorescence intensity ratio across the compartment boundary = 0.98, standard deviation = 0.05, n = 5 discs. Increased fluorescence at the D‐V boundary in the A compartment is still observable (yellow arrowhead). The same vehicle was used as in experiments with ouabain, and the control is in Fig 1F.
- C, C′
Amiloride incubation does not diminish Rpk expression. White arrowhead indicates approximate position of the A‐P compartment boundary, yellow arrowhead indicates approximate position of the D‐V compartment boundary.
- D, E
Expression of rpk‐RNAi using dpp‐Gal4 results in diminished DiBAC fluorescence along the A‐P compartment boundary (white arrowhead), while increased fluorescence at the D‐V boundary in the A compartment is still observable (yellow arrowhead).
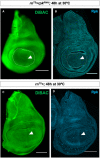
- A
Expression of rpk‐RNAi in the wing pouch decreases patterned DiBAC staining (white arrowhead).
- B
Expression of rpk‐RNAi in the wing pouch decreases anti‐Rpk staining anterior to the A‐P compartment boundary (white arrowhead).
- C, D
Control discs. Increased DiBAC staining and anti‐Rpk staining are visible in the centre of the wing pouch (white arrowheads).
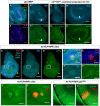
- A–A‴
Immunostaining of discs expressing ptc>RFP with antibodies to Rpk and ATPα showing elevated levels of both proteins anterior to the compartment boundary. White arrowheads indicate approximate position of the A‐P compartment boundary.
- B–C′
L3 discs that are temperature‐sensitive for hh following shift to the restrictive temperature for 12 h show loss of increased expression of Rpk (B, B′) and ATPα (C, C′) anterior to the compartment boundary. Controls shown in Fig EV2. White arrowheads indicate approximate position of the A‐P compartment boundary.
- D–E‴
Clones of cells expressing an activated form of the transcription factor Ci show elevated Rpk and ATPα expression in the anterior compartment (white box) as well as the posterior compartment (yellow arrowhead). (E–E‴) A single clone in the A compartment is shown at higher magnification.
- F–F′
A clone of cells in the anterior compartment expressing ci3M following incubation in DiBAC.
- G–G′
A clone of cells in the anterior compartment expressing ptc‐RNAi following incubation in DiBAC. The clones also express RFP.

- A–A″
Immunostaining of discs heterozygous for the hhAC allele and upshifted to 30°C for 12 h with antibodies to Rpk and ATPα showing elevated levels of both proteins anterior to the A‐P compartment boundary. All scale bars are 100 µm.
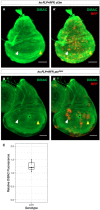
- A–A′
Clones of cells expressing ci3m accumulate more DiBAC relative to surrounding tissue in both the anterior (white arrow) and posterior (yellow arrow) compartments.
- B–B′
Clones of cells expressing ptc‐RNAi accumulate more DiBAC relative to surrounding tissue in the anterior compartment (white arrow), but not the posterior compartment (yellow arrow).
- C
The ratio of DiBAC fluorescence in ci3m‐expressing clones to equally‐sized regions of tissue not expressing ci3m. N = 10 clones from three imaginal discs. Individual data points are shown, as well as a box plot showing descriptive statistics. Bounds of the box show lower and upper quartiles, bar within the box shows the median of the data, and whiskers show minimum and maximum bounds of data.
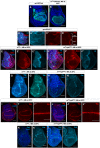
- A, B
Expression patterns of ap‐Gal4 (A) and rn‐Gal4 (B).
- C, D
Immunostaining of Smo protein (red), full‐length Ci (light blue) (C–C″) and Ptc protein (D) in discs expressing ATPαRNAi in the dorsal compartment. Brackets indicate tissue expressing RNAi and control tissue.
- E–F″
Immunostaining of Smo protein (red) and full‐length Ci (light blue) in (E–E″) control discs and (F–F″) discs expressing rpkRNAi for 48 h before dissection.
- G–H′
Immunostaining of Ptc protein in (G, G′) control discs and (H, H′) discs expressing rpkRNAi for 48 h before dissection.
- I–J″
Immunostaining for Wg protein in (I–I″) control discs and (J–J″) discs expressing rpkRNAi for 48 h before dissection.
- K–L′
Immunostaining for Cut protein in (K, K′) control discs and (L, L′), discs expressing rpkRNAi for 48 h before dissection.

- A–A‴
Immunostaining of Smo protein (red) and full‐length Ci (light blue) in discs expressing en‐Venus. Smo is expressed at higher levels in the P compartment and in a stripe 5–10 cells wide just anterior to the A‐P compartment boundary. White arrowhead indicates cells just anterior to the A‐P compartment boundary.
- B, C
Effect of expressing an RNAi against the ENaC channel rpk in the dorsal compartment of the disc using ap‐Gal4. Knockdown of Rpk in the dorsal compartment results in decreased accumulation of the Hh signal transducer Smo (B, B′) and the activator form of Ci (B, B″). The expression of ptc, visualized using an anti‐Ptc antibody (C), a downstream target gene of Hh signalling, is also diminished. The rpk‐RNAi line BL:39053 is used in all panels shown, but the phenotype was validated with a second RNAi line (BL:25847).
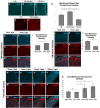
- A–Q
Manipulation of Vmem in salivary glands dissected from third‐instar larvae. (A–C) Localization of Smo protein (blue) following expression of 71B‐Gal4 (A), 71B‐Gal4 and UAS‐NaChBac (B) or 71B‐Gal4 and UAS‐Kir2.1 (C). Expression of the sodium channel NaChBac increases membrane localization of Smo while expression of the potassium channel Kir2.1 reduces membrane localization and increases cytosolic Smo (B, C). (D) Quantification of the ratio of membrane Smo fluorescence to cytosol fluorescence. N = 7 salivary glands per genotype. Data were compared using ANOVA followed by Tukey′s test for significance (** indicates P < 0.01, *** indicates P < 0.001), error bars are standard deviations. (E, F) Expression of the Hh target gene ptc is visualized using anti‐Ptc immunostaining. Compared to 71B‐Gal4 (E), Ptc expression is increased in glands expressing 71B‐Gal4 and UAS‐NaChBac (F). (G‐I) Effect of expression and activation of the depolarizing channelrhodopsin ChR2 on Smo protein membrane abundance. After dissection, glands were kept in either dark conditions (G) or exposed to 15 min of blue light (H). (I) Quantification of membrane fluorescence; N = 13 glands, data compared using an unpaired t‐test (** indicates P < 0.01), error bars are standard deviations. (J–L) Effect of expression and activation of the Cl−‐selective channelrhodopsin ChloC. An overall reduction in Smo immunostaining was observed following channel activation (K), as compared to control glands kept in the dark (J). (L) Quantification of membrane fluorescence; N = 10 glands, data were compared using an unpaired t‐test (*** indicates P < 0.001), error bars are standard deviations. (M–Q) Time course of change in Smo localization. Salivary glands expressing the channelrhodopsin ChR2 were subjected to increasing intervals of activating light, then fixed and stained for Smo protein (M–P″). (Q) Quantification of membrane‐associated fluorescence; N = 7 glands/timepoint, data were compared using ANOVA followed by Tukey′s test for significance (** indicates P < 0.01), error bars are standard deviations. Scale bars are 50 µm, except for (A–C), where scale bars are 25 µm.
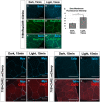
- A–G′
Salivary glands expressing the channelrhodopsin ReaChR were subjected to 15 min in activating light, then fixed and stained for Smo protein (A–C). N = 9 glands, data were compared using an unpaired t‐test (***P < 0.001), error bars are standard deviations. Membrane abundance of the beta integrin subunit Mys and the integrin‐associated protein Talin are not altered upon ChR2 activation (D–G′). Scale bars are 50 µm in all panels.

- A–B″
Wing discs expressing the channelrhodopsin ChR2 were subjected to 0 min or 25 min of activating light in culture, then fixed and stained for Smo protein. In (B″), the yellow arrowhead indicates dorsoventral compartment boundary, and the white arrowhead indicates anteroposterior compartment boundary.
- C
Quantification of the ratio of mean Smo fluorescence intensity in 25 µm2 regions in the dorsal anterior compartment compared to the ventral posterior compartment. N = 5 for 0 min discs, n = 9 for 25 min discs, data were compared using an unpaired t‐test (***P < 0.001), error bars are standard deviations. Identical analyses were carried out comparing dorsal posterior fluorescence to ventral posterior fluorescence (P = 0.132), dorsal posterior fluorescence to dorsal anterior fluorescence (P = 0.12) and ventral posterior fluorescence to ventral anterior fluorescence (P = 0.36).
- D–E′
Discs expressing the red light‐activated channelrhodopsin ReaChR under control of ap‐Gal4 were raised on a 12‐h light/dark cycle, dissected and stained for Smo protein (D, D′) or Ptc protein (E, E′).

Similar articles
-
Hedgehog produced by the Drosophila wing imaginal disc induces distinct responses in three target tissues.Development. 2020 Nov 17;147(22):dev195974. doi: 10.1242/dev.195974. Development. 2020. PMID: 33028613 Free PMC article.
-
Logical modelling of the role of the Hh pathway in the patterning of the Drosophila wing disc.Bioinformatics. 2008 Aug 15;24(16):i234-40. doi: 10.1093/bioinformatics/btn266. Bioinformatics. 2008. PMID: 18689831
-
Hedgehog mediated degradation of Ihog adhesion proteins modulates cell segregation in Drosophila wing imaginal discs.Nat Commun. 2017 Nov 2;8(1):1275. doi: 10.1038/s41467-017-01364-z. Nat Commun. 2017. PMID: 29097673 Free PMC article.
-
Wing tips: The wing disc as a platform for studying Hedgehog signaling.Methods. 2014 Jun 15;68(1):199-206. doi: 10.1016/j.ymeth.2014.02.002. Epub 2014 Feb 17. Methods. 2014. PMID: 24556557 Review.
-
Establishing compartment boundaries in Drosophila wing imaginal discs: An interplay between selector genes, signaling pathways and cell mechanics.Semin Cell Dev Biol. 2020 Nov;107:161-169. doi: 10.1016/j.semcdb.2020.07.008. Epub 2020 Jul 27. Semin Cell Dev Biol. 2020. PMID: 32732129 Review.
Cited by
-
Ion Channels in Epithelial Dynamics and Morphogenesis.Cells. 2021 Sep 1;10(9):2280. doi: 10.3390/cells10092280. Cells. 2021. PMID: 34571929 Free PMC article. Review.
-
Mechanisms Underlying Influence of Bioelectricity in Development.Front Cell Dev Biol. 2022 Feb 14;10:772230. doi: 10.3389/fcell.2022.772230. eCollection 2022. Front Cell Dev Biol. 2022. PMID: 35237593 Free PMC article. Review.
-
Bioelectric regulation of intestinal stem cells.Trends Cell Biol. 2023 Jul;33(7):555-567. doi: 10.1016/j.tcb.2022.10.003. Epub 2022 Nov 15. Trends Cell Biol. 2023. PMID: 36396487 Free PMC article. Review.
-
Bioelectricity in Developmental Patterning and Size Control: Evidence and Genetically Encoded Tools in the Zebrafish Model.Cells. 2023 Apr 13;12(8):1148. doi: 10.3390/cells12081148. Cells. 2023. PMID: 37190057 Free PMC article. Review.
-
Bioelectricity is a universal multifaced signaling cue in living organisms.Mol Biol Cell. 2025 Feb 1;36(2):pe2. doi: 10.1091/mbc.E23-08-0312. Mol Biol Cell. 2025. PMID: 39873662 Free PMC article. Review.
References
-
- Alexandre C, Jacinto A, Ingham PW (1996) Transcriptional activation of hedgehog target genes in Drosophila is mediated directly by the cubitus interruptus protein, a member of the GLI family of zinc finger DNA‐binding proteins. Genes Dev 10: 2003–2013 - PubMed
-
- Aza‐Blanc P, Ramírez‐Weber FA, Laget MP, Schwartz C, Kornberg TB (1997) Proteolysis that is inhibited by hedgehog targets Cubitus interruptus protein to the nucleus and converts it to a repressor. Cell 89: 1043–1053 - PubMed
Publication types
MeSH terms
Substances
Grants and funding
LinkOut - more resources
Full Text Sources
Other Literature Sources
Molecular Biology Databases

