. 2021 Jul;19(4):376-393.
doi: 10.1111/gbi.12437. Epub 2021 Feb 25.

Microbial succession and dynamics in meromictic Mono Lake, California

Affiliations

Microbial succession and dynamics in meromictic Mono Lake, California

Alexandra A Phillips et al. Geobiology. 2021 Jul.

Abstract

Mono Lake is a closed-basin, hypersaline, alkaline lake located in Eastern Sierra Nevada, California, that is dominated by microbial life. This unique ecosystem offers a natural laboratory for probing microbial community responses to environmental change. In 2017, a heavy snowpack and subsequent runoff led Mono Lake to transition from annually mixed (monomictic) to indefinitely stratified (meromictic). We followed microbial succession during this limnological shift, establishing a two-year (2017-2018) water-column time series of geochemical and microbiological data. Following meromictic conditions, anoxia persisted below the chemocline and reduced compounds such as sulfide and ammonium increased in concentration from near 0 to ~400 and ~150 µM, respectively, throughout 2018. We observed significant microbial succession, with trends varying by water depth. In the epilimnion (above the chemocline), aerobic heterotrophs were displaced by phototrophic genera when a large bloom of cyanobacteria appeared in fall 2018. Bacteria in the hypolimnion (below the chemocline) had a delayed, but systematic, response reflecting colonization by sediment "seed bank" communities. Phototrophic sulfide-oxidizing bacteria appeared first in summer 2017, followed by microbes associated with anaerobic fermentation in spring 2018, and eventually sulfate-reducing taxa by fall 2018. This slow shift indicated that multi-year meromixis was required to establish a sulfate-reducing community in Mono Lake, although sulfide oxidizers thrive throughout mixing regimes. The abundant green alga Picocystis remained the dominant primary producer during the meromixis event, abundant throughout the water column including in the hypolimnion despite the absence of light and prevalence of sulfide. Our study adds to the growing literature describing microbial resistance and resilience during lake mixing events related to climatic events and environmental change.

Keywords: environmental microbiology; geochemistry; limnology; microbial ecology; microbial succession.


Figures

FIGURE 1
FIGURE 1
Bathymetric map of Mono Lake after Bruce, Jellison, Imberger, & Melack (2008). Location is indicated on the California map insert with a blue star. All samples were collected from Station 6 in the south basin, marked with a white star. White areas on the map correspond to Paoha island (larger island) and Negit Island to the north
FIGURE 2
FIGURE 2
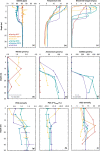
Vertical profiles of (a) salinity, (b) temperature, (c) dissolved oxygen, (d) nitrate, (e) ammonium, (f) sulfide, (g) particulate organic carbon (POC) (h), POC δ13CVPDB, and (i) dissolved organic carbon (DOC) concentrations at Station 6, Mono Lake, CA. Profiles were measured in spring 2017 (red circles), summer 2017 (orange inverted triangles), fall 2017 (yellow squares), spring 2018 (green triangles), summer 2018 (blue diamonds), and fall 2018 (purple pentagons)
FIGURE 3
FIGURE 3
Relative abundance of fatty acids (FAs) detected in Picocystis cultures and Mono Lake water‐column POC, analyzed as fatty acid methyl esters. For the purpose of comparison, FAs are grouped into five categories shared between Picocystis and POC extracts: C14–C20 saturated (dark blue), C16 and C18 monounsaturated (turquoise), C16, C18, and C20 polyunsaturated (green), C14, C16, and C18 β‐hydroxy (light green), and C16 and C17 branched (yellow). Categories of FAs unique to POC samples included C14, C16, and C18 monounsaturated (orange), C17 monounsaturated (red), and C15 branched (maroon)
FIGURE 4
FIGURE 4
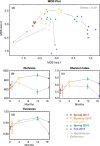
Visualizations of 16S rRNA gene amplicon data. Epilimnion (surface water) and hypolimnion (deep‐water) samples are indicated by open and closed symbols, respectively. Symbols and colors are the same as in Figure 2. Shallow and deep samples from spring 2017 are coded as epilimnion and hypolimnion, respectively, although the thermocline was only weakly developed at that time. Dashed arrows indicate the time trajectory of the epilimnion microbial community while solid arrows indicate the hypolimnion. (a) Multidimensional scaling (MDS) plot of all 32 samples across the two‐year time series, where distance across either axis represents degree of dissimilarity. (b) Richness (alpha diversity). (c) Shannon diversity index. (d) Species evenness. In panels b–d, values are averaged across all epilimnion or hypolimnion samples for each time point with bars representing standard deviations
FIGURE 5
FIGURE 5
Heatmap of 16S rRNA sequence relative abundance for genera >1.0% at Station 6. Sampling time points are ordered with increasing depth from left to right within each box, and with increasing time from left to right between boxes. Epilimnion and hypolimnion samples are indicated with gray and black rectangles below each column, respectively. Amplicon sequences are binned at the genus level, with phylogenetic classes shown in gray italics to the left of the corresponding genus, and phyla indicated on far left in bold
FIGURE 6
FIGURE 6
Relative abundances of bacterial 16S rRNA sequences, grouped by class or phylum, in the (a) epilimnion (b) and hypolimnion. Picocystis (dark blue) abundance was inferred from chloroplast sequences. Some phyla were not included, as their relative abundance was too low to be discernable in this visualization method. These groups included the following: Euryarchaeota, Actinobacteria, Deinococcus–Thermus, Planctomycetes, Spirochaetes, Verrucomicrobia, and Tenericutes
FIGURE 7
FIGURE 7
Measurements of water‐column sulfate reduction potential in incubation experiments. Samples were collected in spring 2018 from 12, 17, 20, and 35 m water depths. Each depth was monitored for sulfide production over the course of six months. Values are the average of replicates with vertical error bars displaying 1σ standard deviations. The 12 m sample was from the epilimnion, while other samples were collected from the hypolimnion and at time zero began with background sulfide concentrations in the lake (0.5 mM). 2 mM lactate addition (purple pentagons), 2 mM pyruvate (blue diamonds), no addition (yellow squares), and the autoclaved killed control (red circles)
FIGURE 8
FIGURE 8
Chlorophyll a abundance over time and depth in Mono Lake, CA. Data were redrawn from publicly available (http://www.monobasinresearch.org/onlinereports/) LADWP reports from 2016, 2017, 2018, and 2019. Chlorophyll a concentrations were measured by fluorometry after collection at 2, 8, 16, 20, 24, and 28 m water depth. Note that LADWP did not collect data in January of each year. The approximate transition from monomixis to meromixis is also indicated, but it should be noted that these regime shifts are gradual, not sudden

References

    1. Armstrong, F. A. J., Stearns, C. R., & Strickland, J. D. H. (1967). The measurement of upwelling and subsequent biological process by means of the Technicon AutoAnalyzer and associated equipment. Deep Sea and Oceanographic Abstracts, 14, 381–390. 10.1016/0011-7471(67)90082-4 - DOI
    1. Arvola, L., George, G., Livingstone, D. M., Järvinen, M., Blenckner, T., Dokulil, M. T., Jennings, E., Aonghusa, C. N., Noges, P., Noges, T., & Weyhenmeyer, G. A. (2010). The impact of the changing climate on the thermal characteristics of lakes. The impact of climate change on European lakes (1st ed., pp. 85–101). Springer.
    1. Benson, L. V., Lund, S. P., Burdett, J. W., Kashgarian, M., Rose, T. P., Smoot, J. P., & Schwartz, M. (1998). Correlation of late‐Pleistocene lake‐level oscillations in Mono Lake, California, with North Atlantic climate events. Quaternary Research, 49, 1–10. 10.1006/qres.1997.1940 - DOI
    1. Bernard, C., Escalas, A., Villeriot, N., Agogue, H., Hugoni, M., Duval, C., Carre, C., Got, P., Sarazin, G., Jezequel, D., Leboulanger, C., Grossi, V., Ader, M., & Troussellier, M. (2019). Very low phytoplankton diversity in a tropical saline‐alkaline lake, with co‐dominance of Arthrospira fusiformis (Cyanobacteria) and Picocystis salinarum (Chlorophyta). Microbial Ecology, 78, 603–617. 10.1007/s00248-019-01332-8 - DOI - PMC - PubMed
    1. Bernhardt, H., & Wilhelms, A. (1967). The continuous determination of low level iron, soluble phosphate and total phosphate with the AutoAnalyzer. Technicon Symposium, 1, 385–389.

Publication types

LinkOut - more resources