. 2021 Mar 26;6(3):1270-1278.
doi: 10.1021/acssensors.0c02561. Epub 2021 Feb 25.

Microfluidic Magneto Immunosensor for Rapid, High Sensitivity Measurements of SARS-CoV-2 Nucleocapsid Protein in Serum

Affiliations

Microfluidic Magneto Immunosensor for Rapid, High Sensitivity Measurements of SARS-CoV-2 Nucleocapsid Protein in Serum

Jiran Li et al. ACS Sens. .

Abstract

The COVID-19 pandemic has highlighted the importance and urgent need for rapid and accurate diagnostic tests for COVID-19 detection and screening. The objective of this work was to develop a simple immunosensor for rapid and high sensitivity measurements of SARS-CoV-2 nucleocapsid protein in serum. This assay is based on a unique sensing scheme utilizing dually-labeled magnetic nanobeads for immunomagnetic enrichment and signal amplification. This immunosensor is integrated onto a microfluidic chip, which offers the advantages of minimal sample and reagent consumption, simplified sample handling, and enhanced detection sensitivity. The functionality of this immunosensor was validated by using it to detect SARS-CoV-2 nucleocapsid protein, which could be detected at concentrations as low as 50 pg/mL in whole serum and 10 pg/mL in 5× diluted serum. We also adapted this assay onto a handheld smartphone-based diagnostic device that could detect SARS-CoV-2 nucleocapsid protein at concentrations as low as 230 pg/mL in whole serum and 100 pg/mL in 5× diluted serum. Lastly, we assessed the capability of this immunosensor to diagnose COVID-19 infection by testing clinical serum specimens, which revealed its ability to accurately distinguish PCR-positive COVID-19 patients from healthy, uninfected individuals based on SARS-CoV-2 nucleocapsid protein serum levels. To the best of our knowledge, this work is the first demonstration of rapid (<1 h) SARS-CoV-2 antigen quantification in whole serum samples. The ability to rapidly detect SARS-CoV-2 protein biomarkers with high sensitivity in very small (<50 μL) serum samples makes this platform a promising tool for point-of-care COVID-19 testing.

Keywords: COVID-19; SARS-CoV-2; electrochemical; immunosensor; microfluidic; nucleocapsid protein.


Figures

Figure 1.
Figure 1.
Schematic illustrations of (A) the microfluidic immunosensor chip highlighting the magnetic concentration of DMBs to the sensor surface, (B) microfluidic immunosensor chip for the smartphone-based diagnostic device, and (C) experimental setup and electrochemical sensing scheme using the PalmSens4-based sensing platform.
Figure 2.
Figure 2.
(A) Amperometric currents generated from undiluted serum samples spiked with SARS-CoV-2 N protein at 0 ng/mL and 1 ng/mL and corresponding S/B ratios using immunosensors with five different SARS-CoV-2 N protein antibody pairs. Measurements were performed using magnetic concentration and incubation times of 1 min and 50 min, respectively. (B) Amperometric currents generated from undiluted serum samples spiked with SARS-CoV-2 N protein at 0 ng/mL and 1 ng/mL and corresponding S/B ratios with varying sample:DMB volume ratios. Measurements were performed using magnetic concentration and incubation times of 1 min and 50 min, respectively (C) Amperometric currents generated from undiluted serum samples spiked with SARS-CoV-2 N protein at 0 ng/mL and 1 ng/mL and corresponding S/B ratios with varying magnetic concentration times and a 50 min sample incubation duration. (D) Amperometric currents generated from undiluted serum samples spiked with SARS-CoV-2 N protein at 0 ng/mL and 1 ng/mL and corresponding S/B ratios with varying incubation times and 1 min of magnetic enrichment. Each bar represents the mean ± standard deviation (SD) of three separate measurements obtained using new sensors.
Figure 3.
Figure 3.
(A) Chronoamperograms generated from whole serum samples spiked with SARS-CoV-2 N protein at varying concentrations. (B) Calibration plots based on amperometric currents at 100 sec for whole serum samples with 50 minutes incubation and 5× diluted serum samples with 25 minutes incubation. Each data point represents the mean ± SD of three separate measurements obtained using new sensors. Inset shows amperometric currents for samples containing SARS-CoV-2 N protein from 0 to 1 ng/mL. Each bar represents the mean ± SD of three separate measurements obtained using new sensors. The dashed and solid lines correspond to the lower LOD for measurements of whole serum and 5× diluted serum, respectively. (C) Amperometric currents generated from serum samples containing SARS-CoV-2 N protein, SARS-CoV N protein, MERS-CoV N protein, SARS-CoV-2 Spike RBD protein and non-spiked serum (blank control). Each bar represents the mean ± SD of three separate measurements obtained using new sensors.
Figure 4.
Figure 4.
(A) Smartphone-based diagnostic device for electrochemical measurements of SARS-CoV-2 N protein. (B) Microfluidic immunosensor chip consisting of a cAb-coated SPGE sensor and PET-PMMA cartridge. (C) Calibration plots based on amperometric currents at 100 sec for whole serum samples with 50 min incubation and 5× diluted serum samples with 25 min incubation. Each data point represents the mean ± SD of three separate measurements obtained using new sensors. Inset shows amperometric currents for samples containing SARS-CoV-2 N protein from 0 to 1 ng/mL. Each bar represents the mean ± SD of three separate measurements obtained using new sensors. The dashed and solid lines correspond to the lower LOD for measurements of whole serum and 5× diluted serum, respectively.
Figure 5.
Figure 5.
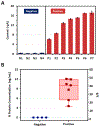
(A) Electrochemical signals generated from serum specimens obtained from COVID-19 patients (Positive) and uninfected individuals (Negative). Each bar represents the mean ± SD of three separate measurements obtained using new sensors. (B) Calculated SARS-CoV-2 N protein concentration and corresponding S/B ratios for clinical serum specimens.

References

    1. COVID-19 Map - Johns Hopkins Coronavirus Resource Center https://coronavirus.jhu.edu/map.html (accessed Nov 8, 2020).
    1. Zhang W; Du RH; Li B; Zheng XS; Yang X. Lou; Hu B; Wang YY; Xiao GF; Yan B; Shi ZL; Zhou P. Molecular and Serological Investigation of 2019-NCoV Infected Patients: Implication of Multiple Shedding Routes. Emerg. Microbes Infect 2020, 9 (1), 386–389. 10.1080/22221751.2020.1729071. - DOI - PMC - PubMed
    1. Fang Y; Zhang H; Xie J; Lin M; Ying L; Pang P; Ji W Sensitivity of Chest CT for COVID-19: Comparison to RT-PCR. Radiology. Radiological Society of North America Inc. August 1, 2020, pp E115–E117. 10.1148/radiol.2020200432. - DOI - PMC - PubMed
    1. Wölfel R; Corman VM; Guggemos W; Seilmaier M; Zange S; Müller MA; Niemeyer D; Jones TC; Vollmar P; Rothe C; Hoelscher M; Bleicker T; Brünink S; Schneider J; Ehmann R; Zwirglmaier K; Drosten C; Wendtner C Virological Assessment of Hospitalized Patients with COVID-2019. Nature 2020, 581 (7809), 465–469. 10.1038/s41586-020-2196-x. - DOI - PubMed
    1. West CP; Montori VM; Sampathkumar P COVID-19 Testing: The Threat of False-Negative Results. Mayo Clinic Proceedings. Elsevier Ltd; June 1, 2020, pp 1127–1129. 10.1016/j.mayocp.2020.04.004. - DOI - PMC - PubMed

Publication types

Substances