

doi: 10.1161/CIRCRESAHA.120.318458.
Epub 2021 Feb 25.
Innervation and Neuronal Control of the Mammalian Sinoatrial Node a Comprehensive Atlas
Affiliations
- PMID: 33629877
- PMCID: PMC8284939
- DOI: 10.1161/CIRCRESAHA.120.318458
Item in Clipboard
Innervation and Neuronal Control of the Mammalian Sinoatrial Node a Comprehensive Atlas
Circ Res.
.
Abstract
[Figure: see text].
Keywords: autonomic nervous system; electrophysiology; neuroanatomy; neurophysiology; sinoatrial node.
Figures
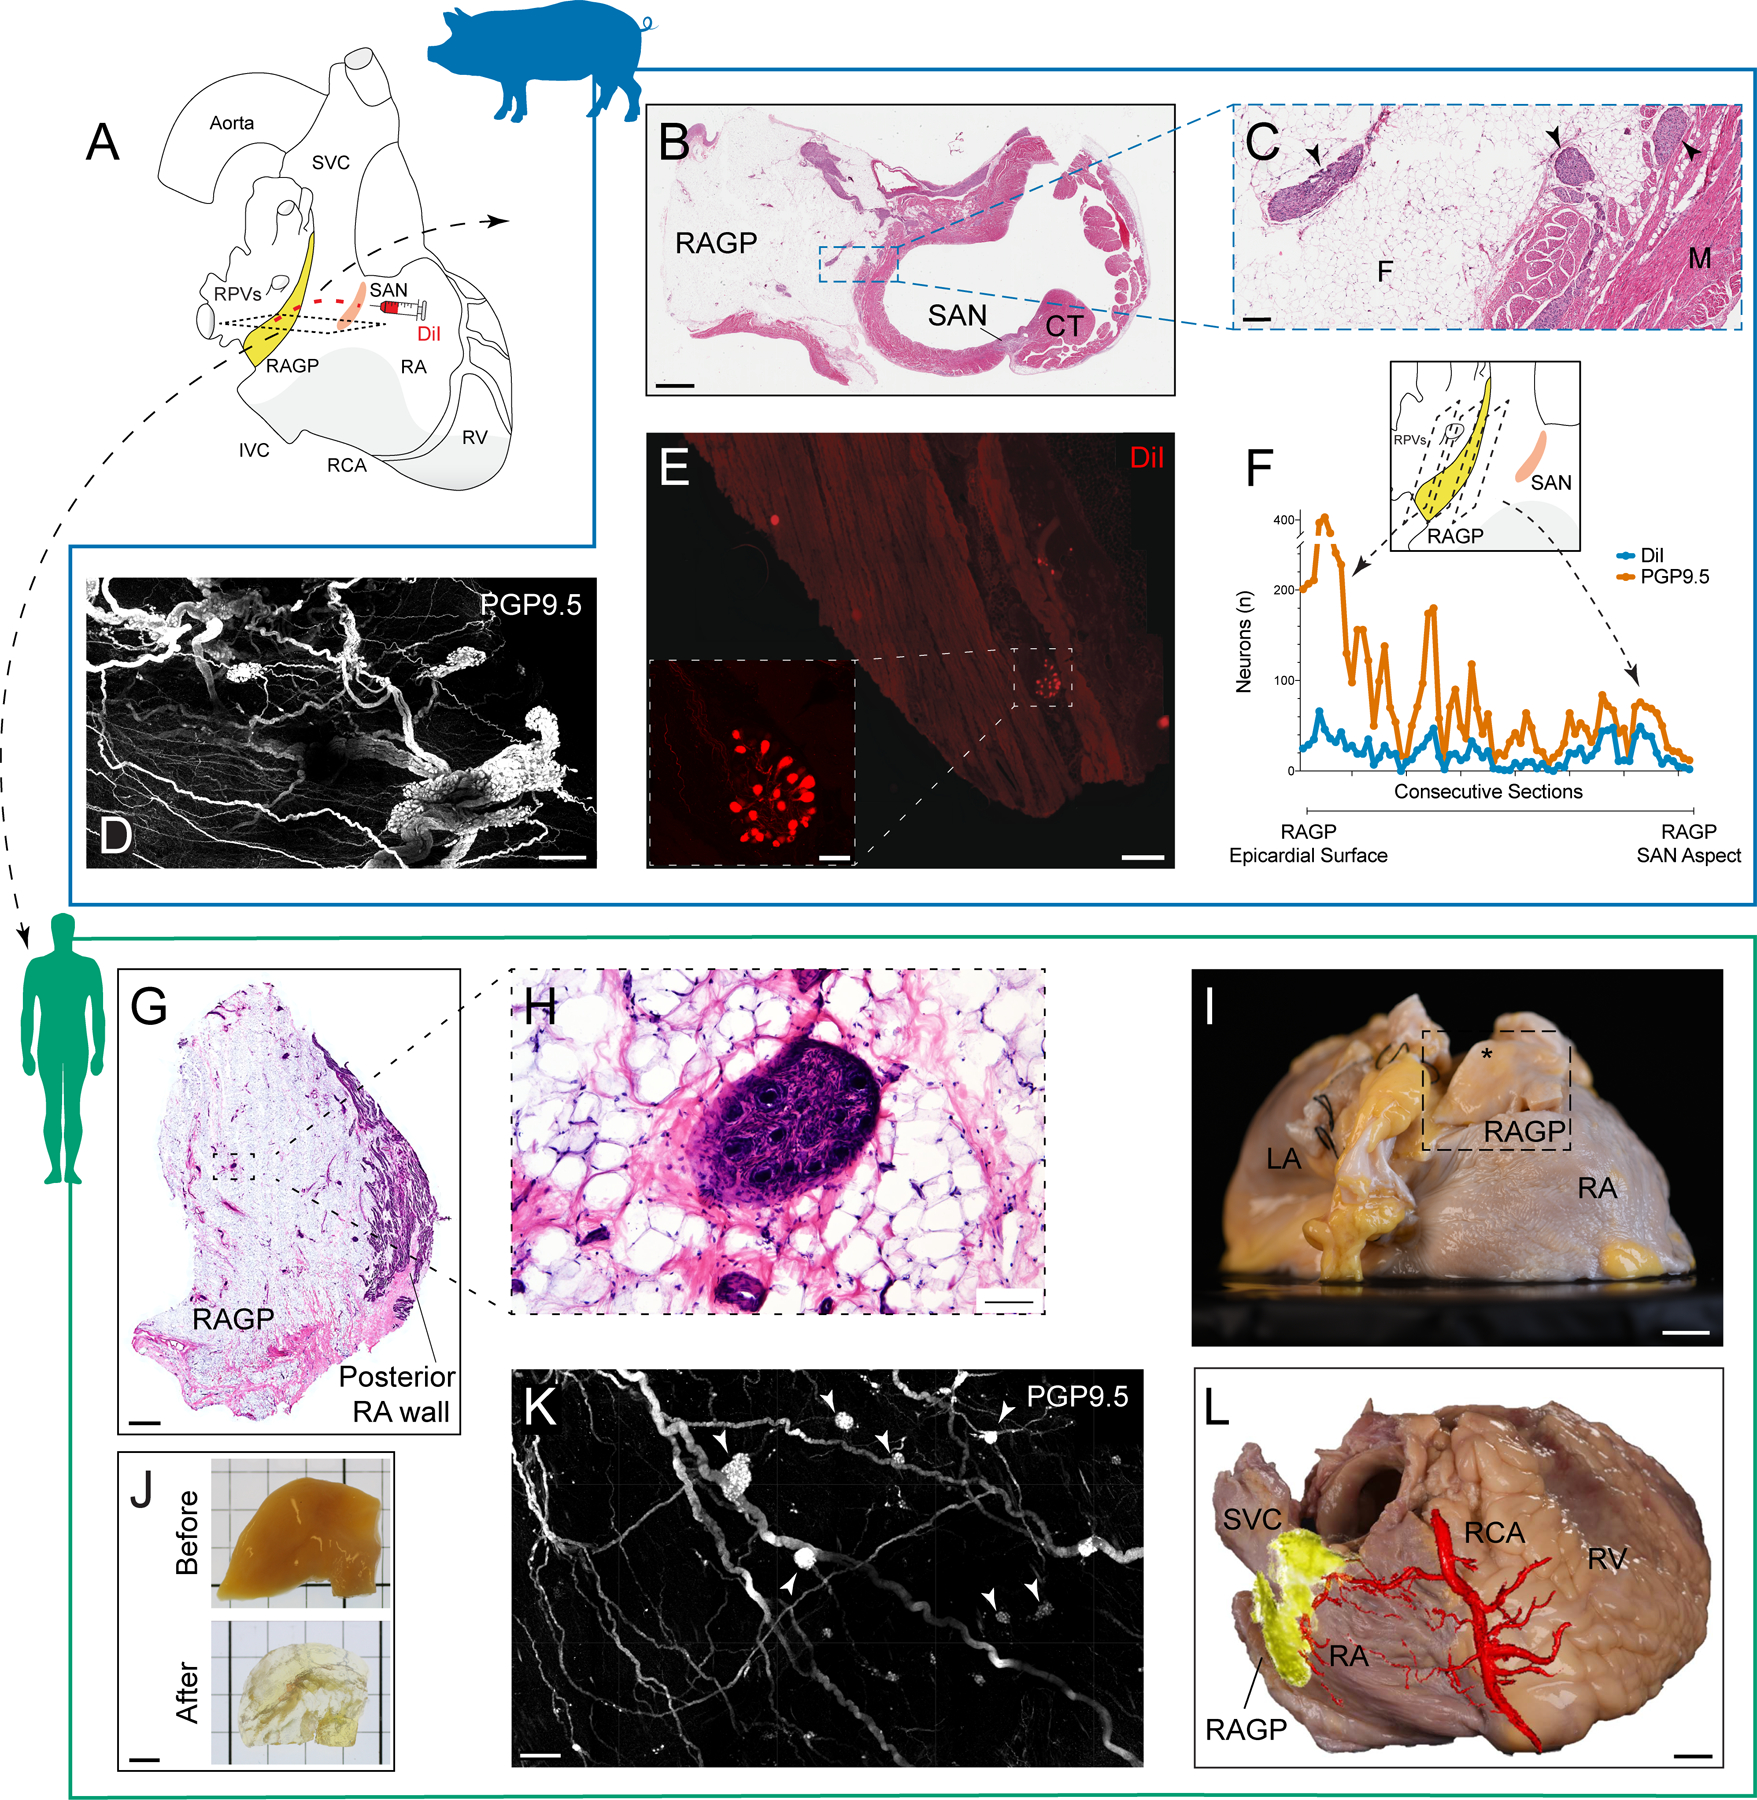
A, Schematic of human heart demonstrating proximity of RAGP to SAN. DiI was injected into the porcine SAN followed by tissue harvest of RAGP 3 wk later. B, Hematoxylin and eosin (H&E) staining of porcine RAGP-SAN region in a male pig imaged at 20×. C, Ganglia (arrowheads) suspended in adipose tissue as well as at fat-RA muscle interface at higher magnification. D, Maximum intensity projection (MIP) of modified immunolabeling-enabled 3-dimensional imaging of solvent-cleared organs (iDISCO+)-cleared RAGP from a male pig illustrating cluster of interconnected ganglia with PGP9.5 (protein gene product 9.5; white). E, Example of DiI-labeled neurons and nerve fibers in a ganglion in the RAGP. Higher magnification of DiI-labeled ganglion is shown (inset). F, Quantification of DiI- and PGP9.5-positive and total neurons from a female pig. Eight representative sets of sections were collected from each RAGP in this study, and this data was obtained from one set that spanned the entire RAGP (1.8 cm). G, H&E staining of human RAGP fat pad at the posterior RA wall. H, Ganglion suspended in fat at higher magnification. I, Right posterior oblique view of gross anatomy of a second human RAGP dissected (inset) for tissue clearing. Dissection contained epicardial fat (*) with adjacent muscle. J, Portion of human RAGP before and after iDISCO+ tissue clearing. K, MIP of iDISCO+-cleared portion of human RAGP demonstrating clusters of interconnected ganglia (arrowheads) with PGP 9.5 (white). L, Photograph of right posterior oblique view of a third human heart with overlay of microCT image of contrast-media-injected right coronary artery showing RAGP is supplied by the sinoatrial nodal artery. Scale bars are 2 mm (B and G), 200 μm (C), 500 μm (D, K, and E), 100 μm (E inset and H), 1 cm (I and L), and 5 mm (J). CT indicates crista terminalis; F, fat; LA, left atrium; and M, muscle.
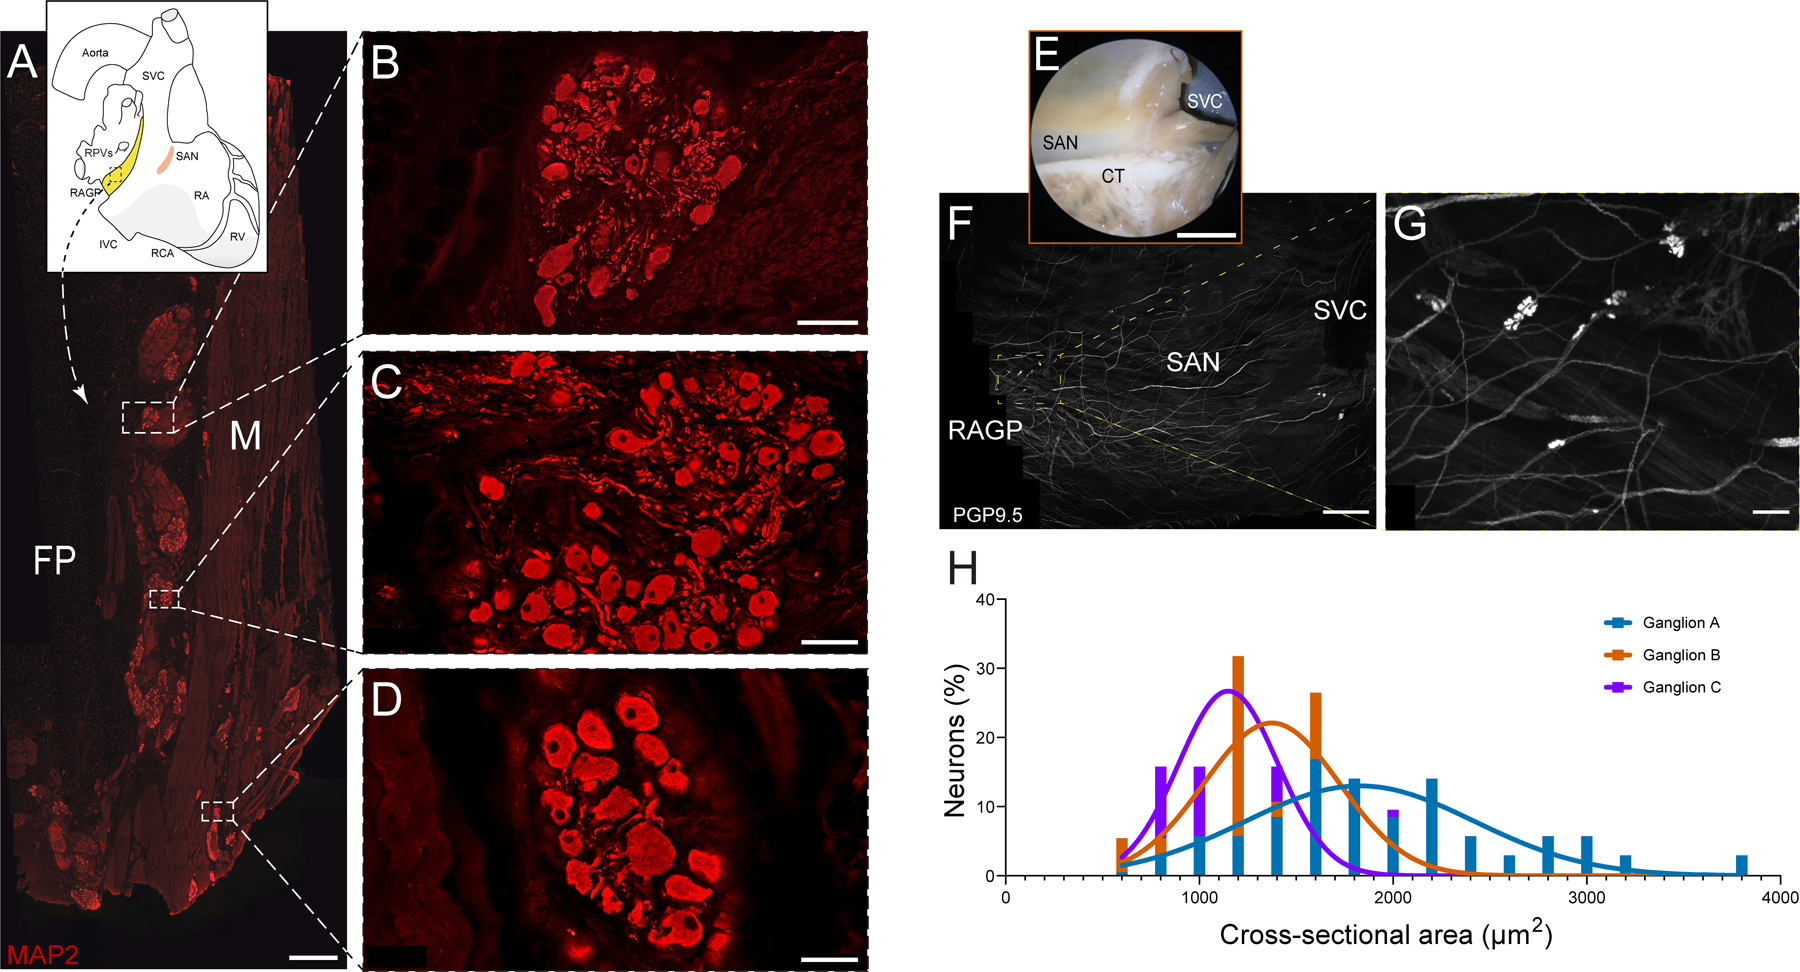
A, Photomontage of section that was immunostained for the pan-neuronal marker MAP2 (microtubule-associated protein 2; red). This figure was created from 165 overlapping 10× fluorescence images. B–D, Three ganglia shown at higher magnification. Most ganglia occur near the interface between the fat pad (FP) and atrial muscle (M), although some occur between muscle bundles (D). E, Photograph of sinoatrial node (SAN) region of RAGP-SAN tissue from a male pig that underwent whole-mount staining for PGP9.5 (protein gene product 9.5, white; F). G, Examples of 3 ganglia identified in F that underwent quantification of cross-sectional area (H). Frequency histograms were fitted with a gaussian plot to show the distribution of cell sizes for each ganglion. Five porcine RAGPs (3 males and 2 females) were evaluated in the immunohistochemical studies. Scale bars are 1 mm (A), 50 μm (B and D), 100 μm (C), 1 cm (E), 2.5 mm (F), and 200 μm (G).
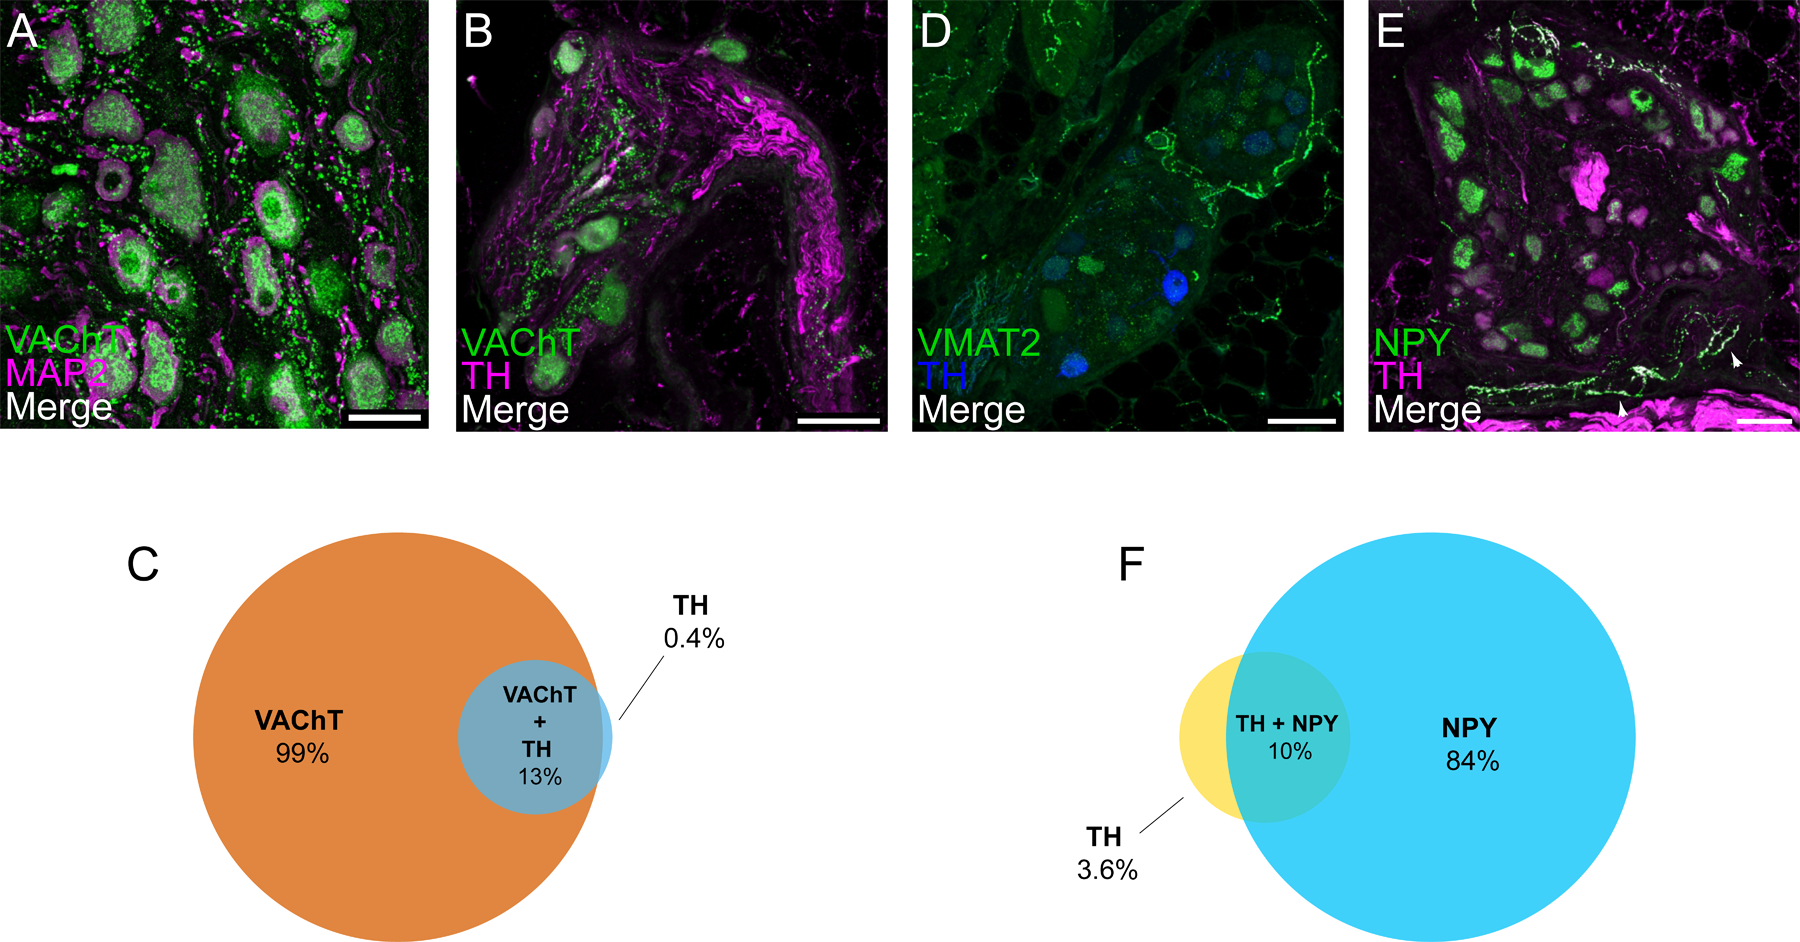
A, Confocal image of a ganglion double labeled for cholinergic marker VAChT (vesicular acetylcholine transporter) and for MAP2 (microtubule-associated protein 2). VAChT appears as granular staining of neuronal cell bodies and varicose staining in the neuropil. Neuronal cell bodies and processes are more fully delineated by MAP2 staining. Colocalization of VAChT and MAP2 cell bodies and the close association of VAChT-positive varicosities to cell bodies and nerve processes are shown. B, Confocal image of a ganglion double labeled for VAChT and for noradrenergic marker tyrosine hydroxylase (TH) indicate some neurons that contain VAChT and TH. Venn diagram illustrates proportion of VAChT-positive, TH-positive, and both VAChT- and THpositive neurons (C). D, A few RAGP neurons stain for TH but usually lack the essential noradrenergic marker VMAT2 (vesicular monoamine transporter 2), although positive staining for VMAT2 does occur in nerve fibers. Confocal image of a ganglion double labeled for NPY (neuropeptide Y) and TH (E) illustrate that many neurons show moderate to intense, granular labeling for NPY, but the same neurons lack TH. In contrast, NPY and TH colocalized in some nerve fibers. Nerve fibers labeled for NPY and TH (arrowheads) are sparse within ganglia and not in close apposition to ganglionic neurons. Venn diagram illustrates proportion of NPY-positive, TH-positive, and both NPY- and TH-positive neurons (F). Each value is based on analysis of confocal images from at least 8 microscopic fields in porcine RAGP (n=4; 2 males and 2 females). Scale bars are 50 μm (A) and 100 μm (B, D, and E).
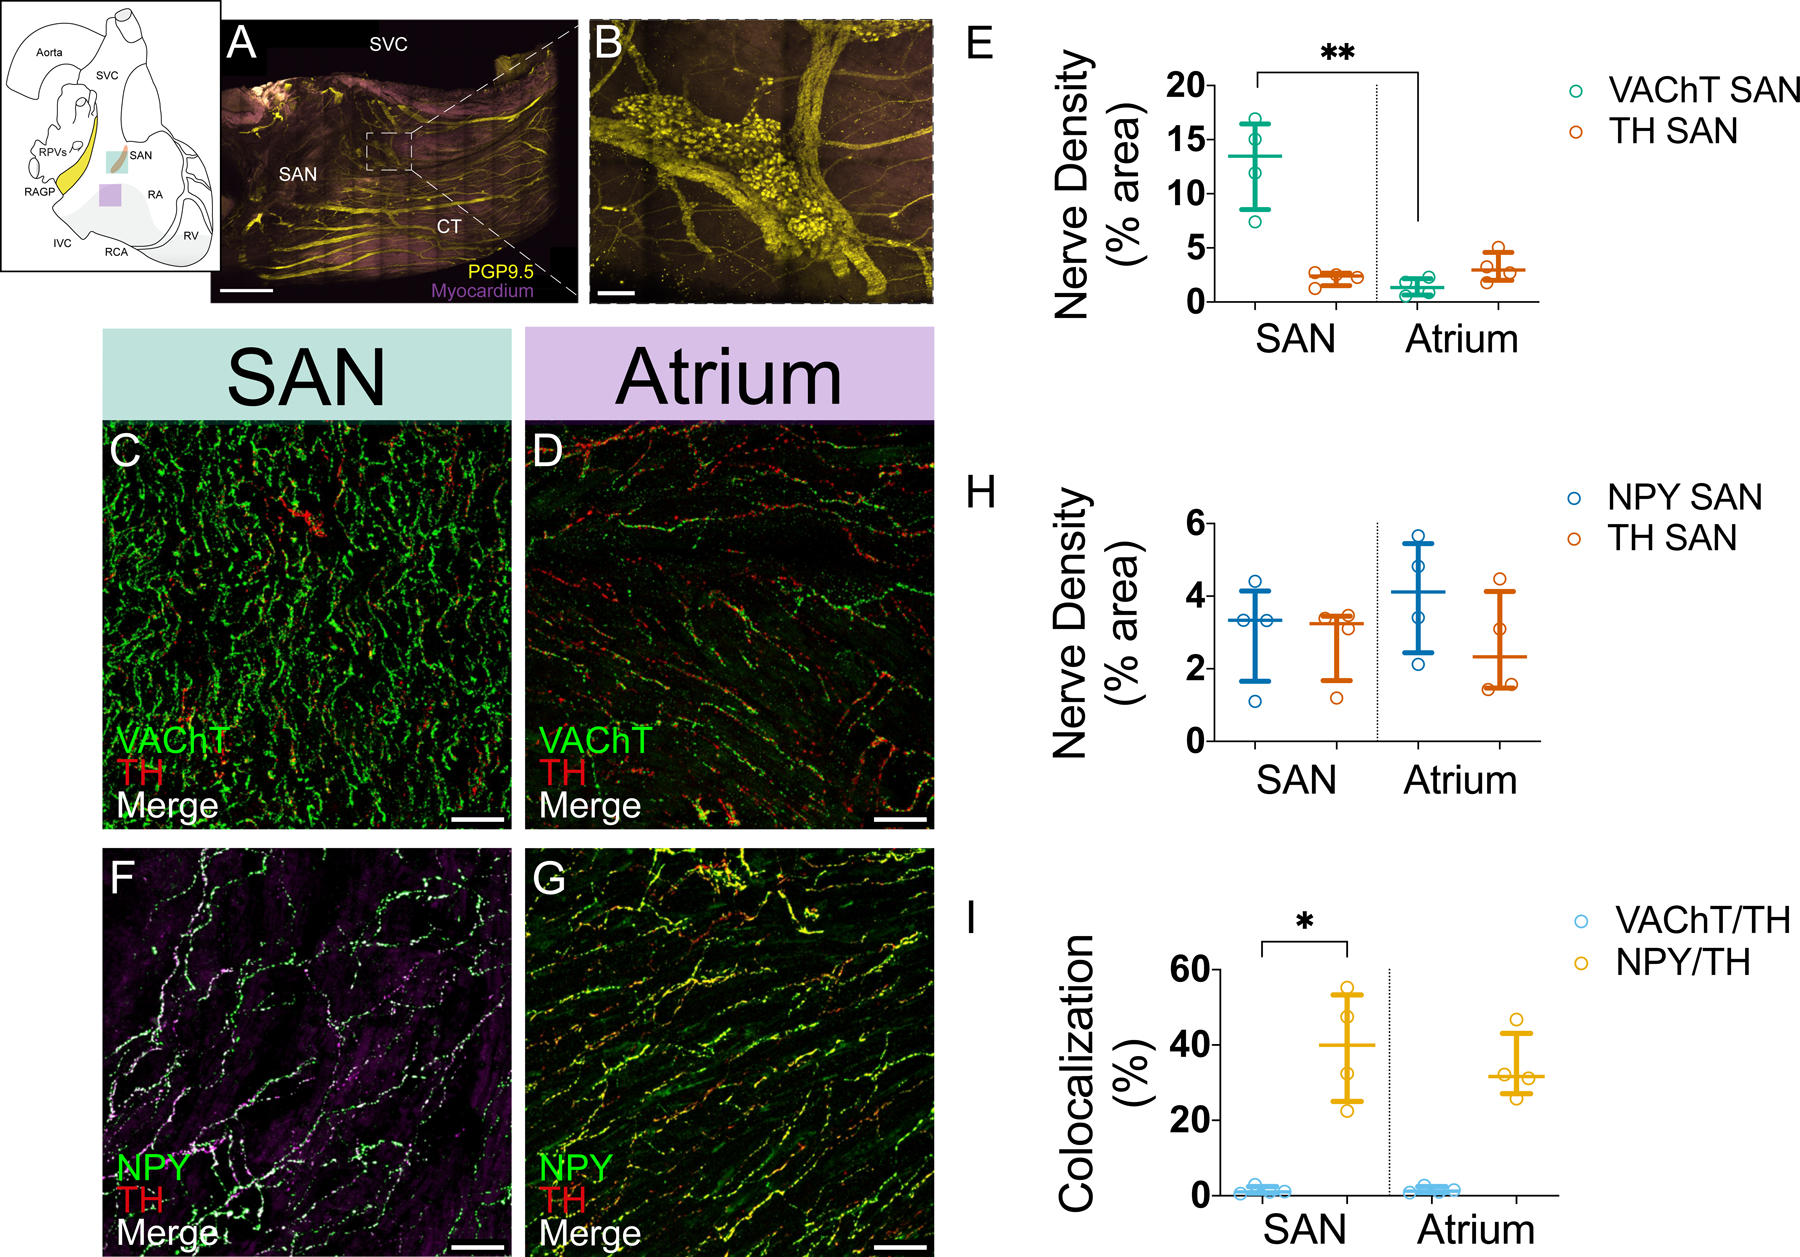
A, Maximum intensity projection of modified immunolabeling-enabled 3-dimensional imaging of solvent-cleared organs (iDISCO+)-cleared female porcine SAN illustrating ganglia and network of nerves (yellow). Purple: muscle autofluorescence. B, Ganglia found in SAN region at higher magnification. Sections of SAN (C) and right atrial (RA) myocardium (D) were double labeled for VAChT (vesicular acetylcholine transporter) and TH. Confocal images from these sections show that cholinergic nerves are more abundant than noradrenergic nerves in the SAN (C) and that both nerve types have similar density in atrial myocardium (D). VAChT and TH are not colocalized. E, Density of cholinergic and noradrenergic nerves in the SAN and RA myocardium. Sections of SAN (F) and RA myocardium (G) were double labeled for NPY (neuropeptide Y) and TH. Confocal images from these sections show that staining for NPY and TH labeled the same population of nerves in both regions and have extensive colocalization. H, Density of NPY-positive and TH-positive nerves in the SAN and RA myocardium. Sections were double labeled for these markers. I, TH is not colocalized with VAChT but is colocalized with NPY in the SAN and RA. Each value (median [interquartile range]) is based on analysis of confocal images from at least 5 microscopic fields from 4 right atrial ganglionated plexuses (RAGPs; 2M/2F). Comparisons were made using Kruskal-Wallis and Dunn multiple comparisons tests. *Adjusted P≤0.05, **adjusted P≤0.01. Scale bars are 2 mm (A), 200 μm (B), and 50 μm (C–G).
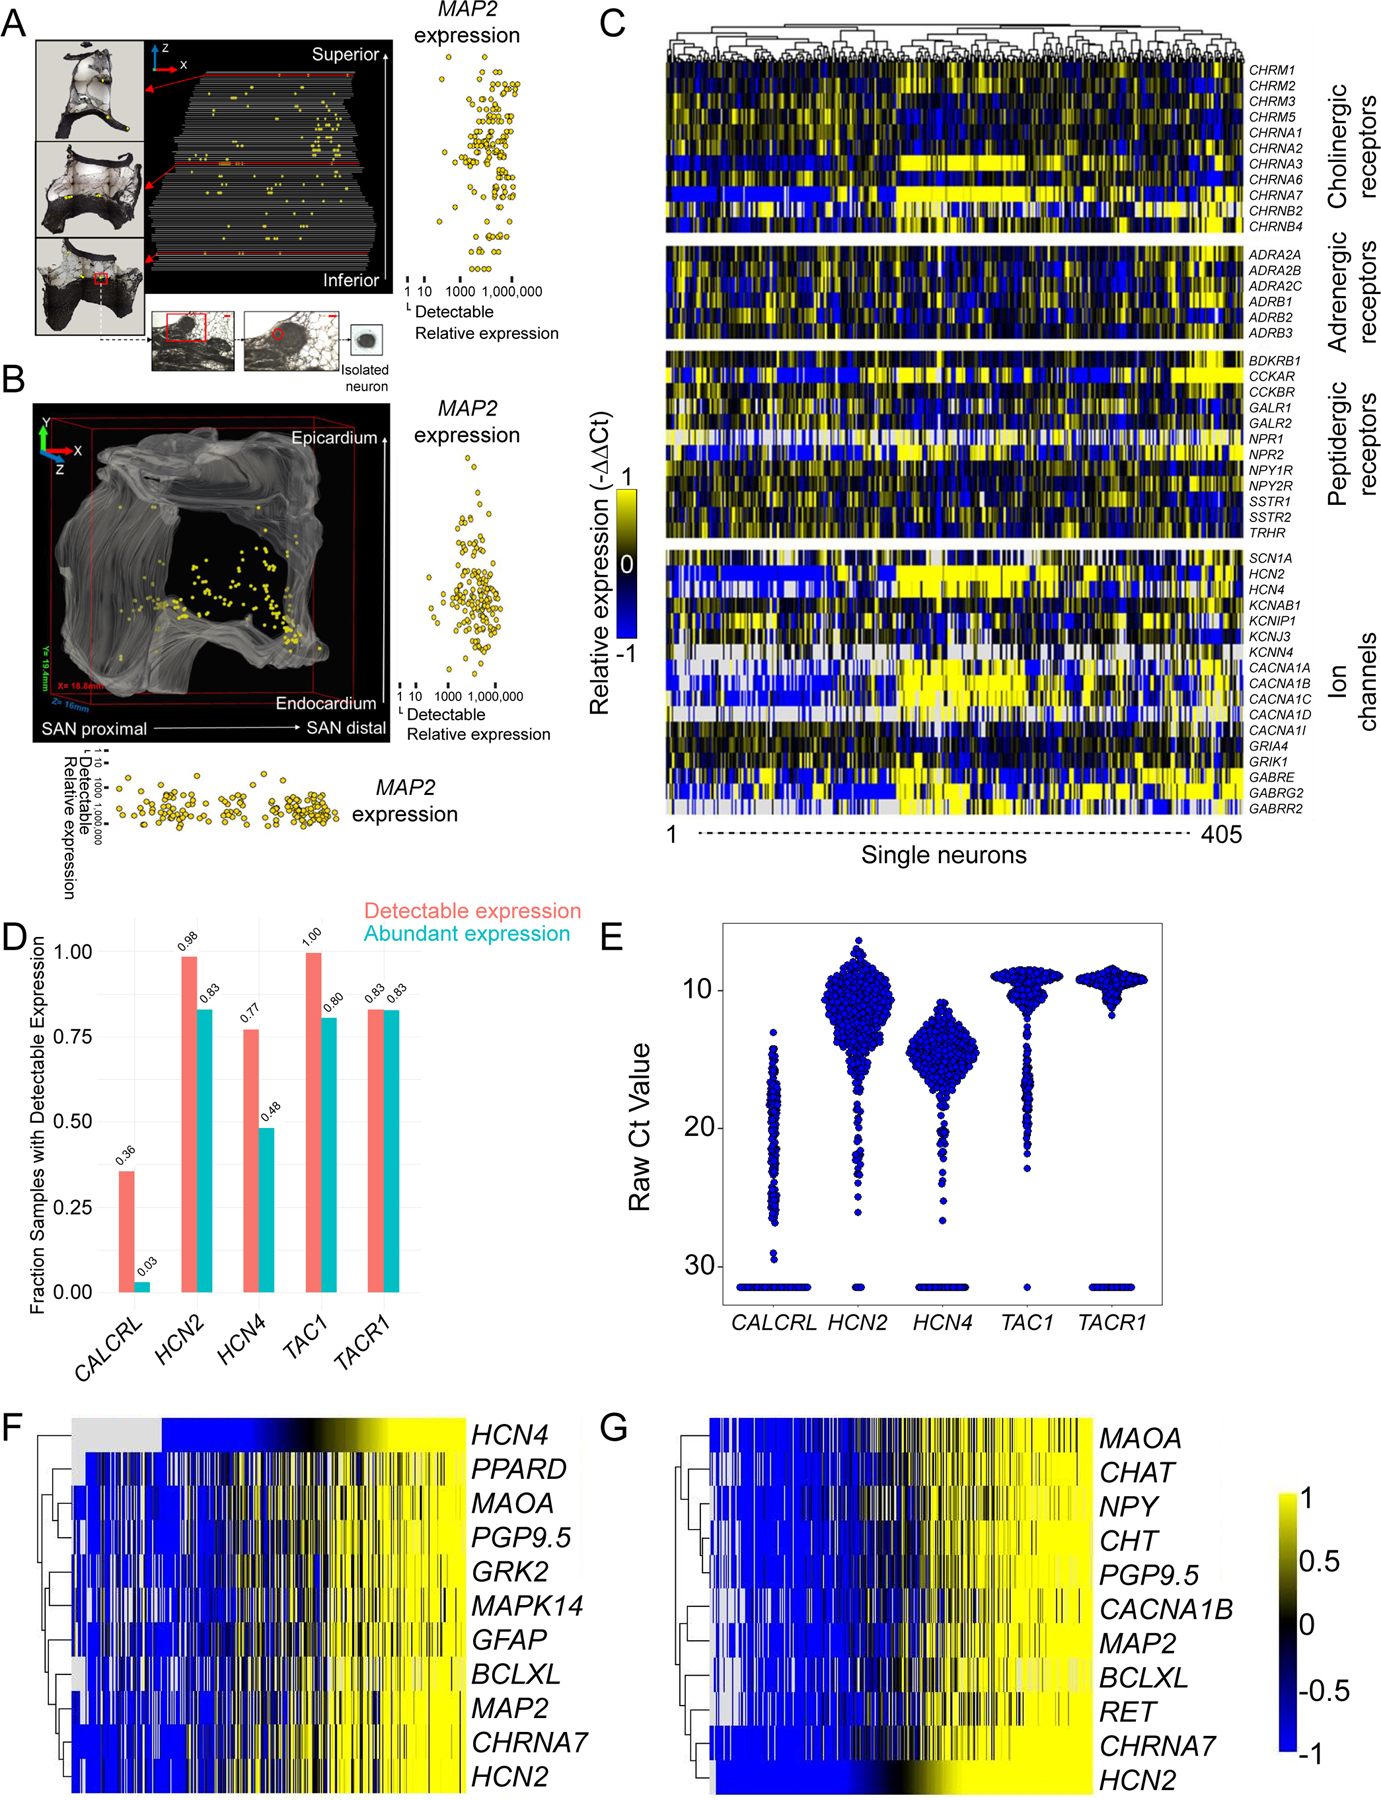
Projections of neurons isolated within the RAGP and their relative expression of pan-neuronal marker MAP2 (microtubule-associated protein 2) in the XZ (A) and XY (B) planes compared with the minimum level of detection. C, Heat map demonstrating diverse profile of neurotransmitters, adrenergic, cholinergic, and peptidergic receptors and ion channels in RAGP neurons. D, A significant proportion of RAGP neurons exhibit high gene expression of HCN2 and HCN4. High expression of TAC1 and TACR1 genes, which are sensory markers, was identified. A smaller proportion expressed the gene encoding the receptor for CGRP (CALCRL). The range of expression of these genes is shown in E. The top 10 genes with correlated expression to HCN2 (Pearson correlation coefficient >0.82; (F) and HCN4 (Pearson correlation coefficient >0.67; (G) are shown. Note that high coexpression of pan-neuronal markers, neurotransmitters, nicotinic cholinergic receptor, and downstream signaling molecules such as G-protein–coupled receptor kinase 2 (GRK2).
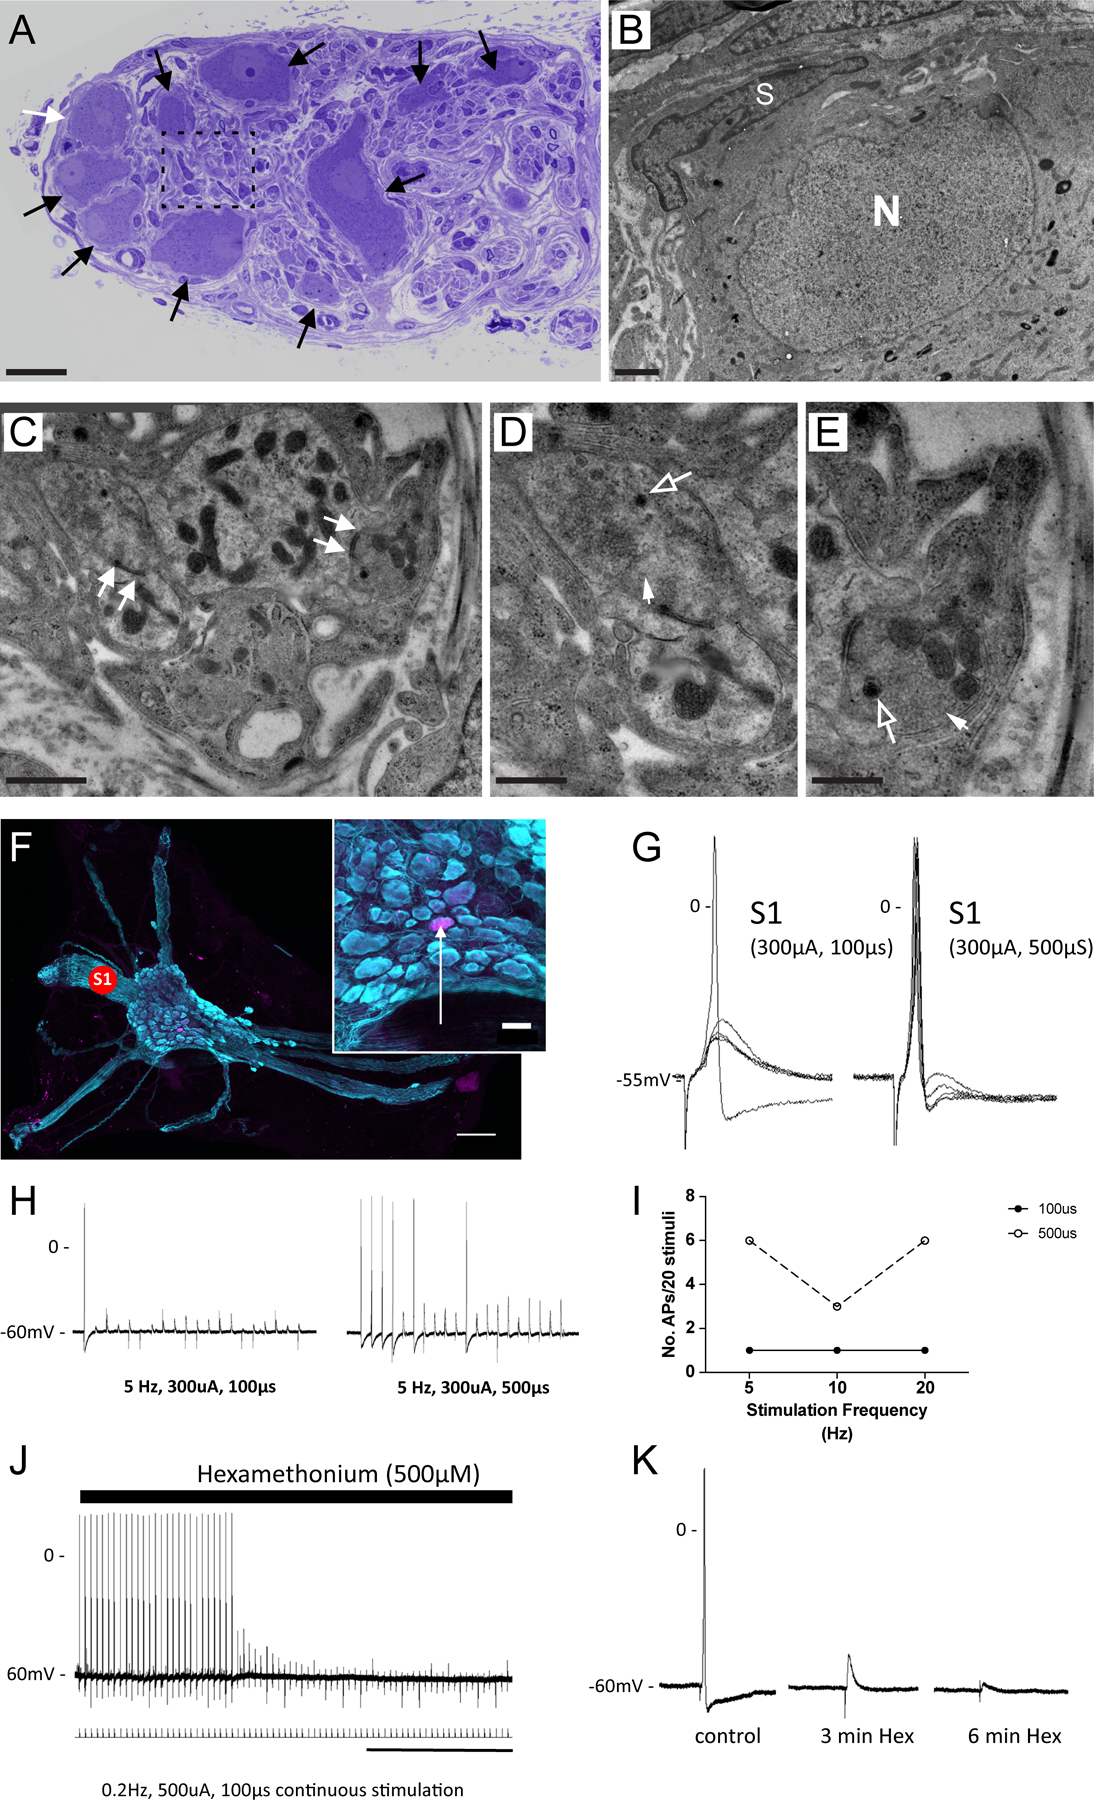
A, Light microscopy image shows toluidine blue labeled RAGP neurons (arrows). B, Transmission electron microscopic (TEM) image of neuron highlighted by white arrow in A. Note cell body nucleus (N) and satellite cell (S). No synaptic boutons are detected surrounding the cell body. C-E, TEM of synaptic boutons in contact with dendritic profiles in the porcine RAGP (detected in regions highlighted by dashed line A). Note synaptic specializations in the form of active zones (arrows in C). The synaptic boutons contain clear rounded vesicles (closed arrows) and a few dense-core vesicles (open arrows). Each synaptic bouton-dendrite complex is in close apposition with surrounding satellite glial processes. F, Representative ganglion within the RAGP. Note the many nerve bundles emanating from the ganglion. Concentric bipolar stimulating electrodes were placed on interganglionic nerves (S1) to elicit synaptic responses. Inset shows location of neuron (arrow) labeled with neurobiotin from the recording electrode. G, Representative membrane potential responses recorded from the cell in F to stimulation at S1 are shown. There were no failures. Increasing stimulus current duration from 100 to 500 μs increased the probability of generating an action potential due to the larger evoked excitatory postsynaptic potential (EPSP), demonstrating a convergence of inputs. H, Synaptic efficacy was evaluated during continuous trains of presynaptic stimulation at the two pulse widths. Note the increased number of action potentials with the 500 μs pulse indicating fiber recruitment. I, Synaptic efficacy (number of action potentials/stimulus frequency) was greater after increasing stimulus current duration. J and K, The ganglion nicotinic antagonist hexamethonium (Hex) blocked synaptically mediated action potentials demonstrating a convergence of cholinergic inputs at RAGP neurons. Scale bars are 30 μm (A), 1 μm (B and C), 0.5 μm (D and E), 250 μm (F), 50 μm (F, inset), and 2 min (J).
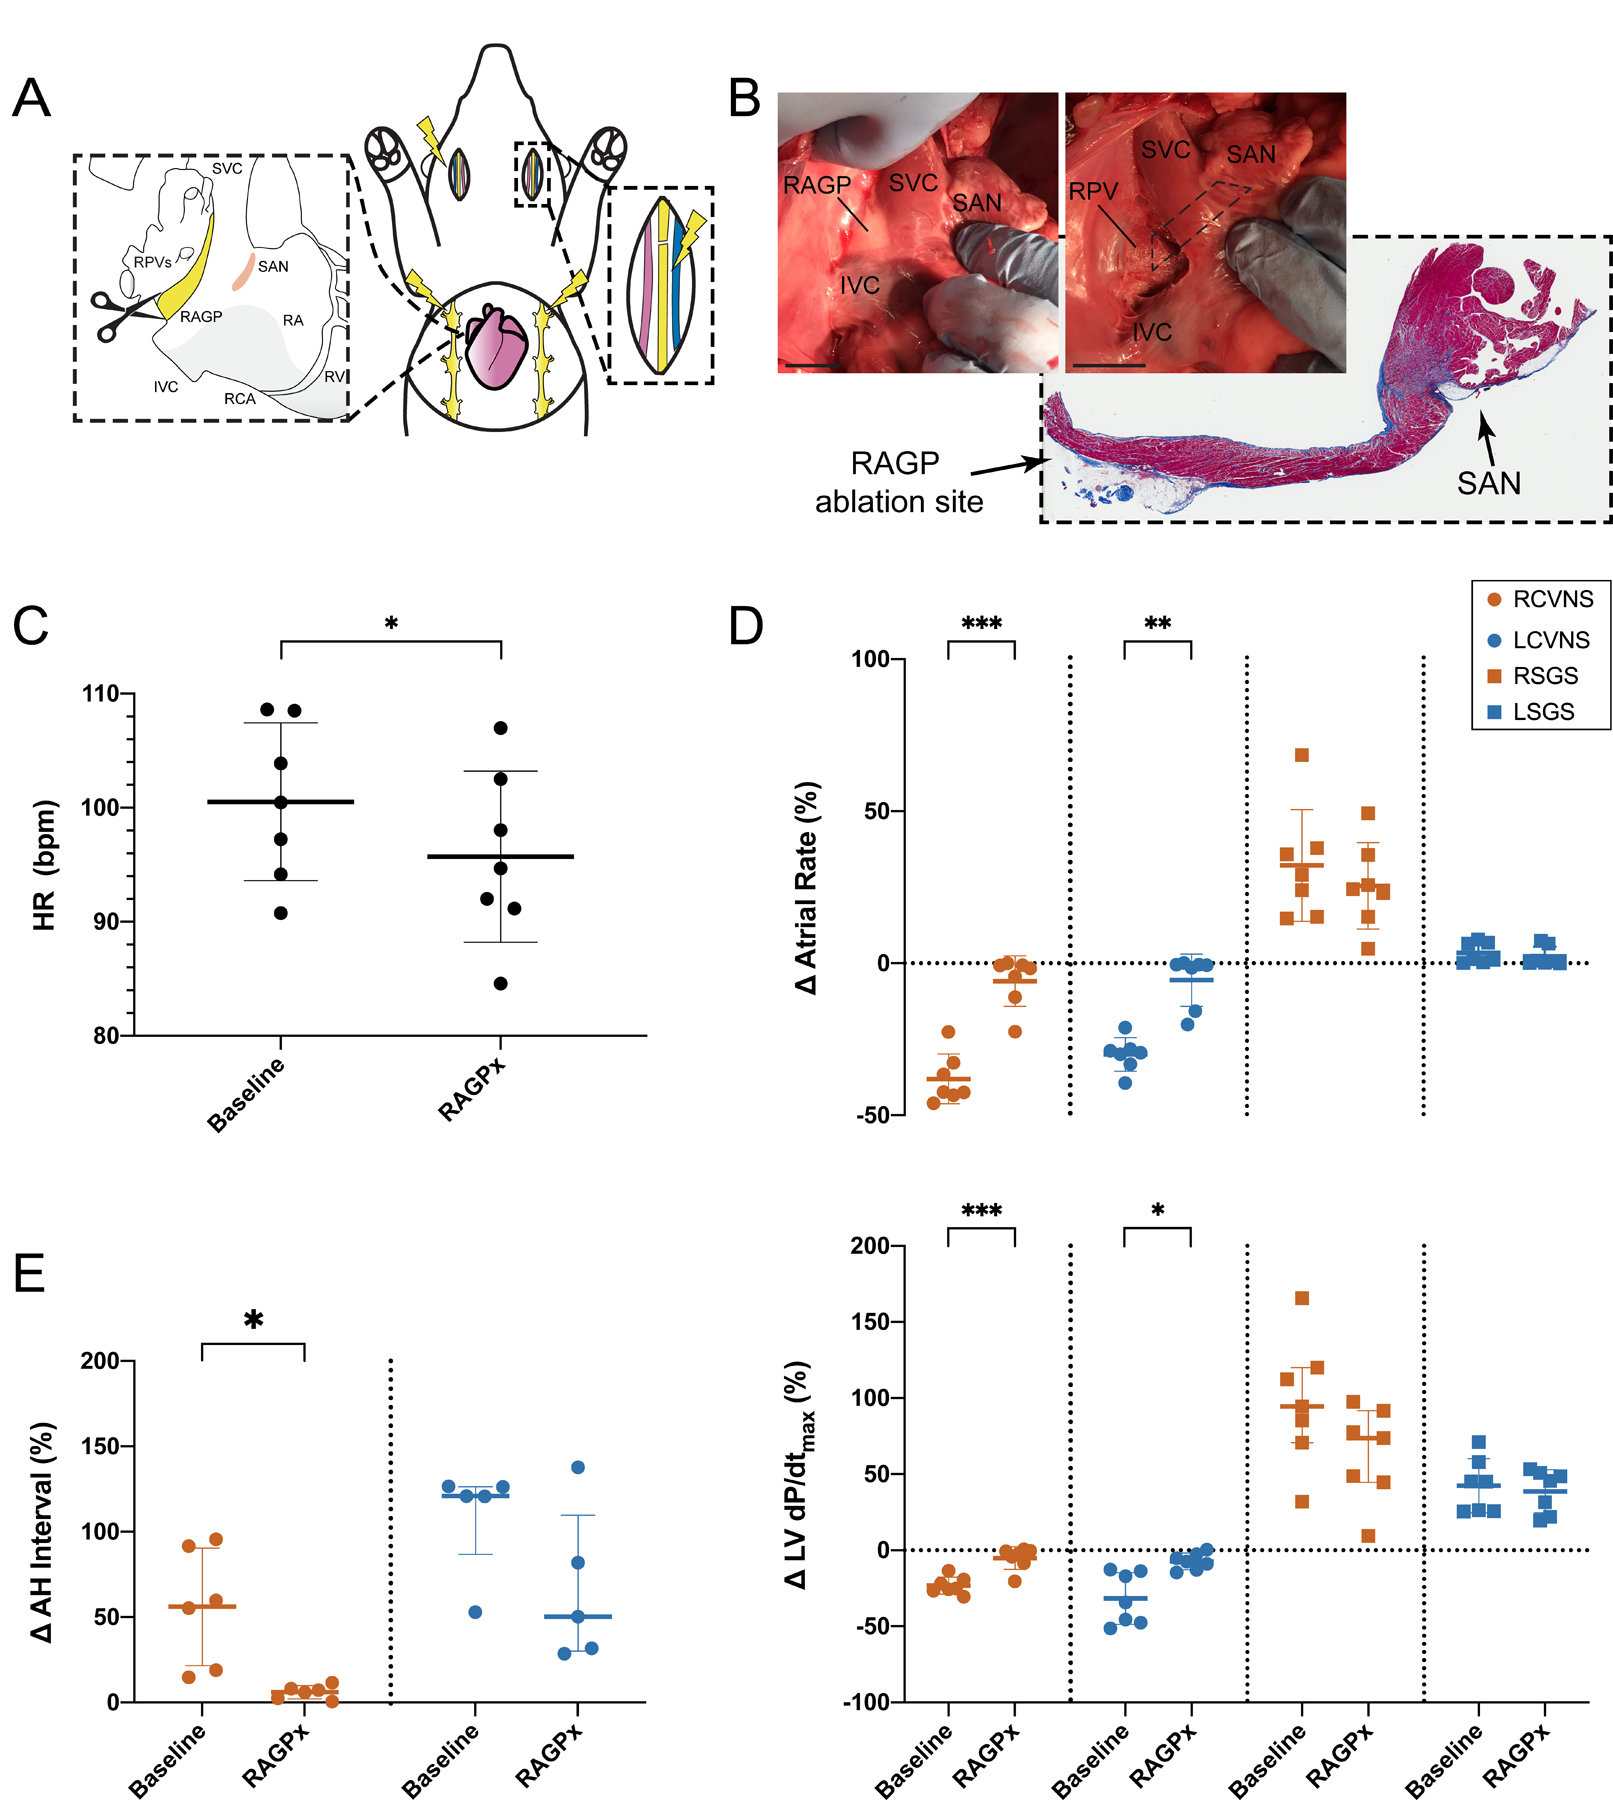
A, Schematic of RAGP ablation performed (n=7, 4M/3F) to assess impact of VNS- and SGS-induced changes on cardiac electrophysiology. B, Gross photograph of porcine RAGP before and after ablation. Representative H&E section with trichrome staining of RAGP demonstrating destruction of epicardial fat pad without impacting sinoatrial node (SAN). RAGP ablation was followed by a reduced resting heart rate (C; n=7) and mitigated right cervical vagal nerve stimulation (RCVNS)- and left cervical vagal nerve stimulation (LCVNS)-induced effects on atrial rate and left ventricular (LV) contractility as measured by maximal dP/dt (D; n=7) as well as atrial-His (AH) interval (E; RCVNS, n=6; LCVNS, n=5). Right stellate ganglion stimulation (RSGS)- and LSGS-induced changes in atrial rate and LV contractility were not statistically significant (D). Scale bars are 2 cm (B). Comparisons were made using paired t tests and Wilcoxon matched-pairs signed-rank tests (C–E). *P≤0.05, **P≤0.01, ***P≤0.001.
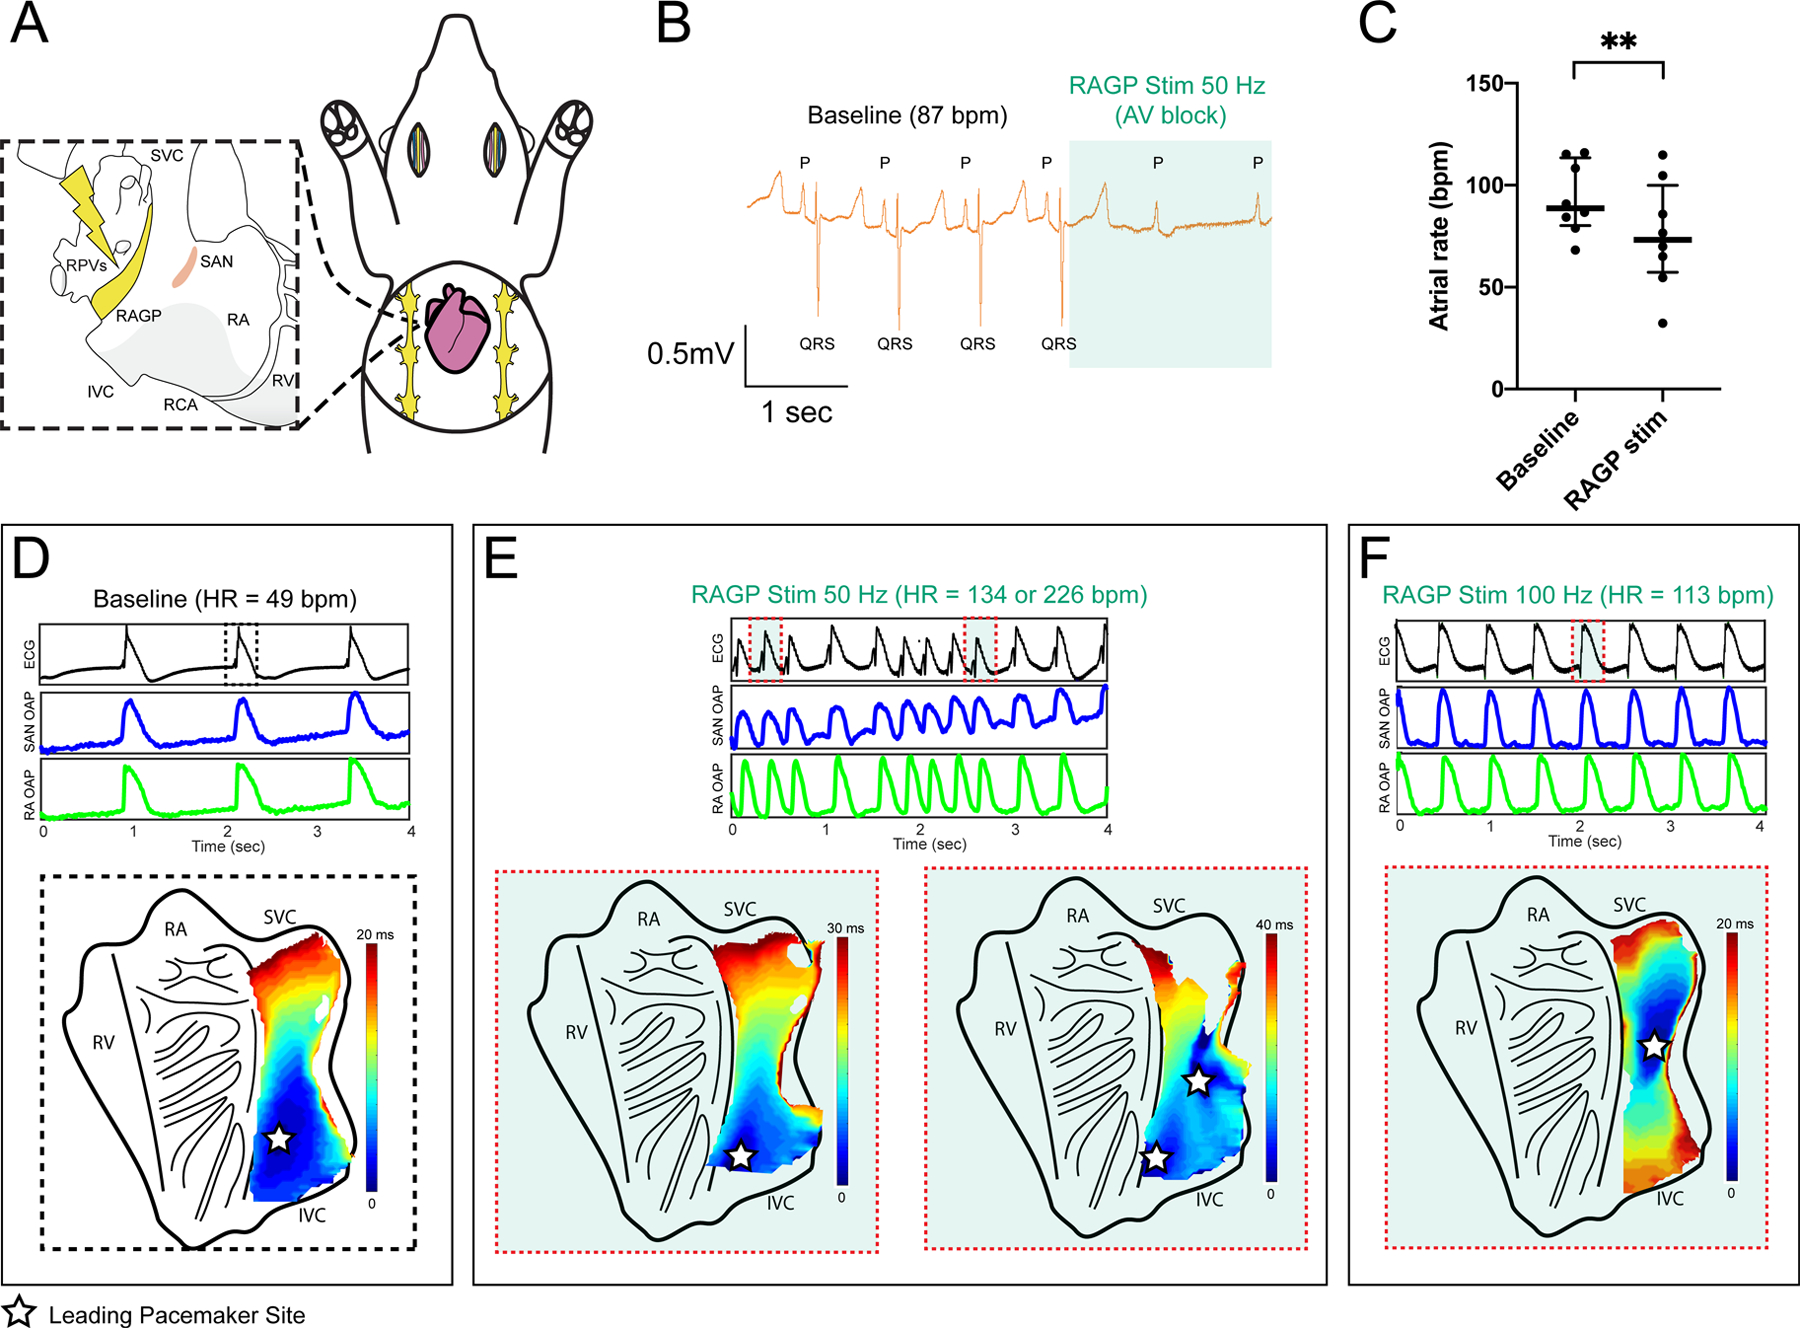
A, Schematic of in vivo porcine RAGP stimulation with multielectrode array recordings in the SAN region. B, ECG demonstrating significant atrial rate reduction from 87 to 61 bpm and atrioventricular (AV) block during RAGP stimulation (50 Hz, 0.1 ms, and 0.9 mA). C, RAGP stimulation (50 Hz, 0.1ms) caused significant sinus bradycardia from a median of 88.7 bpm (80.3–113.5) to 73.2 bpm (57.3–100.0; n=8; 6M/2F). Comparison was made using Wilcoxon matched-pairs signed-rank test, **P≤0.01. Representative optical activation maps of an ex vivo sinoatrial nodal (SAN) preparation from a 52-year-old female human donor heart before (D) and during (E and F) stimulation of the RAGP. Intrinsic firing rate of the ex vivo SAN increased from 49 bpm to at least 134 bpm at 50 Hz (E) and to 113 bpm with 100 Hz of stimulation (F). Stars indicate location of the leading pacemaker site on the endocardial side of the tissue. Corresponding ECG and optical action potential (OAP) recordings are shown below the activation maps. HR indicates heart rate; IVC, inferior vena cava; RA, right atria; RCA, right coronary artery; RPVs, right pulmonary veins; RV, right ventricle; and SVC, superior vena cava.
Comment in
-
The Heart's Little Brain: Shedding New Light and CLARITY on the "Black Box".Circ Res. 2021 Apr 30;128(9):1297-1299. doi: 10.1161/CIRCRESAHA.121.319148. Epub 2021 Apr 29. Circ Res. 2021. PMID: 33914607 Free PMC article. No abstract available.
Similar articles
-
Zebrafish heart as a model to study the integrative autonomic control of pacemaker function.Am J Physiol Heart Circ Physiol. 2016 Sep 1;311(3):H676-88. doi: 10.1152/ajpheart.00330.2016. Epub 2016 Jun 24. Am J Physiol Heart Circ Physiol. 2016. PMID: 27342878 Free PMC article.
-
The enigmatic cardiac fat pads: critical but underappreciated neural regulatory sites.J Cardiovasc Electrophysiol. 2002 Sep;13(9):902-3. doi: 10.1046/j.1540-8167.2002.00902.x. J Cardiovasc Electrophysiol. 2002. PMID: 12380929 No abstract available.
-
Whole-mount demonstration of cholinesterase-containing nerves in the right atrial wall, nodal tissue, and atrioventricular bundle of the pig heart.J Anat. 1971 Apr;108(Pt 3):375-86. J Anat. 1971. PMID: 4102516 Free PMC article. No abstract available.
-
Differential autonomic control of SAN and AVN regions of the canine heart: structure and function.Prog Clin Biol Res. 1988;275:15-31. Prog Clin Biol Res. 1988. PMID: 3051007 Review.
-
Structure and function of the sinus node, AV node and His bundle of the human heart: part I-structure.Prog Cardiovasc Dis. 2002 Nov-Dec;45(3):235-67. doi: 10.1053/pcad.2002.130388. Prog Cardiovasc Dis. 2002. PMID: 12525999 Review. No abstract available.
Cited by
-
Cardioneuroablation for the Treatment of Hypervagotonic Sinus Node Dysfunction.JACC Case Rep. 2024 Jan 9;29(4):102185. doi: 10.1016/j.jaccas.2023.102185. eCollection 2024 Feb 21. JACC Case Rep. 2024. PMID: 38379643 Free PMC article.
-
Pacemaker Channels and the Chronotropic Response in Health and Disease.Circ Res. 2024 May 10;134(10):1348-1378. doi: 10.1161/CIRCRESAHA.123.323250. Epub 2024 May 9. Circ Res. 2024. PMID: 38723033 Free PMC article. Review.
-
From Psychostasis to the Discovery of Cardiac Nerves: The Origins of the Modern Cardiac Neuromodulation Concept.Biology (Basel). 2024 Apr 16;13(4):266. doi: 10.3390/biology13040266. Biology (Basel). 2024. PMID: 38666878 Free PMC article. Review.
-
Remodeling of the Intracardiac Ganglia During the Development of Cardiovascular Autonomic Dysfunction in Type 2 Diabetes: Molecular Mechanisms and Therapeutics.Int J Mol Sci. 2024 Nov 20;25(22):12464. doi: 10.3390/ijms252212464. Int J Mol Sci. 2024. PMID: 39596529 Free PMC article. Review.
-
Comparative specialization of intrinsic cardiac neurons in humans, mice and pigs.J Physiol. 2025 Mar;603(7):2043-2070. doi: 10.1113/JP286714. Epub 2024 Nov 8. J Physiol. 2025. PMID: 39513933
References
-
- Shivkumar K, Ajijola OA, Anand I, Armour JA, Chen PS, Esler M, De Ferrari GM, Fishbein MC, Goldberger JJ, Harper RM, Joyner MJ, Khalsa SS, Kumar R, Lane R, Mahajan A, Po S, Schwartz PJ, Somers VK, Valderrabano M, Vaseghi M and Zipes DP. Clinical neurocardiology defining the value of neuroscience-based cardiovascular therapeutics. J Physiol. 2016;594:3911–54. - PMC - PubMed
-
- Armour JA, Murphy DA, Yuan BX, MacDonald S and Hopkins DA. Gross and microscopic anatomy of the human intrinsic cardiac nervous system. The Anatomical Record: An Official Publication of the American Association of Anatomists. 1997;247:289–298. - PubMed
-
- Armour JA. Potential clinical relevance of the ‘little brain’on the mammalian heart. Experimental physiology. 2008;93:165–176. - PubMed
-
- Lazzara R, Scherlag BJ, Robinson MJ and Samet P. Selective in situ parasympathetic control of the canine sinoatrial and atrioventricular nodes. Circulation Research. 1973;32:393–401. - PubMed
-
- Ardell JL and Randall WC. Selective vagal innervation of sinoatrial and atrioventricular nodes in canine heart. American Journal of Physiology-Heart and Circulatory Physiology. 1986;251:H764–H773. - PubMed
Publication types
MeSH terms
Substances
Grants and funding
LinkOut - more resources
Full Text Sources
Other Literature Sources
