. 2021 Nov;17(11):3592-3606.
doi: 10.1080/15548627.2021.1885203. Epub 2021 Feb 25.

Cannabidiol inhibits human glioma by induction of lethal mitophagy through activating TRPV4

Affiliations

Cannabidiol inhibits human glioma by induction of lethal mitophagy through activating TRPV4

Tengfei Huang et al. Autophagy. 2021 Nov.

Abstract

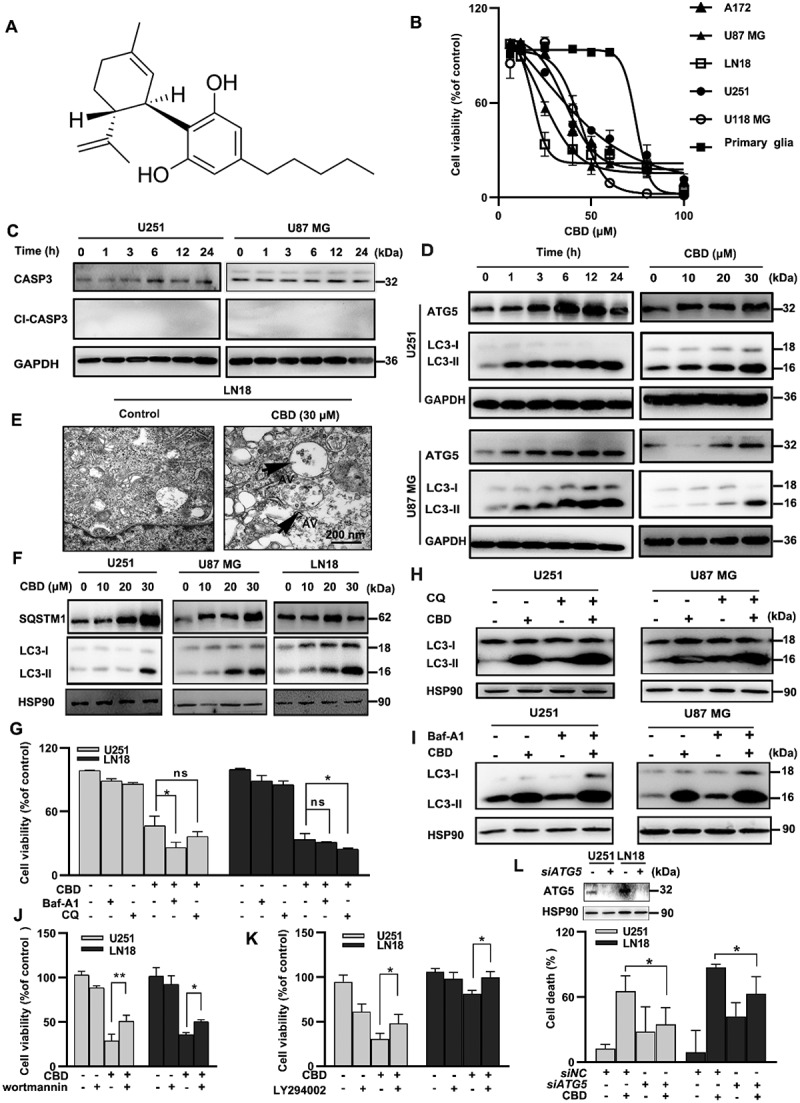
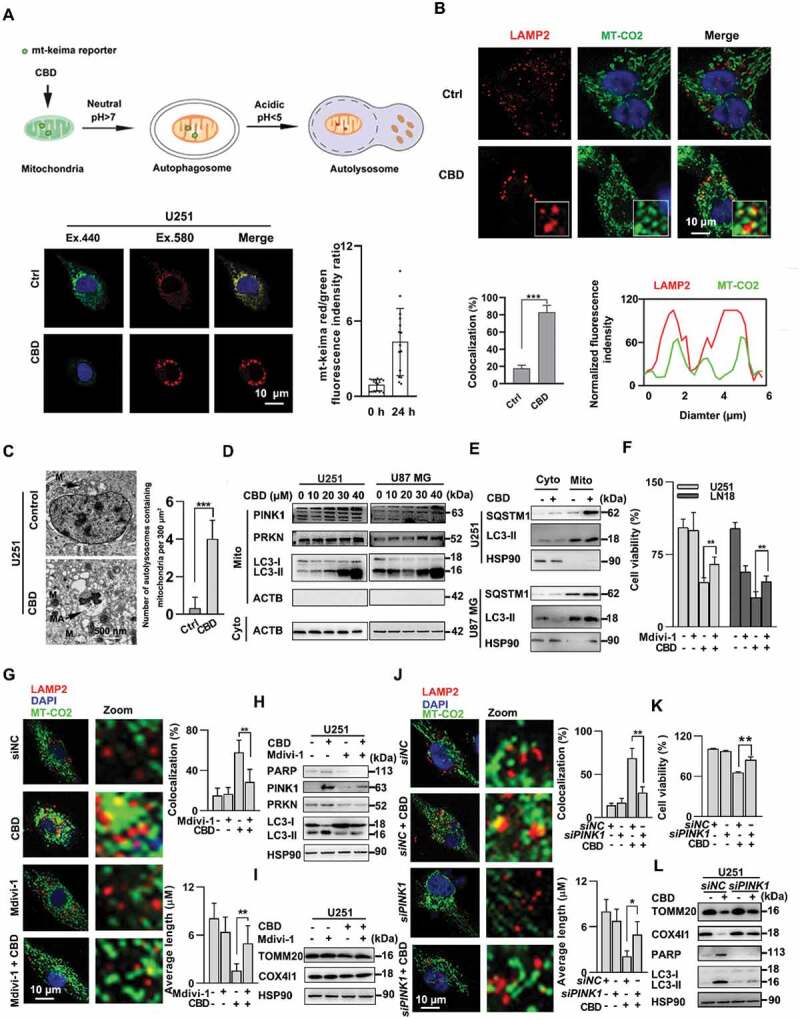
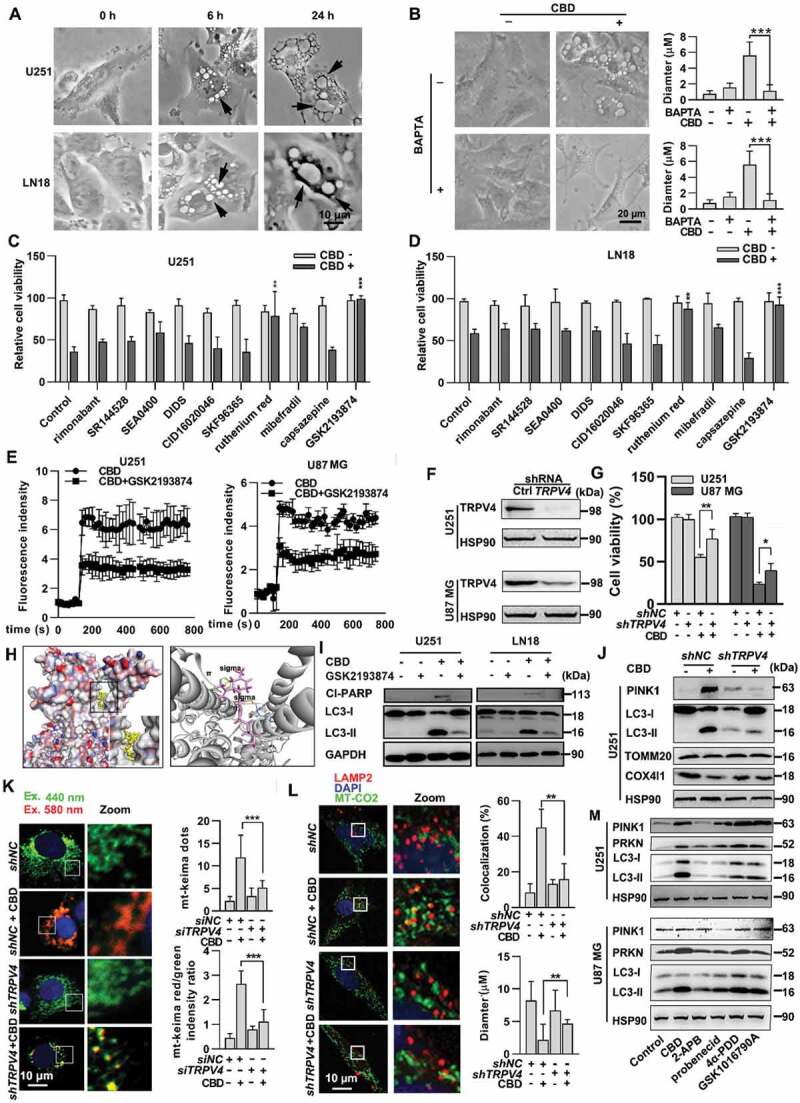
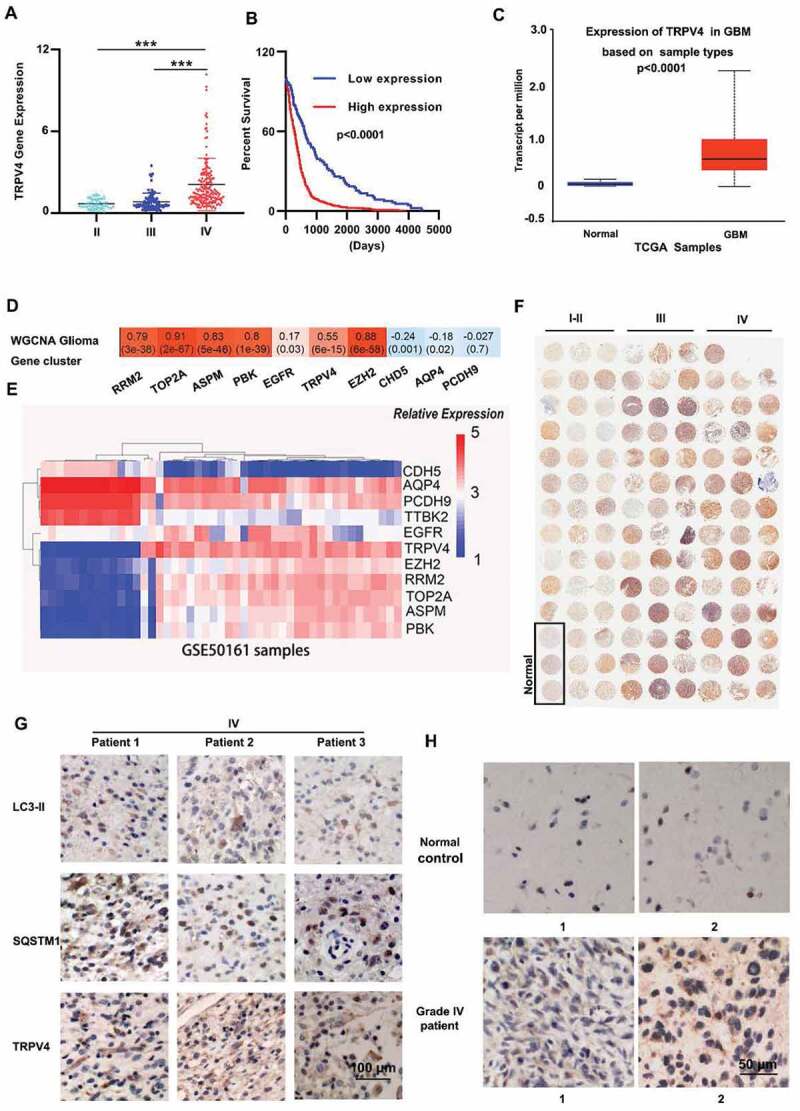
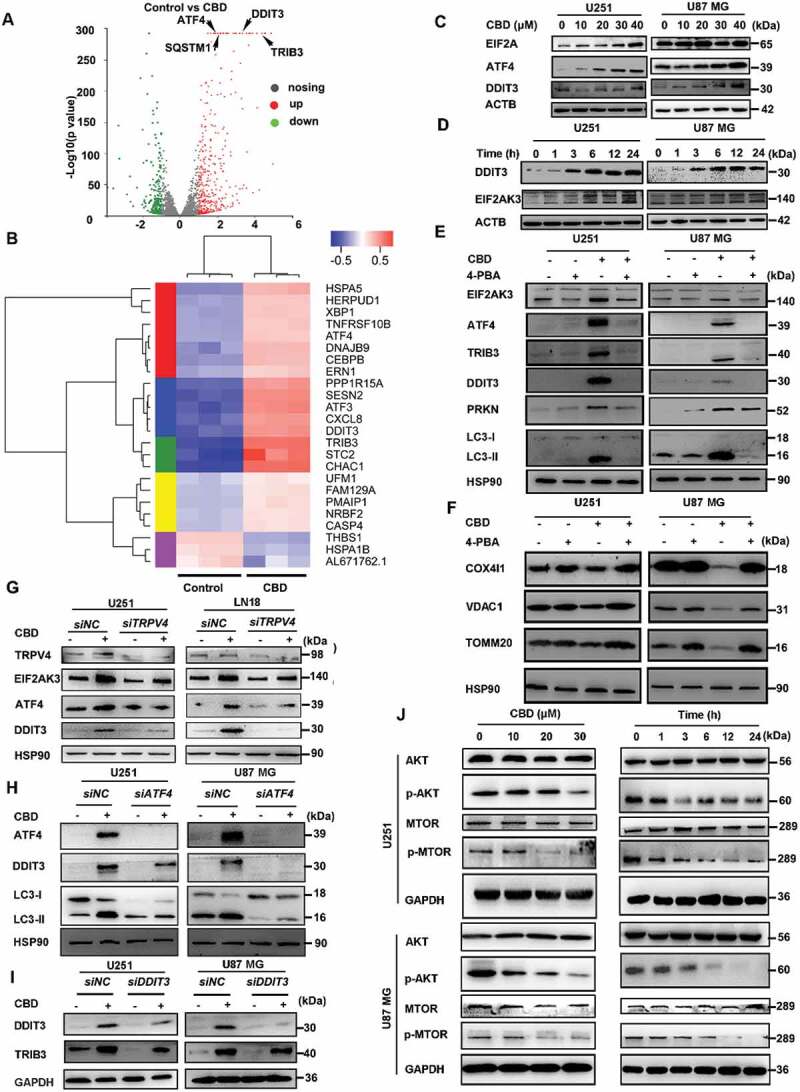
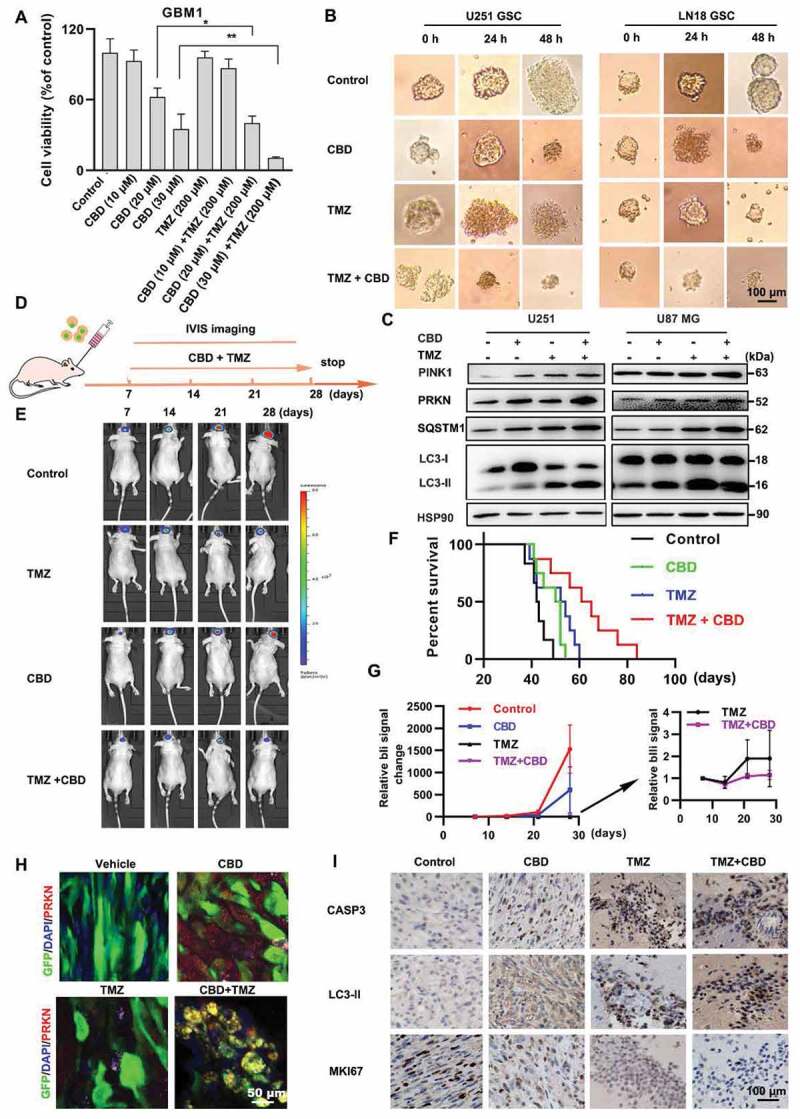
Glioma is the most common primary malignant brain tumor with poor survival and limited therapeutic options. The non-psychoactive phytocannabinoid cannabidiol (CBD) has been shown to be effective against glioma; however, the molecular target and mechanism of action of CBD in glioma are poorly understood. Here we investigated the molecular mechanisms underlying the antitumor effect of CBD in preclinical models of human glioma. Our results showed that CBD induced autophagic rather than apoptotic cell death in glioma cells. We also showed that CBD induced mitochondrial dysfunction and lethal mitophagy arrest, leading to autophagic cell death. Mechanistically, calcium flux induced by CBD through TRPV4 (transient receptor potential cation channel subfamily V member 4) activation played a key role in mitophagy initiation. We further confirmed TRPV4 levels correlated with both tumor grade and poor survival in glioma patients. Transcriptome analysis and other results demonstrated that ER stress and the ATF4-DDIT3-TRIB3-AKT-MTOR axis downstream of TRPV4 were involved in CBD-induced mitophagy in glioma cells. Lastly, CBD and temozolomide combination therapy in patient-derived neurosphere cultures and mouse orthotopic models showed significant synergistic effect in both controlling tumor size and improving survival. Altogether, these findings showed for the first time that the antitumor effect of CBD in glioma is caused by lethal mitophagy and identified TRPV4 as a molecular target and potential biomarker of CBD in glioma. Given the low toxicity and high tolerability of CBD, we therefore propose CBD should be tested clinically for glioma, both alone and in combination with temozolomide.Abbreviations: 4-PBA: 4-phenylbutyrate; AKT: AKT serine/threonine kinase; ATF4: activating transcription factor 4; Baf-A1: bafilomycin A1; CANX: calnexin; CASP3: caspase 3; CAT: catalase; CBD: cannabidiol; CQ: chloroquine; DDIT3: DNA damage inducible transcript 3; ER: endoplasmic reticulum; GBM: glioblastoma multiforme; GFP: green fluorescent protein; MAP1LC3B/LC3B: microtubule associated protein 1 light chain 3 beta; MTOR: mechanistic target of rapamycin kinase; PARP1: poly(ADP-ribose) polymerase; PINK1: PTEN induced kinase 1; PRKN: parkin RBR E3 ubiquitin protein ligase; SLC8A1: solute carrier family 8 member A1; SQSTM1: sequestosome 1; TCGA: The cancer genome atlas; TEM: transmission electron microscopy; TMZ: temozolomide; TRIB3: tribbles pseudokinase 3; TRPC: transient receptor potential cation channel subfamily C; TRPV4: transient receptor potential cation channel subfamily V member 4.

Keywords: Cannabidiol; cannabinoid; glioblastoma; glioma; mitophagy; trpv4.


Conflict of interest statement

No potential conflict of interest was reported by the authors.

Figures

Figure 1.
Figure 1.
CBD induced lethal autophagy in glioma cells. (A) Molecular structure of CBD. (B) Growth inhibition effect of CBD on A172, U87 MG, LN18, U251, U118 MG and primary glia cells. Cell viability was measured by MTT after 72 h of CBD treatment. (C) Effect of CBD treatment on CASP3 cleavage in glioma cells. Cells were treated with 30 µM CBD for different times and subjected to western blotting. (D) Effect of CBD treatment on autophagy related proteins. Cells were treated with 30 µM CBD for different times (left) or different concentrations for 24 h (right); LC3 and ATG5 levels were analyzed by western blotting. (E) Ultrastructural features of LN18 cells treated with 30 µM CBD for 24 h were analyzed by electron microscopy. Arrows indicate autophagosomes. Scale bar: 2 µm. (F) Effect of CBD treatment on SQSTM1 protein levels in glioma cells. Cells were treated with different concentrations of CBD for 24 h; SQSTM1 and LC3 levels were analyzed by western blotting. (G) Effect of autophagy inhibitors CQ and Baf-A1 on CBD-induced growth inhibition in glioma cells. U251 and LN18 cells were treated with CBD (20 μM for 48 h) alone or in combination with Baf-A1 (100 nM) or CQ (20 μM); cell number was determined by MTT. (H-I) Effect of autophagy inhibitors CQ and Baf-A1 on CBD-induced LC3 expression in glioma cells. Cells were pre-treated with CQ or Baf-A1 for 1 h and then treated with 20 µM CBD for another 24 h; LC3 levels were analyzed by western blotting. (J-K) Effect of autophagy inhibitors wortmannin and LY294002 on CBD-induced cell death in glioma cells. Cells were pretreated with wortmannin (20 μM, J) or LY294002 (5 μM, K) for 1 h and then treated with CBD (20 μM) for 48 h, cell viability was determined by MTT. (L) Effect of ATG5 knockdown on CBD-induced cell death in glioma cells. Cells were transfected with control or ATG5 siRNA for 48 h, followed by treatment with 20 μM CBD for another 48 h, cell viability was determined by MTT. Data are shown as mean ± S.D. and are representative of three independent experiments. *P < 0.05; **P < 0.01
Figure 2.
Figure 2.
CBD induced mitochondrial dysfuction and mitophagy in glioma cells. (A) Detection of mitophagy induction using the mt-keima reporter assay in CBD treated glioma cells. U251 cells were first transfected with lentivirus carrying the mitochondria-targeting form of Keima (mt-Keima-COX8) for 48 h followed by 30 µM CBD treatment for another 24 h. The amount of mitchondria in the lysosomal compartment was detected using confocal microscopy. The ratio between red and green fluorescence intensities were quantified and shown to the right; n = 10 cells. (B) Detection of mitophagy induction using the LAMP2-MT-CO2 colocalization assay. U251 cells were treated with 30 µM CBD for 24 h, and the intracellular LAMP2 (red) and MT-CO2 (green) were detected by immunofluorescence. Quantification of LAMP2-MT-CO2 colocalization was performed using 50 randomly selected cells. (C) Representative images of transmission electron microscope showing damaged mitochondria was trapped in autophagosomes after 24 h of 30 µM CBD treatment in U251 cells. Scale bar: 500 nm. (D)Immunoblotting of PINK1 and PRKN in the mitochondrial fraction of glioma cells treated with 30 µM CBD for 24 h. (E) Immunoblotting of SQSTM1 and LC3-II in the cytosolic (Cyto) and mitochondrial (Mito) fractions of glioma cells treated with 30 µM CBD for 24 h. (F) Effect of the mitophagy inhibitor Mdivi-1 on CBD-induced cell death in glioma cells. Cells were pretreated with Mdivi-1 (2.5 μM) for 1 h and then treated with CBD (20 μM) for 48 h, cell viability was determined by the MTT assay. (G-I) Effect of Mdivi-1 on CBD-induced mitophagy in glioma cells. U251 cells were pretreated with mdivi-1 (2.5 μM) for 1 h and then treated with CBD (20 μM) for 24 h. Mitophagy induction was evaluated by both LAMP2-MT-CO2 colocalization (G) and immunoblotting of PINK1, PRKN, LC3, TOMM20, and COX4I1 (H, I). (J) Effect of PINK1 knockdown on CBD-induced mitophagy in glioma cells. U251 cells were transfected with control or PINK1 siRNA for 48 h before treatment with CBD (20 μM) for another 24 h, mitophagy induction was evaluated by both LAMP2-MT-CO2 colocalization. (K) Effect of PINK1 knockdown on CBD-induced cell death in glioma cells. U251 cells were transfected with control or PINK1 siRNA for 48 h before treatment with CBD (20 μM) for another 24 h, cell viability was determined by the MTT assay. (L) Effect of PINK1 knockdown on CBD-induced mitophagy related protein in glioma cells. Cells were treated as in J and levels of PARP, LC3, TOMM20, and COX4I1 were analyzed by western blotting. Data are mean ± S.D. and are representative of three independent experiments. *P < 0.05; **P < 0.01, ***P < 0.001
Figure 3.
Figure 3.
TRPV4 is a potential target of CBD in glioma. (A) Morphological changes in U251 and LN18 cells after treatment with 30 μM of CBD at indicate times. Arrows indicate vacuolation in cells. (B) Effect of the calcium chelator BAPTA on CBD-induced vacuolation in glioma cells. U251 cells were treated with 30 μM CBD for 6 h with or without 10 μM BAPTA (pretreatment for 1 h). Quantification on the number and diameter of vacuoles was performed using 50 cells. (C-D) Effect of various ion channel inhibitors on CBD-induced glioma cell death. U251 or LN18 cells were pretreated with rimonabant (1 μM), SR144528 (1 μM), SEA0400 (10 μM), DIDS (10 μM), CID16020046 (1 μM), SKF96365 (1 μM), RuR (1 μM), mibefradil (2.5 uM), capsazepine (1 μM), or GSK2193874 (5 μM) for 1 h and then treated with CBD (30 μM) for 48 h. Cell viability was determined by the MTT assay. (E) Effect of the TRPV4 inhibitor GSK2193874 on CBD-induced calcium flux in glioma cells. U251 or U87 MG cells were treated with 30 μM CBD with or without GSK2193874; Ca2+ flux was detected by using the Ca2+ indicator Fluro-4AM. (F) Knockdown efficiency of TRPV4 in U251 and U87MG cells was evaluated by western blotting. (G) Effect of TRPV4 knockdown on CBD-induced cell death in glioma cells. Cells with stable TRPV4 knockdown were treated with CBD for 48 h, cell viability was determined by the MTT assay. (H) Molecular docking analysis of the binding between CBD and TRPV4. Left, a homology structure model of TRPV4 in complex with CBD; right, an enlarged snapshot of the proposed binding site in TRPV4, where CBD binds in a hydrophobic pocket located between S5 and S6 helices of adjacent subunits. (I) Effect of TRPV4 inhibitor on CBD-induced mitophagy in glioma cells. U251 or U87 MG cells were treated with 20 μM CBD with or without GSK2193874 pretreatment (5 μM for 1 h), LC3 and Cl-PARP levels were analyzed by western blotting. (J-L) Effect of TRPV4 knockdown on CBD-induced mitophagy in glioma cells. U251 cells stably transfected with shTRPV4 were treated with 30 μM CBD for 24 h. Mitophagy related proteins including PINK1, LC3, TOMM20 and COX4I1 were analyzed by western blotting (J). Mitophagy induction was also evaluated by the mt-Keima reporter assay (K) and LAMP2-MT-CO2 colocalization (L). (M) Effect of TRPV channel agonists on the induction of mitophagy in glioma cells. U251 and U87 MG cells were treated with either 30 μM CBD or different TRPV agonists including 2-APB (20 μM), probenecid (20 μM), 4α-PDD (1.5 μM), or GSK1016790A (2 μM) for 24 h, levels of PINK1, PRKN and LC3 were then analyzed by western blotting. Data are shown as mean ± SD, and are representative of three independent experiments. *P < 0.05; **P < 0.01, ***P < 0.001
Figure 4.
Figure 4.
TRPV4 is a potential biomarker for clinical diagnosis and treatment of glioma. (A-B) Correlation analysis of TRPV4 expression and tumor grade (A) or overall survival (B) in The Cancer Genome Atlas (TCGA) dataset. (C) mRNA expression levels of TRPV4 in GBM samples and paired normal control from the UALCAN database. (D) Correlation analysis between module eigengenes and common markers of glioma. WGCNA results demonstrated that TRPV4 gene was in the Red Module (ME Red). Red represents a positive correlation between ME and the specified glioma associated gene, whereas blue represents a negative correlation. Correlation coefficients were calculated using Pearson correlation with P-values in parentheses. (E) Correlation analysis between TRPV4 and glioma related molecular markers in the GSE50161 dataset. (F) Immunohistochemical determination of TRPV4 expression levels in a commercial tissue array of 126 glioma patients. (G) Representative immunohistochemistry images of the expression of TRPV4, SQSTM1, LC3-II in high-grade glioma patient samples. (H) Differential expression of TRPV4 protein in human GBM samples and normal control samples
Figure 5.
Figure 5.
CBD induces ER stress and mitophagy via the ATF4-DDIT3-TRIB3-AKT1-MTOR axis. (A) Transcriptome analysis of CBD-treated U251 cells. Volcano plot showing the up- and down-regulated genes, in red and green colors, respectively. Cells were treated with 30 μM CBD for 12 h. (B) Clustering analysis of stress-related genes in CBD-treated U251 cells. (C) Immunoblotting of ER stress markers EIF2A, DDIT3 and ATF4 in glioma cells after 24 h treatment with indicated concentrations of CBD. (D) Immunoblotting of DDIT3 and EIF2AK3 in glioma cells treated with 30 μM CBD for indicated times. (E-F) Effect of the ER stress inhibitor 4-PBA on CBD-induced mitophagy. Cells were treated with 20 μM CBD for 24 h with or without pretreatment with 4-PBA (1 mM for 30 min); expression levels of ER stress and mitophagy related proteins were analyzed by western blotting. (G) Effect of TRPV4 knockdown on CBD-induced ER stress. Cells with stable TRPV4 knockdown were treated with 30 μM CBD for 24 h, levels of TRPV4, EIF2AK3, ATF4 and DDIT3 were analyzed by western blotting. (H) Effect of ATF4 knockdown on CBD-induced ER stress and mitophagy. Cells were transfected with control or ATF4 siRNA for 48 h before treatment with CBD for another 24 h, express levels of ATF4, DDIT3, and LC3 were analyzed by western blotting. (I) Effect of DDIT3 knockdown on CBD-induced TRIB3 upregulation. Cells were transfected with control or DDIT3 siRNA for 48 h before treatment with CBD for another 24 h, express levels of DDIT3 and TRIB3 were analyzed by western blotting. (J) Effect of CBD treatment on the AKT-MTOR pathway. Cells were treated with CBD at indicated concentrations and times, expression levels of MTOR, p-MTOR, AKT and p-AKT were analyzed by western blotting. Immunoblots shown are representative of three independent experiments
Figure 6.
Figure 6.
Synergistic effect of CBD and TMZ on glioma in vitro and in vivo. (A) Effect of CBD and TMZ combination on the proliferation of glioma cells in vitro. GBM patient derived primary culture cells were treated with CBD (10, 20 and 30 μM), TMZ (200 μM) or both for 48 h, cell number was determined by the MTT assay. (B) U251 and LN18 glioma sphere culture were treated with CBD (30 μM), TMZ (200 μM) or both for indicated times. (C) Immunoblotting analysis of PINK1, PRKN, LC3, and SQSTM1 in U251 and U87 MG cells treated with CBD (30 μM) in combination with TMZ (500 μM) for 24 h. (D) Scheme of in vivo experiment design. Mice bearing the U87 MG-GFP-luc tumors were treated with control (n = 6), temozolomide (25 mg/kg/once per day, n = 8), CBD (15 mg/kg/once per day, n = 8), or CBD + TMZ (n = 8) for 21 days. IVIS imaging were performed at days 7, 14, 21, 28. (E) Representative bioluminescence images of tumors in mice from control, CBD, TMZ and the combination group 28-day post-transplantation. (F) Kaplan-Meier survival curve of mice in all groups. (G) Quantification of tumor bioluminescence in different treatment arms throughout the course of treatment. (H) Brain tumor tissues were sectioned and subjected to immunofluorescence staining for determination of the expression level of PRKN (red) by confocal microscopy, tumor cells are green because of GFP expression. (I) IHC analysis of MKI67, cleaved-CASP3 and LC3 expression in all groups. Data are shown as mean ± S.D. and are representative of three independent experiments. *P < 0.05, **P < 0.01

References

    1. Aldape K, Brindle KM, Chesler L, et al. Challenges to curing primary brain tumours. Nat Rev Clin Oncol. 2019;16(8):509–520. - PMC - PubMed
    1. Zhou W, Wahl DR.. Metabolic abnormalities in glioblastoma and metabolic strategies to overcome treatment resistance. Cancers (Basel). 2019;11(9):1–26. - PMC - PubMed
    1. Huang Q, Zhan L, Cao H, et al. Increased mitochondrial fission promotes autophagy and hepatocellular carcinoma cell survival through the ROS-modulated coordinated regulation of the NFKB and TP53 pathways. Autophagy. 2016;12(6):999–1014. - PMC - PubMed
    1. Chen R, Jiang M, Li B, et al. The role of autophagy in pulmonary hypertension: a double-edge sword. Apoptosis. 2018;23(9–10):459–469. - PubMed
    1. Elshaer M, Chen Y, Wang X, et al. Resveratrol: an overview of its anti-cancer mechanisms. Life Sci. 2018;207:340–349. - PubMed

Publication types

MeSH terms