. 2021 May 3;218(5):e20201503.
doi: 10.1084/jem.20201503.

NK/ILC1 cells mediate neuroinflammation and brain pathology following congenital CMV infection

Affiliations

NK/ILC1 cells mediate neuroinflammation and brain pathology following congenital CMV infection

Daria Kveštak et al. J Exp Med. .

Abstract

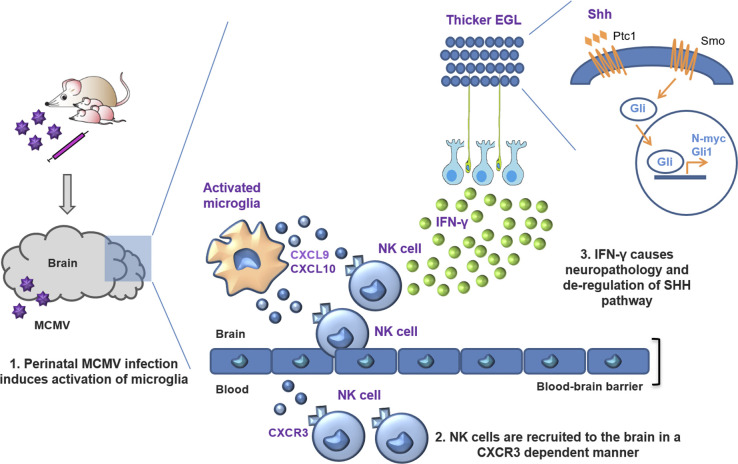
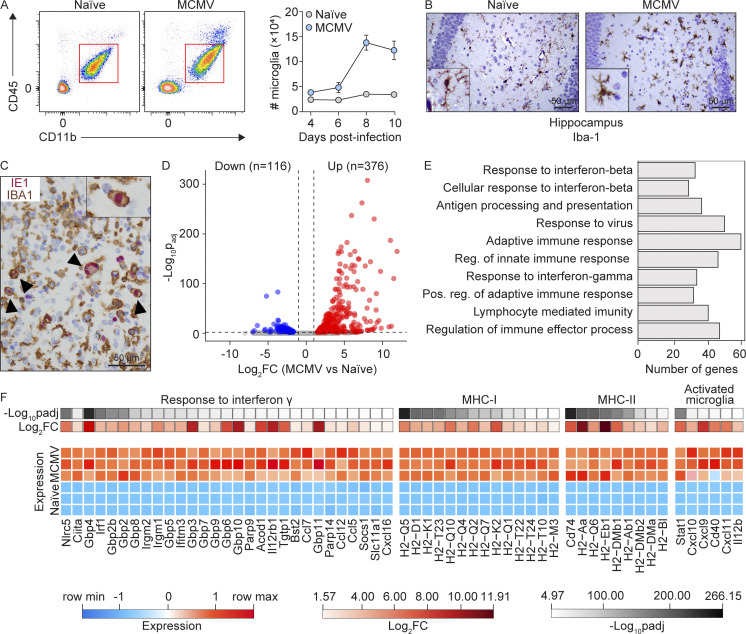
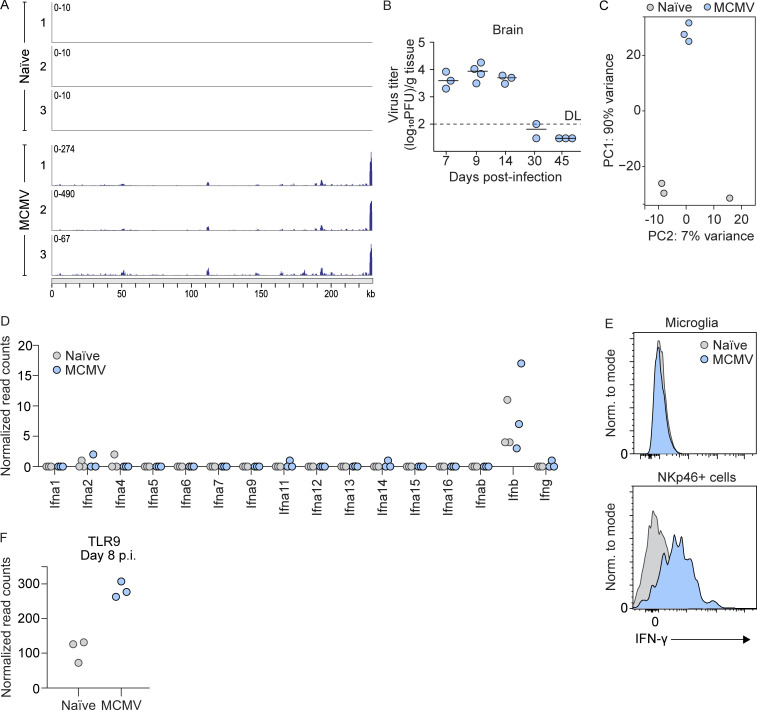
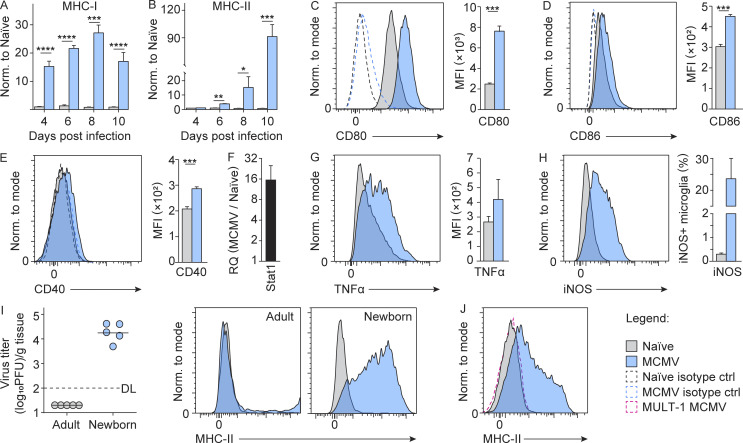
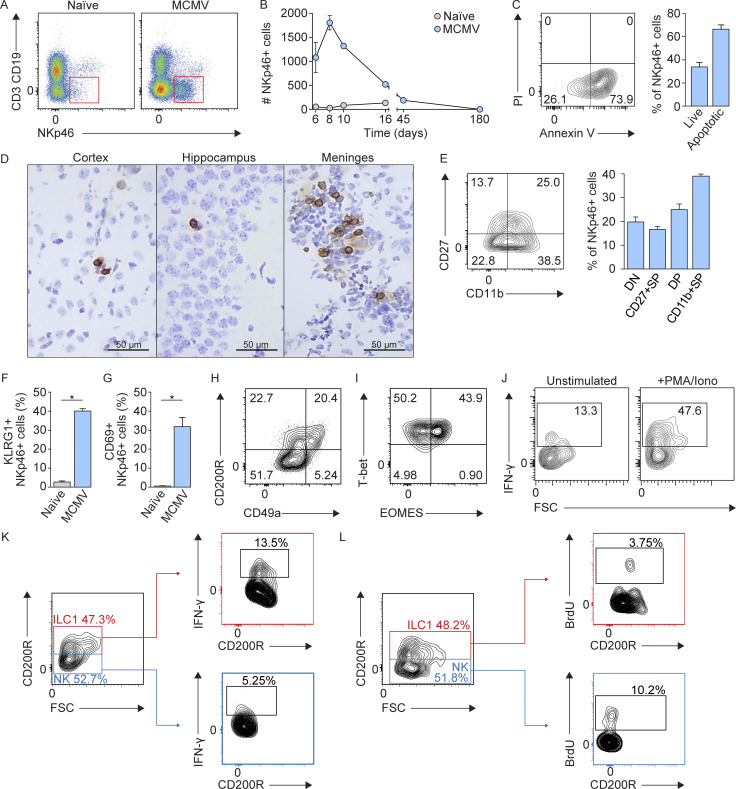
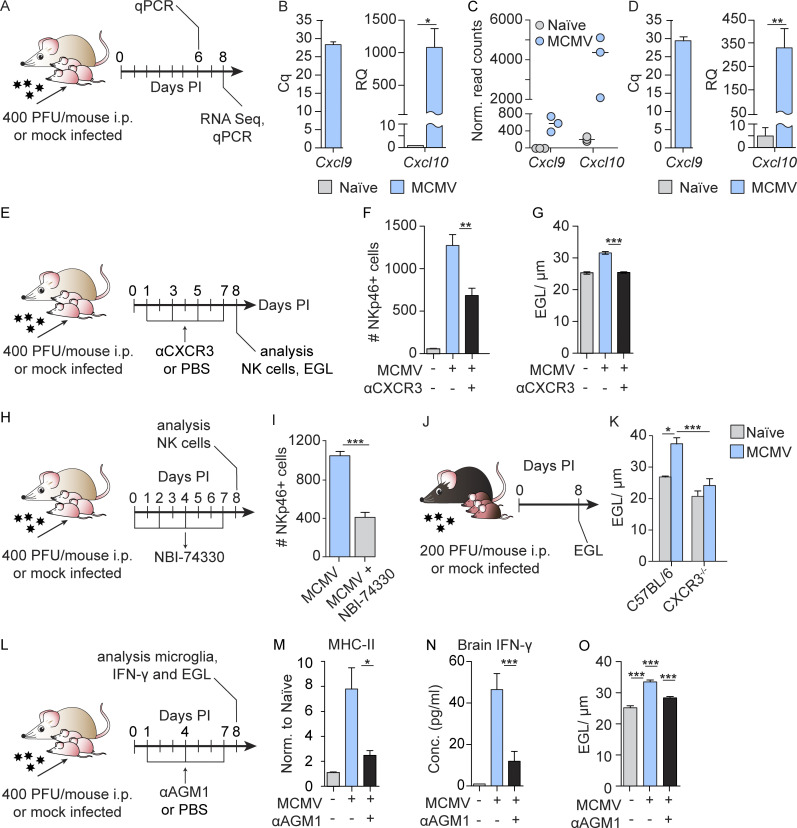
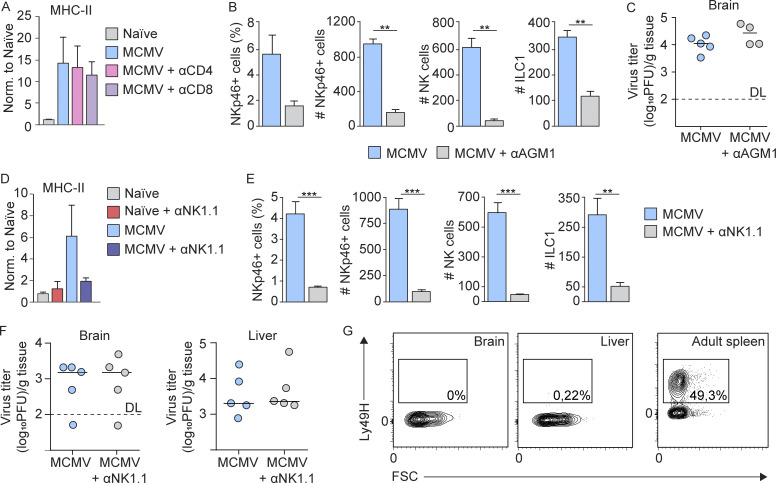
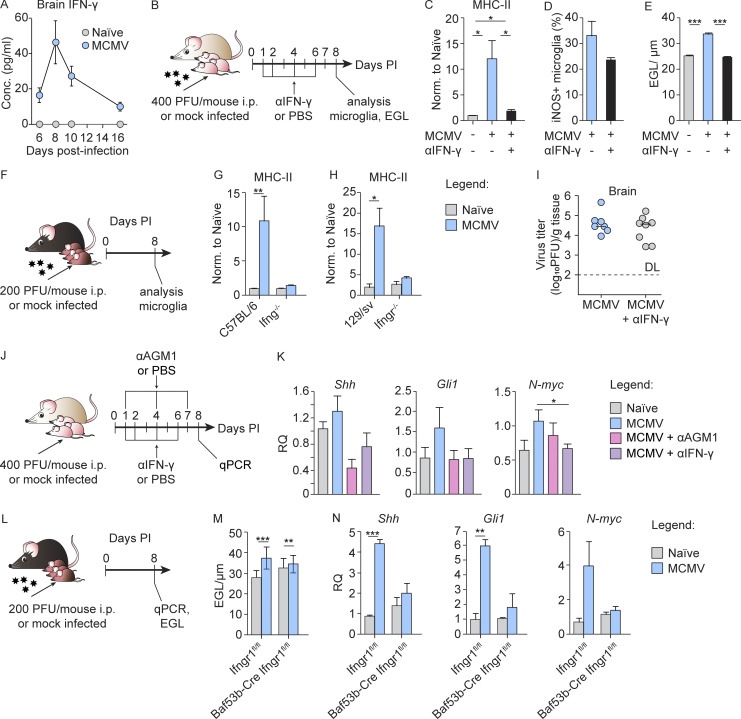
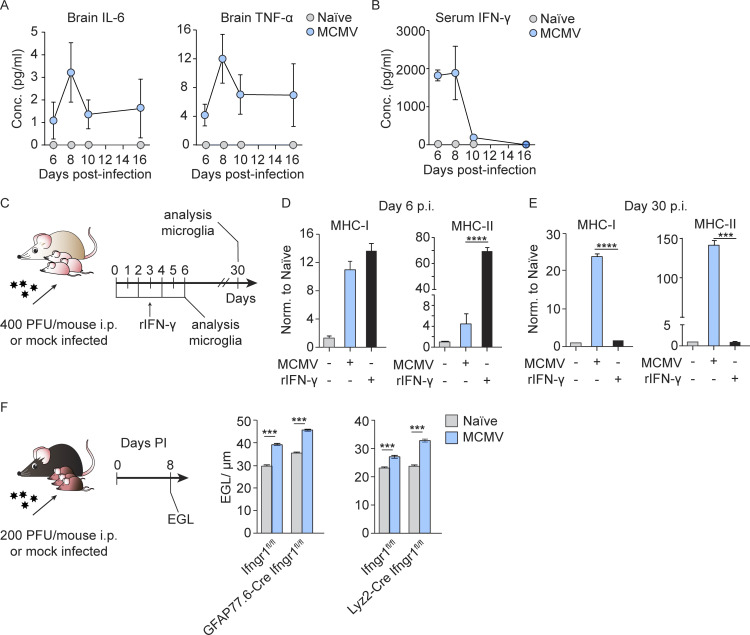
Congenital human cytomegalovirus (cHCMV) infection of the brain is associated with a wide range of neurocognitive sequelae. Using infection of newborn mice with mouse cytomegalovirus (MCMV) as a reliable model that recapitulates many aspects of cHCMV infection, including disseminated infection, CNS infection, altered neurodevelopment, and sensorineural hearing loss, we have previously shown that mitigation of inflammation prevented alterations in cerebellar development, suggesting that host inflammatory factors are key drivers of neurodevelopmental defects. Here, we show that MCMV infection causes a dramatic increase in the expression of the microglia-derived chemokines CXCL9/CXCL10, which recruit NK and ILC1 cells into the brain in a CXCR3-dependent manner. Surprisingly, brain-infiltrating innate immune cells not only were unable to control virus infection in the brain but also orchestrated pathological inflammatory responses, which lead to delays in cerebellar morphogenesis. Our results identify NK and ILC1 cells as the major mediators of immunopathology in response to virus infection in the developing CNS, which can be prevented by anti-IFN-γ antibodies.


Conflict of interest statement

Disclosures: The authors declare no competing interests exist.

Figures

None
Graphical abstract
Figure 1.
Figure 1.
MCMV infection causes substantial alterations in the microglia transcriptome. Newborn BALB/c mice were infected with MCMV. (A) Gating strategy used to define microglia (left). Kinetics of microglia in the brain was analyzed by flow cytometry at indicated time points p.i. (right). Mean values ± SEM are shown (n = 3–6). The data are representative of three independent experiments. (B) IBA-1+ microglia in hippocampus from MCMV-infected and naive mice (n = 5). Scale bars, 50 µm. The data are representative of two independent experiments. (C) Infected microglia were identified with dual staining for IBA-1 (brown) and the intranuclear viral IE1 protein (red). Counterstaining was performed with hematoxylin. Arrowheads point to infected microglia. Scale bar, 50 µm (n = 5). The data are representative of two independent experiments. (D) Volcano plot of DE genes in microglia from MCMV-infected versus microglia from naive mice (n = 3). (E) Gene Ontology overrepresentation analysis showing the top 10 perturbed biological pathways in microglia from infected mice, ranked by padj. padj < 0.01 (n = 3). (F) Heatmap of DE IFN-γ response genes, MHC-I and MHC-II genes, and markers of activated microglia from naive and MCMV-infected mice (n = 3).
Figure S1.
Figure S1.
MCMV infection of microglia and immune response in brain. (A) RNA reads were obtained in RNA-seq experiments of microglia sorted from naive or MCMV-infected newborn mice at day 8 p.i. and were mapped to the MCMV genome (n = 3). (B) Newborn BALB/c mice were infected with MCMV. Brains were collected at the indicated time points p.i., and viral titers were determined. Titers in brain of individual mice are shown (circles); horizontal bars indicate the median values; DL, detection limit (n = 3–4). The data are representative of two independent experiments. (C) Principal-component (PC) analysis of RNA-seq data shown in Fig. 1 and Fig. S1. (D) Expression levels of genes encoding type I and type II IFNs in microglia from RNA-seq data (n = 3). (E) Results of intracellular flow cytometric analysis of IFN-γ production by microglia and NKp46+ cells at day 8 p.i. (n = 3 replicates, with four brains pooled per replicate). The data are representative of two independent experiments. (F) Expression level of TLR9 in microglia from RNA-seq data (n = 3).
Figure 2.
Figure 2.
MCMV infection induces early activation of microglia toward proinflammatory phenotype. (A and B) Newborn BALB/c mice were infected with MCMV. The expression of MHC-I (A) and MHC-II (B) on microglia was analyzed by flow cytometry at indicated time points p.i. Mean values ± SEM are shown (n = 3–6). The data are representative of two or three independent experiments. Unpaired two-tailed Student’s test was used. *, P < 0.05; **, P < 0.01; ***, P < 0.001; ****, P ≤ 0.0001. (C–E) The expression of CD80 (C), CD86 (D), and CD40 (E) on microglia was analyzed by flow cytometry on day 8 p.i. Mean values ± SEM are shown (n = 5). The data are representative of two independent experiments. Unpaired two-tailed Student’s test was used. ***, P < 0.001. Representative histograms showing expression of CD80, CD86, and CD40 are shown (C–E). (F) The expression of Stat1 was determined by qPCR on day 8 p.i. (n = 3). The data are representative of two independent experiments. (G and H) TNF-α (G) and iNOS (H) production on day 8 p.i. was analyzed by flow cytometry (n = 3 replicates, with three brains pooled per replicate). The data are representative of two independent experiments. Unpaired two-tailed Student’s test was used. (I) Newborn and adult BALB/c mice were infected with MCMV. Brains were harvested on day 8 p.i., and the virus titers were determined. Titers in organs of individual mice are shown (circles); horizontal bars indicate the median values; DL, detection limit (left). Representative histograms showing expression of MHC-II on microglia are shown (right; n = 5). The data are representative of two independent experiments. (J) Postnatal day 1 C57BL/6 mice were infected with wild-type MCMV or MULT-1MCMV. Representative histograms showing the expression of MHC-II on microglia are shown (n = 3–5). The data are representative of two independent experiments. MFI, mean fluorescence intensity.
Figure 3.
Figure 3.
Accumulation of NKp46+ cells in brain following MCMV infection. Newborn BALB/c mice were infected with MCMV. (A) Gating strategy used to define NKp46+ cells in the brain at day 8 p.i. (B) Kinetics of brain-infiltrating NKp46+ cells. Mean values ± SEM are shown (n = 3–5). The data are representative of two or three independent experiments. (C) Early apoptosis was analyzed using annexin V-PI staining by flow cytometry (left) at day 8 p.i. Percentages of live and apoptotic NKp46+ cells are shown (right). The data are shown as means ± SEM; n = 3 replicates, with three brains pooled per replicate. The data are representative of two independent experiments. (D) Immunohistochemical staining of NKp46+ cells in the brain of MCMV-infected mice at day 8 p.i. Scale bars, 50 µm. The data are representative of three independent experiments. (E) Analysis of NKp46+ cell maturation in the brain, as assessed by CD11b in combination with CD27. Mean values ± SEM are shown (n = 3–5). The data are representative of three independent experiments. (F and G) Expression of KLRG1 (F) and CD69 (G). Mean values ± SEM are shown (n = 3–5). The data are representative of three independent experiments. Unpaired two-tailed Student`s test was used. *, P < 0.05. (H and I) Representative contour plots of the expression of CD200R and CD49a (H) and EOMES and T-bet (I) are shown (n = 3–5). The data are representative of two independent experiments. (J) Intracellular flow cytometric analysis of IFN-γ production by brain-infiltrating NKp46+ cells (n = 3 replicates, with four brains pooled per replicate), day 8 p.i. The data are representative of three independent experiments. (K) Intracellular flow cytometric analysis of IFN-γ production by NK cells (CD45hiCD3CD19NKp46+CD200R) and ILC1s (CD45hiCD3CD19NKp46+CD200R+; n = 2–3 replicates, with four brains pooled per replicate) at day 8 p.i. The data are representative of two independent experiments. (L) The proliferation of NK cells and ILC1s in the brain following perinatal MCMV infection (n = 5) at day 8 p.i. The data are representative of two independent experiments. FSC, forward scatter; DP, double positive; SP, single positive; Iono, Ionomycin.
Figure 4.
Figure 4.
NK cells are recruited to the brain in CXCR3-dependent manner and induce early activation of microglia and altered cerebellar development. (A) Experimental scheme for B–D. Newborn BALB/c mice were infected with MCMV. (B) Expression of Cxcl9 and Cxcl10 in the cerebella measured by qPCR at day 6 p.i. Mean values ± SEM are shown (n = 3). The data are representative of two independent experiments. Unpaired two-tailed Student`s test was used. *, P < 0.05. Cq, quantification cycle; RQ, relative quantification. (C) Microglia were isolated from whole brains of naive and MCMV-infected newborn mice, and RNA-seq was performed. Expression of Cxcl9 and Cxcl10 in microglia is shown at day 8 p.i. Horizontal bars indicate the median values (n = 3). (D) Expression of Cxcl9 and Cxcl10 in the cerebella measured by qPCR at day 8 p.i. Mean values ± SEM are shown (n = 4). The data are representative of two independent experiments. Unpaired two-tailed Student’s test was used. **, P < 0.01. (E) Experimental scheme for F and G. Newborn BALB/c mice were infected with MCMV and CXCR3 was blocked in vivo by administration of anti-CXCR3 antibodies. (F and G) Number of brain-infiltrating NKp46+ cells (F) and cerebellar EGL measurements (G) are shown. Mean values ± SEM are shown (n = 3–6). The data are representative of two independent experiments. Unpaired two-tailed Student’s test was used. **, P < 0.01; ***, P < 0.001. (H) Experimental scheme for I. Newborn BALB/c mice were infected with MCMV, and CXCR3 was blocked by the administration of the CXCR3 antagonist (NBI-74330). (I) Number of brain-infiltrating NKp46+ cells. Mean values ± SEM are shown (n = 3). The data are representative of two independent experiments. Unpaired two-tailed Student’s test was used. ***, P < 0.001. (J) Experimental scheme for K. (K) Cerebellar EGL measurements from naive and MCMV-infected CXCR3−/− and C57BL/6 mice are shown (n = 6–9). The results of two pooled experiments are shown. Unpaired two-tailed Student’s test was used. *, P < 0.05; ***, P < 0.001. (L) Experimental scheme for M–O. Newborn BALB/c mice were infected with MCMV, and NK cells were depleted. (M–O) Expression of MHC-II on microglia (M), concentration of IFN-γ in brain homogenates after NK cell depletion (N), and cerebellar EGL measurements (O). Mean values ± SEM are shown (n = 3–5). The data are representative of two (N) or three (M and O) independent experiments. Unpaired two-tailed Student’s test was used. *, P < 0.05; ***, P < 0.001.
Figure S2.
Figure S2.
The role of T and NK cells in microglia activation and virus control in brain. (A) CD4 and CD8 T cells are not responsible for early microglia activation. Newborn BALB/c mice were infected with MCMV, and CD4 or CD8 T cells were depleted. Expression of MHC-II on microglia is shown. Mean values ± SEM are shown (n = 4). The data are representative of two independent experiments. Unpaired two-tailed Student’s test was used. (B–G) Depletion of NK cells in mice infected with MCMV did not impact the viral titer in the brain. (B and C) Newborn BALB/c mice were infected with MCMV, and NK cells were depleted. (B) The frequency and number of NKp46+ cells and number of NK cells and ILC1 in the brain on day 8 p.i. are shown. Mean values ± SEM are shown (n = 3). The data are representative of two independent experiments. Unpaired two-tailed Student’s test was used. **, P < 0.01. (C) Brains were collected on day 8 p.i., and viral titers were determined. Titers in brain of individual mice are shown (circles); horizontal bars indicate the median values; DL, detection limit (n = 4–5). The data are representative of two independent experiments. Mann–Whitney (U) test was used. (D–G) Postnatal day 1 C57BL/6 mice were infected with MCMV, and NK cells were depleted (D–F). (D and E) Expression of MHC-II on microglia (D) and the frequency and number of NKp46+ cells and number of NK cells and ILC1s in the brain (E) on day 8 p.i. are shown. Mean values ± SEM are shown (n = 3). The data are representative of two independent experiments. Unpaired two-tailed Student’s test was used. **, P < 0.01; ***, P < 0.001. (F) Brains and liver were collected on day 8 p.i. and viral titers were determined. Titers in brain and liver of individual mice are shown (circles); horizontal bars indicate the median values; DL, detection limit (n = 5). The data are representative of two independent experiments. Mann–Whitney (U) test was used. (G) The flow cytometric analysis of Ly49H expression on NK cells in the brain and liver following perinatal MCMV infection and in the adult spleen are shown (n = 3). The data are representative of two independent experiments.
Figure 5.
Figure 5.
IFN-γ induces early activation of microglia and altered cerebellar development. (A) Newborn BALB/c mice were infected with MCMV. Brains were collected at the indicated time points p.i. The concentration of IFN-γ in brain homogenates is shown. Mean values ± SEM are show (n = 3–6). The data are representative of two independent experiments. (B) Experimental scheme for C–E and I. Newborn BALB/c mice were infected with MCMV and IFN-γ was neutralized in vivo by administration of anti–IFN-γ antibody. (C and D) Expression of MHC-II on microglia (C) and iNOS production (D) on day 8 p.i. were analyzed by flow cytometry. Mean values ± SEM are shown (n = 3–5). The data are representative of two (D) or three (C) independent experiments. Unpaired two-tailed Student’s test was used. *, P < 0.05. (E) Cerebellar EGL measurements. Mean values ± SEM are shown (n = 3–5). The data are representative of three independent experiments. Unpaired two-tailed Student’s test was used. ***, P < 0.001. (F) Experimental scheme for G and H. (G and H) Postnatal day 1 C57BL/6 and Ifng−/− (G) or 129/sv and Ifngr−/− mice (H) were infected with MCMV. Expression of MHC-II on microglia from C57BL/6 and Ifng−/− mice (G) and 129/sv and Ifngr−/− mice (H). Mean values ± SEM are shown (n = 3–5). The data are representative of two independent experiments. Unpaired two-tailed Student’s test was used. *, P < 0.05; **, P < 0.01. (I) Brains were collected on day 8 p.i., and viral titers were determined. Titers in brain of individual mice are shown (circles); horizontal bars indicate the median values; DL, detection limit (n = 5–8). The data are representative of three independent experiments. Mann–Whitney (U) test was used. (J) Experimental scheme for K. Newborn BALB/c mice were infected with MCMV. NK cells were depleted in vivo. IFN-γ was neutralized in vivo by administration of anti–IFN-γ antibody. (K) Expression of Shh, N-myc, and Gli1 in the cerebella measured by qPCR. Mean values ± SEM are show (n = 3–5). The data are representative of two independent experiments. Unpaired two-tailed Student’s test was used. *, P < 0.05. RQ (relative quantification). (L) Experimental scheme for M and N. Postnatal day 1 Baf53b-CreIfngr1flox/flox and Ifngr1flox/flox mice were infected with MCMV. (M) Cerebellar EGL measurements (N) expression of Shh, N-myc, and Gli1 in the cerebella measured by qPCR. Mean values ± SEM are shown (n = 3–5). The data are representative of two independent experiments. Unpaired two-tailed Student’s test was used. **, P < 0.01; ***, P < 0.001.
Figure S3.
Figure S3.
The level and role of cytokines in brain of MCMV infected newborn mice. Newborn BALB/c mice were infected with MCMV or left uninfected. Brains and sera were collected at the indicated time points p.i. and concentration of proinflammatory cytokines was determined. (A and B) Concentration of proinflammatory cytokines in the brain homogenates (A) and sera (B) was determined by CBA kit. Mean values ± SEM are show (n = 3–6). The data are representative of two independent experiments. (C–E) Peripheral IFN-γ can induce the expression of MHC-I and MHC-II on microglia at early days p.i., but the infection is needed for long-term microglia activation. (C) Experimental scheme for D and E. Newborn BALB/c mice were infected with MCMV or left uninfected. Proportion of naive mice was treated with recombinant IFN-γ for 6 d. (D and E) Brain tissue was harvested, and the expression of MHC I and MHC-II on microglia was analyzed on day 6 p.i. (D) and day 30 p.i. (E). Mean values ± SEM are shown (n = 3–5). The data are representative of two independent experiments. Unpaired two-tailed Student’s test was used. ***, P < 0.001; ****, P ≤ 0.0001. (F) Effect of IFN-γ on GFAP and Lyz2-positive cells is not responsible for delay in EGL maturation. Postnatal day 1 GFAP77.6-CreIfngr1flox/flox and Ifngr1flox/flox or Lyz2-CreIfngr1flox/flox and Ifngr1flox/flox mice were infected with MCMV. Cerebellar EGL measurements are shown. Mean values ± SEM are shown (n = 3–5). The data are representative of two independent experiments. Unpaired two-tailed Student’s test was used. ***, P < 0.001.

References

    1. Andrews, S. 2010. FastQC: a quality control tool for high throughput sequence data. https://www.bioinformatics.babraham.ac.uk/projects/fastqc/ (accessed October 5, 2018).
    1. Bantug, G.R., Cekinovic D., Bradford R., Koontz T., Jonjic S., and Britt W.J.. 2008. CD8+ T lymphocytes control murine cytomegalovirus replication in the central nervous system of newborn animals. J. Immunol. 181:2111–2123. 10.4049/jimmunol.181.3.2111 - DOI - PMC - PubMed
    1. Bayona-Bafaluy, M.P., Acín-Pérez R., Mullikin J.C., Park J.S., Moreno-Loshuertos R., Hu P., Pérez-Martos A., Fernández-Silva P., Bai Y., and Enríquez J.A.. 2003. Revisiting the mouse mitochondrial DNA sequence. Nucleic Acids Res. 31:5349–5355. 10.1093/nar/gkg739 - DOI - PMC - PubMed
    1. Blighe, K., Rana S., and Lewis M.. 2020. EnhancedVolcano: Publication-ready volcano plots with enhanced colouring and labeling. R package version 1.6.0. https://github.com/kevinblighe/EnhancedVolcano (accessed November 1, 2019).
    1. Blin, K. 2016. NCBI Genome Downloading Scripts. GitHub Repository. https://github.com/kblin/ncbi-genome-download (accessed September 4, 2019).

Publication types

MeSH terms