. 2022 Jan;47(1):177-189.
doi: 10.1007/s11064-021-03275-4. Epub 2021 Feb 25.

The Role of the Dopamine Transporter in the Effects of Amphetamine on Sleep and Sleep Architecture in Drosophila

Affiliations

The Role of the Dopamine Transporter in the Effects of Amphetamine on Sleep and Sleep Architecture in Drosophila

Caline S Karam et al. Neurochem Res. 2022 Jan.

Abstract

The dopamine transporter (DAT) mediates the inactivation of released dopamine (DA) through its reuptake, and thereby plays an important homeostatic role in dopaminergic neurotransmission. Amphetamines exert their stimulant effects by targeting DAT and inducing the reverse transport of DA, leading to a dramatic increase of extracellular DA. Animal models have proven critical to investigating the molecular and cellular mechanisms underlying transporter function and its modulation by psychostimulants such as amphetamine. Here we establish a behavioral model for amphetamine action using adult Drosophila melanogaster. We use it to characterize the effects of amphetamine on sleep and sleep architecture. Our data show that amphetamine induces hyperactivity and disrupts sleep in a DA-dependent manner. Flies that do not express a functional DAT (dDAT null mutants) have been shown to be hyperactive and to exhibit significantly reduced sleep at baseline. Our data show that, in contrast to its action in control flies, amphetamine decreases the locomotor activity of dDAT null mutants and restores their sleep by modulating distinct aspects of sleep structure. To begin to explore the circuitry involved in the actions of amphetamine on sleep, we also describe the localization of dDAT throughout the fly brain, particularly in neuropils known to regulate sleep. Together, our data establish Drosophila as a robust model for studying the regulatory mechanisms that govern DAT function and psychostimulant action.

Keywords: Adult brain; Behavior; Dopamine transporter localization; Drosophila melanogaster; Genetics; Locomotion; Psychostimulants; Sleep.


Figures

Fig. 1
Fig. 1. Drosophila Activity Monitoring System.
Flies are placed individually in polycarbonate tubes containing food on one side and a cotton plug on the other, and monitored using Drosophila Activity Monitors (DAMs). Each monitor is capable of recording up to 32 animals simultaneously. Monitors are housed in a designated behavior chamber under 12 h light:dark conditions at 25°C and ~50% humidity. Locomotor activity is measured by recording crossings through an infrared (IR) beam at the center of the tube. Data collection is automated via the DAMSystem software, and output files are analyzed in R using the Rethomics framework[87].
Fig. 2
Fig. 2. AMPH induces hyperactivity in an isogenic fly strain but ameliorates hyperactivity in dDAT null mutants.
(a-c) Activity profiles upon exposure to Vehicle, 5 mM AMPH or 10 mM AMPH for (a) w1118 (control, n = 60, 40, 54), (b) TH-deficient (TH-def, n = 18, 22, 22), or (c) dDAT null (n = 24, 16, 17) flies. Profiles represent the first 48 h of data collection in 12:12 h light:dark (LD) conditions. Night and day are depicted by black and white bars, respectively. Shaded area around the mean indicates a 95% confidence interval (CI). (d) Baseline activity profiles for control, TH-def, and dDAT null flies (n= 60, 18, 24) exposed to vehicle. Profiles represent the first 48 h of data collection in LD conditions. Night and day are depicted by the black and white bars, respectively. Shaded area around the mean indicates a 95% CI. (e-f) Mean baseline and AMPH-induced activity during (e) the first two nights of recording (0 – 12 h and 24 – 36 h) and (f) the first two days of recording (12 – 24 h and 36 – 48 h) for individual flies of each genotype, indicated by dots. Box plot signifies upper and lower quartiles, and the center line indicates the median. Asterisks indicate significance, Mann-Whitney-Wilcoxon, ****p <0.0001, ***p <0.001, **p < 0.01, *p <0.05, ns = not significant (compared to Vehicle).
Fig. 3
Fig. 3. AMPH inhibits sleep in an isogenic fly strain but restores it in dDAT null mutants.
(a-c) Sleep profiles upon exposure to Vehicle, 5 mM AMPH or 10 mM AMPH for (a) w1118 (control, n = 60, 40, 54), (b) TH-deficient (TH-def) (n = 18, 22, 22), or (c) dDAT null (n = 24, 16, 17) flies. Profiles represent the first 48 h of recording during LD conditions. Night and day are depicted by black and white bars, respectively. Shaded area around the mean indicates a 95% CI. (d) Baseline sleep profiles for control, TH-def, and dDAT null flies (n= 60, 18, 24) exposed to vehicle. Profiles represent the first 48 h of data collection in LD conditions. Night and day are depicted by the black and white bars, respectively. Shaded area around the mean indicates a 95% CI. (e-f) Mean baseline and AMPH-induced changes in sleep fractions during (e) the first two nights of recording (0 – 12 h and 24 – 36 h) and (f) the first two days of recording (12 – 24 h and 36 – 48 h) for individual flies of each genotype indicated by dots. Box plot signifies upper and lower quartiles, and the center line indicates the median. Asterisks indicate significance, Mann-Whitney-Wilcoxon, ****p <0.0001, ***p <0.001, **p < 0.01, *p <0.05, ns = not significant (compared to Vehicle).
Fig. 4
Fig. 4. Modulation of sleep structure by AMPH in the presence or absence of dDAT.
(a) Mean sleep latency, (b) mean sleep bout length, and (c) mean number of sleep bouts at baseline and after treatment with AMPH (5 or 10 mM) for the first two nights (0 – 12 h and 24 – 36 h) for control, TH-def, and dDAT null flies. Individual flies indicated by dots. Box plot signifies upper and lower quartiles, and the center line indicates the median. In (b) for average sleep bout length, outliers (n = 5) with sleep bouts beyond 150 min are not shown, but were included in the generation of box plots and statistical analysis. Asterisks indicate significance, Mann-Whitney-Wilcoxon, ****p <0.0001, ***p <0.001, **p < 0.01, *p <0.05, ns = not significant (compared to Vehicle).
Fig. 5
Fig. 5. Expression pattern of dDAT in the adult Drosophila brain.
(a) Schematic demonstrating DA neuron clusters in the anterior (PAL and PAM) and posterior (PPM1/2, PPM3, PPL1, PPL2ab, PPL2c) regions of the adult fly brain along with their major axonal projections to the mushroom body lobes (MB, blue), fan-shaped body (FB, green), and calyx (gray). (b-c) Whole-mount adult brain immunostaining of (b) the isogenic strain w1118 and (c) dDAT null flies using anti-dDAT antibody (green). (b) w1118 brains show prominent staining in the MB, FB, and other neuropils innervated by DA neurons. (c) dDAT null brains lack anti-dDAT staining, confirming the specificity of the antibody. Maximum intensity projections through the whole brain are shown. Scale bars are 50 μm.
Fig. 6
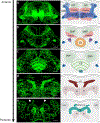
Fig. 6. Localization of dDAT in distinct neuropils of the adult Drosophila brain.
(a-e) Anterior to posterior maximum intensity projections of whole-mount brain showing anti-dDAT immunostaining (green) in the (a) mushroom body lobes, (b) ellipsoid body, (c) fan-shaped body, (d) antlers, (e) protocerebral bridge. Arrowheads indicate anti-dDAT staining in PPM1/2 DA cell bodies (refer to Supplementary Fig. 1 for higher magnification image). Schematics show neuropils with dDAT innervation. MB: mushroom body, P: peduncle, SMP: superior medial protocerebrum, EB: ellipsoid body, FB: fan-shaped body, NO: paired noduli, ATL: antlers, IB: inferior bridge, IC: inferior clamp, PB: protocerebral bridge. Scale bars are 25 μm.

Similar articles

Cited by

References

    1. Aggarwal S, Mortensen OV (2017) Overview of monoamine transporters. Curr Protoc Pharmacol 79:12.16.1–12.16.17. doi: 10.1002/cpph.32 - DOI - PMC - PubMed
    1. Hovde MJ, Larson GH, Vaughan RA, Foster JD (2019) Model systems for analysis of dopamine transporter function and regulation. Neurochem Int 123:13–21. doi: 10.1016/j.neuint.2018.08.015 - DOI - PMC - PubMed
    1. Iversen SD, Iversen LL (2007) Dopamine: 50 years in perspective. Trends Neurosci 30:188–193. doi: 10.1016/j.tins.2007.03.002 - DOI - PubMed
    1. Sulzer D (2011) How addictive drugs disrupt presynaptic dopamine neurotransmission. Neuron 69:628–649. doi: 10.1016/j.neuron.2011.02.010 - DOI - PMC - PubMed
    1. Sulzer D, Sonders MS, Poulsen NW, Galli A (2005) Mechanisms of neurotransmitter release by amphetamines: a review. Prog Neurobiol 75:406–433. doi: 10.1016/j.pneurobio.2005.04.003 - DOI - PubMed

Substances

LinkOut - more resources