

Calcium flux control by Pacs1-Wdr37 promotes lymphocyte quiescence and lymphoproliferative diseases
- PMID: 33630350
- PMCID: PMC8090855
- DOI: 10.15252/embj.2020104888
Calcium flux control by Pacs1-Wdr37 promotes lymphocyte quiescence and lymphoproliferative diseases
Abstract
Endoplasmic reticulum (ER) calcium (Ca2+ ) stores are critical to proteostasis, intracellular signaling, and cellular bioenergetics. Through forward genetic screening in mice, we identified two members of a new complex, Pacs1 and Wdr37, which are required for normal ER Ca2+ handling in lymphocytes. Deletion of Pacs1 or Wdr37 caused peripheral lymphopenia that was linked to blunted Ca2+ release from the ER after antigen receptor stimulation. Pacs1-deficient cells showed diminished inositol triphosphate receptor expression together with increased ER and oxidative stress. Mature Pacs1-/- B cells proliferated and died in vivo under lymphocyte replete conditions, indicating spontaneous loss of cellular quiescence. Disruption of Pacs1-Wdr37 did not diminish adaptive immune responses, but potently suppressed lymphoproliferative disease models by forcing loss of quiescence. Thus, Pacs1-Wdr37 plays a critical role in stabilizing lymphocyte populations through ER Ca2+ handling and presents a new target for lymphoproliferative disease therapy.
Keywords: Pacs1; Wdr37; calcium homeostasis; lymphocyte quiescence; lymphoproliferative disease.
© 2021 The Authors.
Conflict of interest statement
The authors declare they have no conflicts of interest.
Figures
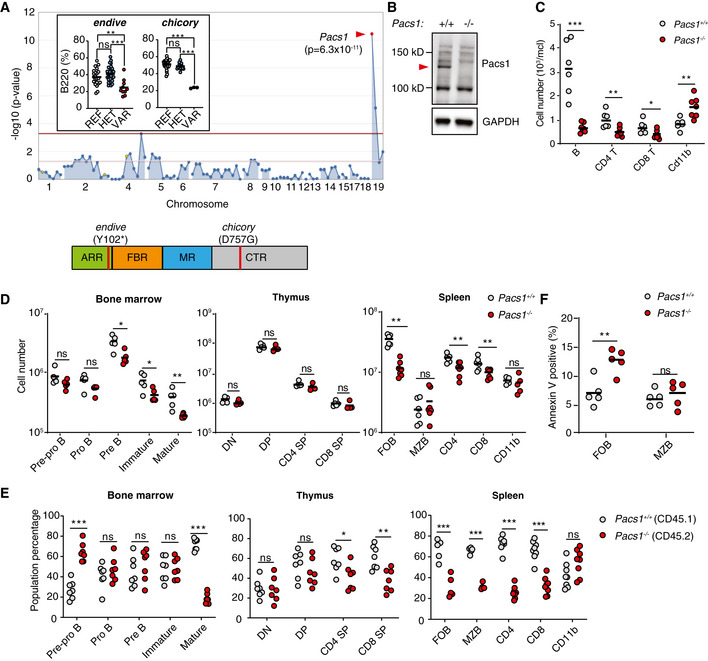
Super‐pedigree mapping of two mutations in Pacs1 that were linked to peripheral B‐cell deficiency. Insert shows peripheral B cell deficiency in the endive (N = 22 REF, 28 HET, 10 VAR) and chicory (N = 24 REF, 15 HET, 3 VAR) pedigrees. Horizontal bars indicate mean values. Ordinary one‐way ANOVA with Tukey’s multiple comparisons test, ns = not significant, **P < 0.01, and ***P < 0.001. Protein domain model shows the encoded location of the ENU alleles.
A 1 bp insertion in Pacs1 using CRISPR/Cas9 leads to loss of Pacs1 protein (red arrowhead).
Peripheral blood immune cell counts from Pacs1 +/+ and Pacs1 −/− mice. Horizontal bars indicate mean values. Two‐tailed unpaired t test, *P < 0.05, **P < 0.01, and ***P < 0.001.
Absolute numbers of lymphocyte subpopulations in the bone marrow, thymus, and spleen. B cell development in the bone marrow was assessed by FACS analysis for surface expression of: B220+CD43+CD19−IgM−IgD− (pre‐pro B); B220+CD43+CD19+IgM−IgD− (pro B); B220+CD43−CD19+IgM−IgD− (pre B); CD19+IgM+IgD− (immature); CD19+IgM+IgD+ (mature). T cell development in the thymus was assessed by FACS analysis for surface expression of: CD4−CD8− (double negative, DN); CD4+CD8+ (double positive, DP); CD4+CD8− (CD4 single positive, SP); CD4−CD8+ (CD8 SP). Splenocytes were assessed by FACS analysis for surface expression of: B220+CD21+CD23+ (follicular B cells, FOB); B220+CD21+CD23low (marginal zone B cells, MZB); CD4+ and CD8+ T cells; CD11b+ myeloid cells. Each symbol represents an individual mouse. Horizontal bars indicate mean values. Two‐tailed Mann–Whitney test, ns = not significant, *P < 0.05, and **P < 0.01.
Proportion of cell populations derived from Pacs1 +/+ ; CD45.1 and Pacs1 −/− ; CD45.2 donors during competitive bone marrow reconstitution. Populations were determined based on the same markers as in (D) with the added congenic markers CD45.1 and CD45.2. Each symbol represents an individual recipient. Results are representative of two independent transplant experiments. Two‐tailed unpaired t test, ns = not significant, *P < 0.05, **P < 0.01, and ***P < 0.001.
Measurement of cell death with Annexin V staining in FOB and MZB cells from the spleens of Pacs1 +/+ and Pacs1 −/− mice. Results are representative of two independent experiments. Horizontal bars indicate mean values. Two‐tailed unpaired t test, ns = not significant, **P < 0.01.
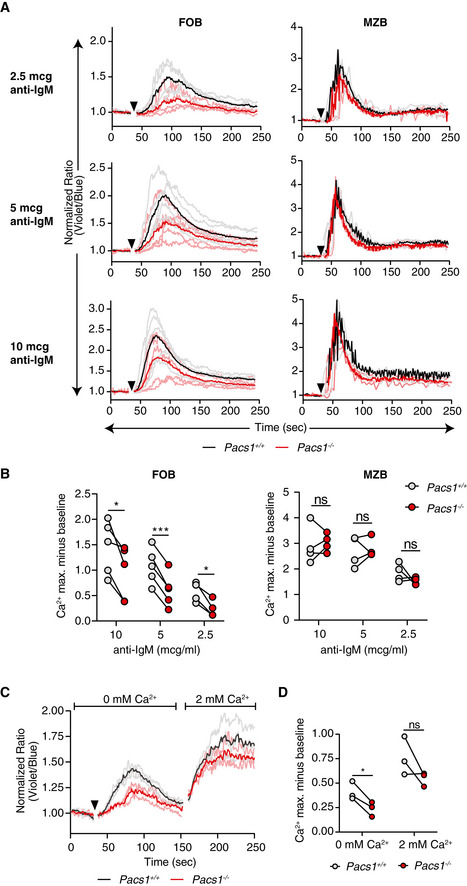
Pacs1 +/+ and Pacs1 −/− splenocytes were labeled with Indo‐1 and stained for B220, CD21, and CD23 to identify FOB and MZB cells. Fluorescence was measured for 30 s to establish a baseline, and then cells were stimulated with the indicated amounts of anti‐IgM (black arrowhead). Cytosolic Ca2+ flux was monitored with FACS analysis by measuring the violet:blue fluorescence emission ratio of Indo‐1. Kinetic traces are displayed from five independent Pacs1 +/+ and Pacs1 −/− pairs and were normalized to baseline (Pacs1 +/+ gray traces, Pacs1 −/− pink traces). The mean Ca2+ flux for each genotype is overlaid in bold (Pacs1 +/+ black, Pacs1 −/− red).
Maximum Ca2+ flux (peak height) at each anti‐IgM concentration for FOB and MZB cells. Paired t test, ns = not significant, *P < 0.05, and ***P < 0.001.
Pacs1 +/+ and Pacs1 −/− FOB cells were labeled with Indo‐1 and stimulated in Ca2+ free buffer with 5 µg/ml anti‐IgM (black arrowhead) to assess ER Ca2+ efflux. Then, 2 mM Ca2+ was added back to assess SOCE. Kinetic traces normalized to baseline from three independent Pacs1 +/+ and Pacs1 −/− pairs are shown with the mean Ca2+ flux overlaid in bold.
Maximum Ca2+ flux after stimulation under Ca2+ free conditions and after Ca2+ was added back. Two‐tailed paired t test, ns = not significant, *P < 0.05.
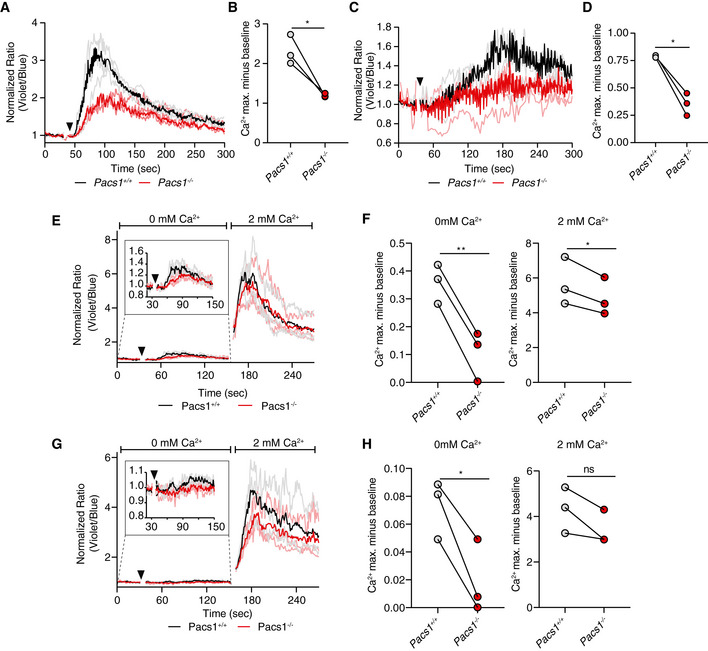
- A
Splenocytes from Pacs1 +/+ and Pacs1 −/− mice were stained for CD8 and labeled with Indo‐1. Cells were then stimulated with 10 µg anti‐CD3 (black arrowhead). Cytosolic Ca2+ flux was monitored by FACS analysis. Kinetic traces are displayed from three independent Pacs1 +/+ and Pacs1 −/− pairs and were normalized to baseline (Pacs1 +/+ gray traces, Pacs1 −/− pink traces). The mean Ca2+ flux for each genotype is overlaid in bold (Pacs1 +/+ black, Pacs1 −/− red).
- B
Maximum Ca2+ flux in CD8 T cells after anti‐CD3 stimulation. Symbols represent independent pairs of mice. Two‐tailed paired t test, *P < 0.05.
- C
Splenocytes from Pacs1 +/+ and Pacs1 −/− mice were also stained for CD4 during same experiments as (A) and stimulated with 10 µg anti‐CD3 (black arrowhead). Kinetic traces are displayed from three independent Pacs1 +/+ and Pacs1 −/− pairs and were normalized to baseline (Pacs1 +/+ gray traces, Pacs1 −/− pink traces). The mean Ca2+ flux for each genotype is overlaid in bold (Pacs1 +/+ black, Pacs1 −/− red).
- D
Maximum Ca2+ flux in CD4 T cells after anti‐CD3 stimulation. Symbols represent independent pairs of mice. Two‐tailed paired t test, *P < 0.05.
- E, G
Stimulation of (E) CD8 and (G) CD4 T cells with 10 µg anti‐CD3 under Ca2+‐free conditions (black arrowhead) followed by addition of 2 mM Ca2+.
- F, H
Peak of Ca2+ flux in (F) CD8 and (H) CD4 T cells under Ca2+‐free conditions and after addition of 2 mM Ca2+. Symbols represent independent pairs of mice. Two‐tailed paired t test, ns = not significant, *P < 0.05, **P < 0.01.
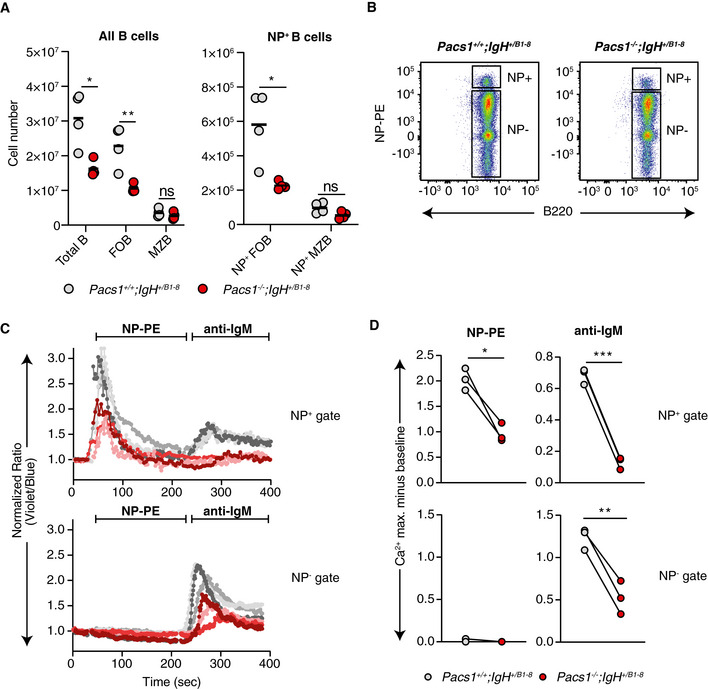
Total number of splenic B cell subpopulations in Pacs1 +/+ and Pacs1 −/− mice expressing the NP‐specific B1‐8 heavy chain. Symbols represent individual mice. Horizontal bars indicate mean values. Two‐tailed unpaired t test, ns = not significant, *P < 0.05, **P < 0.01.
Identification of NP‐specific FOB cells in spleens from Pacs1 +/+ ; IgHB1‐8 /+ and Pacs1 −/− ; IgHB1‐8 /+ mice using NP‐PE.
Ca2+ flux kinetic traces within the NP+ and NP− gates after treatment with NP‐PE and then with anti‐IgM from three independent experiments (Pacs1 +/+ ; IgHB1‐8 /+ are gray traces, Pacs1 −/− ; IgHB1‐8 /+ are red/pink traces). Traces are normalized to baseline.
Maximum Ca2+ flux after each stimulation within the NP+ and NP− gates. Symbols represent independent pairs of mice. Two‐tailed paired t test, *P < 0.05, **P < 0.01, ***P < 0.001.
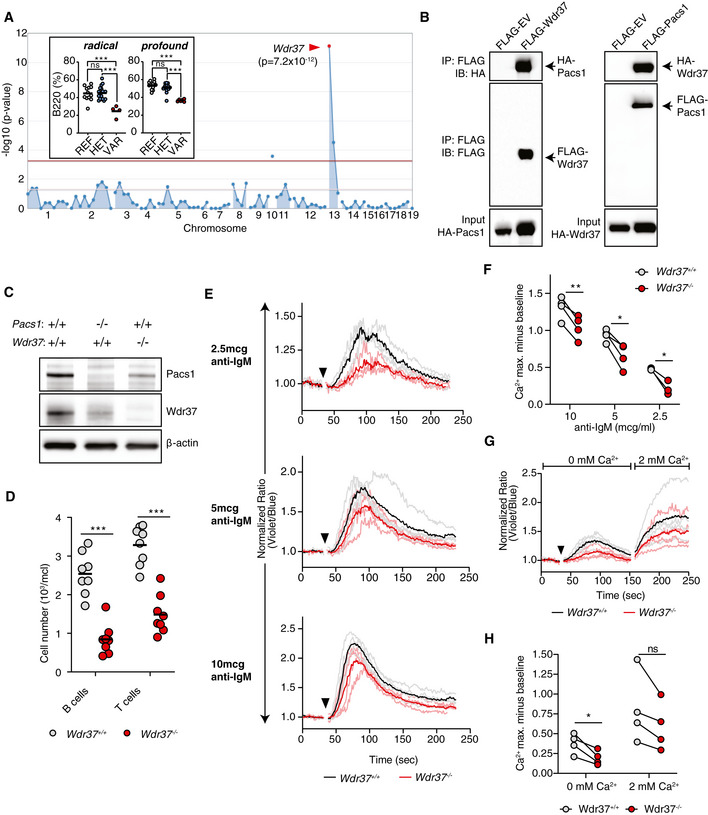
Super‐pedigree mapping of two mutations in Wdr37 that are linked to peripheral B cell deficiency. Insert shows peripheral B cell deficiency in radical (N = 12 REF, 18 HET, 4 VAR) and profound (N = 14 REF, 15 HET, 6 VAR) pedigrees. Horizontal bars indicate mean values. Ordinary one‐way ANOVA with Tukey’s multiple comparisons test, ns = not significant, ***P < 0.001.
Co‐immunoprecipitation of HA‐tagged Pacs1 by FLAG‐Wdr37 and HA‐Wdr37 by FLAG‐Pacs1 in co‐transfected 293T cells. EV, empty vector.
Western blot for Pacs1 and Wdr37 expression in peripheral blood cells from WT, Pacs1 −/−, and Wdr37 −/− mice.
B and T cell peripheral blood counts in Wdr37 −/− mice. Horizontal bars indicate mean values. Two‐tailed unpaired t test, ***P < 0.001.
Wdr37 +/+ and Wdr37 −/− splenocytes were labeled with Indo‐1, stained for cell surface markers to identify FOB cells, and stimulated with the indicated amounts of anti‐IgM (black arrowhead). Normalized traces from three (2.5 µg/ml anti‐IgM) or four independent experiments (10 and 5 µg/ml anti‐IgM) are shown (Wdr37 +/+ gray, Wdr37 −/− pink). Mean Ca2+ flux for each genotype is overlaid in bold (Wdr37 +/+ black, Wdr37 −/− red).
Maximum Ca2+ flux at each anti‐IgM concentration is shown. Two‐tailed paired t test, *P < 0.05, **P < 0.01.
Wdr37 +/+ and Wdr37 −/− FOB cells were labeled with Indo‐1 and stimulated in Ca2+ free buffer with 5 µg/ml anti‐IgM (black arrowhead) followed by addition of 2 mM Ca2+. Normalized traces from four independent experiments are shown with mean Ca2+ flux overlaid in bold.
Maximum Ca2+ flux after stimulation under Ca2+ free conditions and after Ca2+ was added back. Two‐tailed paired t test, ns = not significant, *P < 0.05.
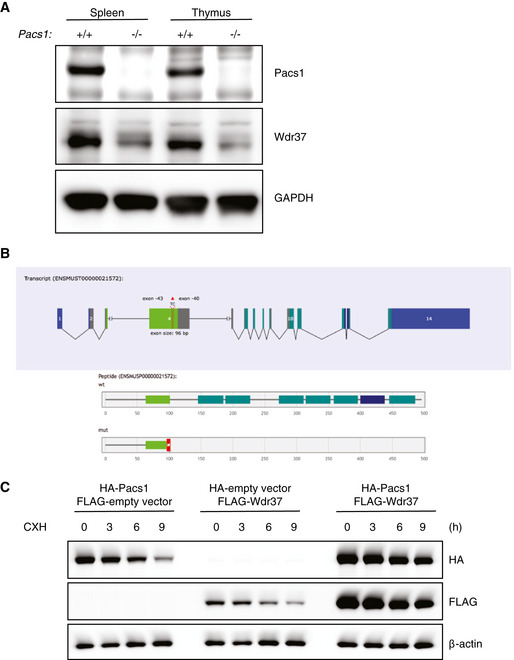
Immunoblot analysis of Pacs1‐dependent Wdr37 expression in lymphoid tissues from Pacs1 +/+ and Pacs1 −/− mice.
Gene model for 2 bp deletion from exon 4 of Wdr37 using CRISPR/Cas9 to generate Wdr37 −/− mice.
Immunoblot analysis of epitope‐tagged Pacs1 and Wdr37 in 293T cells expressing the indicated proteins after CXH treatment.
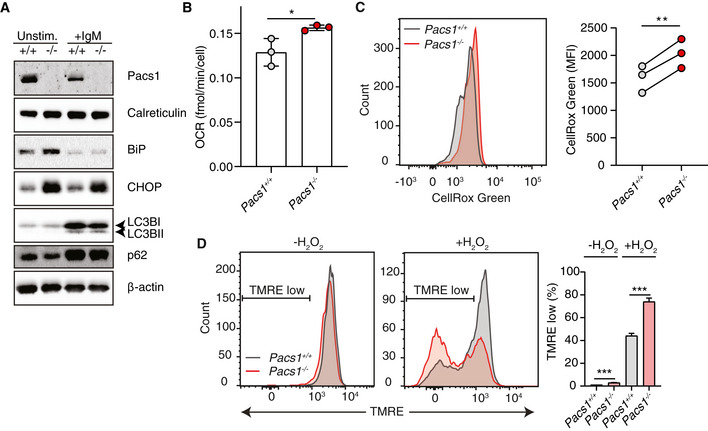
Immunoblot of ER mass, ER stress, and autophagy markers in Pacs1 +/+ and Pacs1 −/− splenic B cells that were left unstimulated or stimulated overnight with 5 µg/ml IgM.
B cells were purified from Pacs1 +/+ and Pacs1 −/− spleens and OCR was measured using a Seahorse metabolic flux analyzer. OCR after rotenone/Antimycin A treatment was subtracted from baseline OCR to give basal mitochondrial respiratory rate. Data shown are the mean of 7–10 technical replicates from three independent experiments. Error bars indicate mean ± SD. Two‐tailed unpaired t test, *P < 0.05.
Determination of cellular ROS in Pacs1 +/+ and Pacs1 −/− FOB cells with CellRox Green analysis by flow cytometry. Quantification shows the mean fluorescence intensity (MFI) from three separate pairs of Pacs1 +/+ and Pacs1 −/− mice. Two‐tailed paired t test, **P < 0.01.
Splenocytes from Pacs1 +/+ and Pacs1 −/− mice were stained with cell surface antibodies to identify FOB cells and treated with 100 µM H2O2 for 35 min. Cells were then labelled with TMRE to monitor MMP by FACS analysis. Low TMRE fluorescence indicated susceptibility to H2O2 treatment. Data are presented as mean ± SD of 3–4 replicates, two‐tailed unpaired t test, ***P < 0.001. Results are representative of three independent experiments performed on different Pacs1 +/+ and Pacs1 −/− pairs.
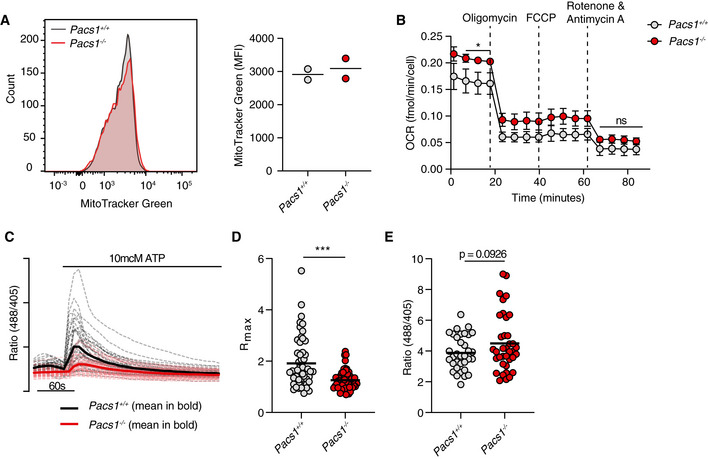
Pacs1 +/+ and Pacs1 −/− splenocytes were stained to identify FOB cells then labeled with MitoTracker Green. Histogram shows representative intensity of MitoTracker fluorescence in FOB cells. Quantification shows the results of two pairs of Pacs1 +/+ and Pacs1 −/− mice. Each symbol represents the mean value from three technical replicates. Horizontal bars indicate mean values from the combined experiments.
Mitochondrial stress test of purified Pacs1 +/+ and Pacs1 −/− B cells. Symbols represent the mean of three independent experiments each with 7‐10 technical replicates. Error bars show SD between the combined experiments. Two‐tailed unpaired t test. *P < 0.05, ns = not significant.
Pacs1 +/+ and Pacs1 −/− NIH‐3T3 cells were infected with MSCV‐Mito‐Pericam. Mitochondrial Ca2+ flux was measured before and after treatment with 10 µM ATP with live cell imaging using the 488/405 nm excitation ratio. Each line shows the kinetic trace of an individual cell (Pacs1 +/+ gray, Pacs1 −/− pink) with the mean overlaid in bold (Pacs1 +/+ black, Pacs1 −/− red). N = 52 cells each for 3T3 and Pacs1 −/−. Results are representative of two independent experiments.
Maximum mitochondrial Ca2+ flux from the cells imaged in panel C. Symbols represent individual cells. Horizontal bars indicate mean values. Two‐tailed Mann–Whitney test, ***P < 0.001.
Pacs1 +/+ and Pacs1 −/− NIH‐3T3 cells were transfected with 2mtGCaMP6m and basal mitochondria Ca2+ content was measured. Symbols represent individual cells. N = 34 cells (3T3) and 37 cells (Pacs1 −/−). Results are combined from two independent experiments. Horizontal bars indicate mean values. Two‐tailed unpaired t test with Welch’s correction.
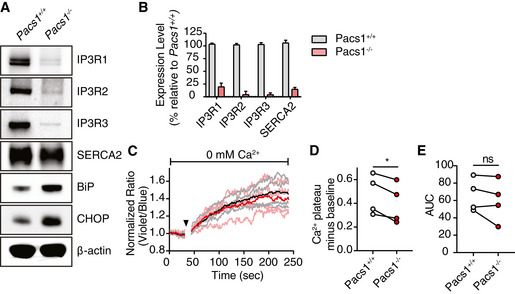
Immunoblot of expression of all three IP3R isoforms and SERCA2 in primary splenic B cells from Pacs1 +/+ and Pacs1 −/− mice.
Real‐time quantitative PCR of IP3R and SERCA2 transcripts in B cells. Data are presented as mean ± SD from three independent Pacs1 +/+ and Pacs1 −/− pairs of mice.
Pacs1 −/− FOB cells were labeled with Indo‐1 and stimulated with 0.625 µM thapsigargin (black arrowhead) under Ca2+‐free conditions to measure intracellular Ca2+ stores. Kinetic traces of four independent experiments are shown (Pacs1 +/+ gray, Pacs1 −/− pink) with the mean overlaid in bold (Pacs1 +/+ black, Pacs1 −/− red).
Plateau of cytosolic Ca2+ flux from intracellular Ca2+ stores in (C) calculated by the mean value over the last 30 s of analysis with baseline subtracted. Two‐tailed paired t test, *P < 0.05.
AUC of cytosolic Ca2+ flux from intracellular Ca2+ stores in (C). Two‐tailed paired t test, ns = not significant.
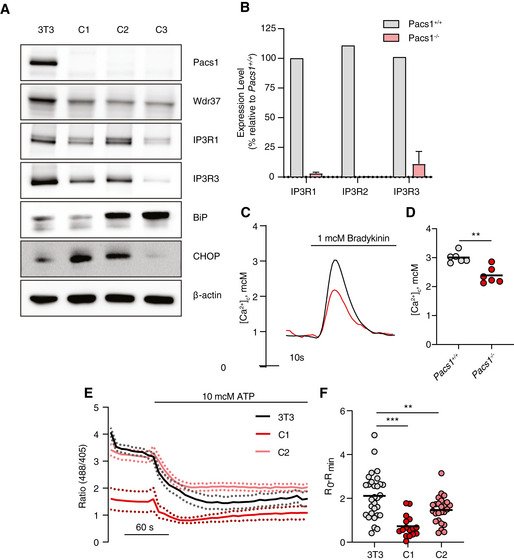
Immunoblot of Pacs1, Wdr37, IP3Rs, and ER stress markers in the parental NIH‐3T3 cell line and three separate Pacs1 −/− clones.
Real‐time quantitative PCR of IP3R isoform expression WT and Pacs1 −/− 3T3 cells. Expression in the Pacs1 −/− cells was measured in three independent clones. Data are presented as mean ± SD.
Pacs1 +/+ and Pacs1 −/− NIH‐3T3 cells were transfected with cytosolic aequorin and Ca2+ flux was measured after treatment with 1 µM bradykinin. Representative kinetic tracing is shown.
Peak cytosolic Ca2+ concentration based on aequorin measurements as performed in (C). Symbols represent individual wells containing ~ 5 × 10⁵ transfected Pacs1 +/+ 3T3 or Pacs1 −/− 3T3 cells from one experiment. Horizontal bars indicate mean. Two‐tailed unpaired t test, **P < 0.01.
Pacs1 +/+ and Pacs1 −/− NIH‐3T3 cells (C1 and C2 from (A)) were transfected with ER‐GCamP6‐210. ER Ca2+ was measured before and after treatment with 10 µM ATP. Kinetic traces show the mean 488/405 nm excitation ratio of each cell line with error bars indicating SEM. N = 30 cells (3T3), 16 cells (C1), 25 cells (C2). Data are representative of 2 independent experiments.
ER Ca2+ release from the NIH‐3T3 cell lines imaged in (E). Symbols represent individual cells. Horizontal bars indicate mean value. One‐way ANOVA with Tukey’s test for multiple comparisons, **P < 0.01, ***P < 0.001.
- A
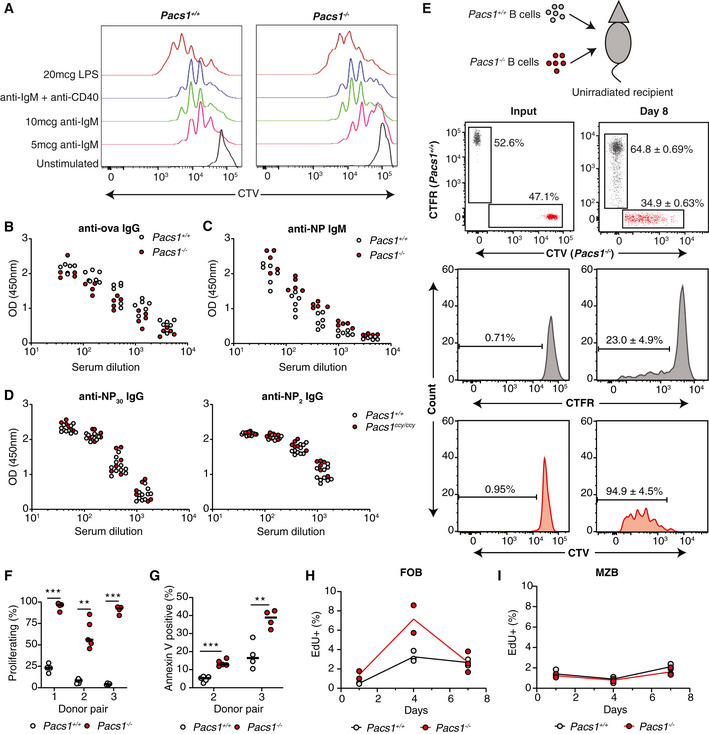
Pacs1 +/+ and Pacs1 −/− B cells were purified, labeled with CTV dye, and stimulated with the indicated mitogens. Cell proliferation was assessed after 72 h with FACS analysis based on CTV dilution.
- B, C
Pacs1 +/+ and Pacs1 −/− mice were immunized with alum‐ova and 1 week later with NP‐Ficoll. Anti‐ova IgG and anti‐NP IgM titers were measured at 14 and 7 days after immunization, respectively. Each symbol represents an individual mouse.
- D
Pacs1 +/+ and Pacs1ccy / ccy mice were immunized with NP‐KLH. Low‐affinity (anti‐NP30) and high‐affinity (anti‐NP2) antibodies were measured 14 days after immunization.
- E
B cells were purified from Pacs1 +/+ and Pacs1 −/− mice and labeled with CTFR and CTV dyes, respectively. Labeled B cells were injected into unirradiated CD45.1 recipients at ~ 1:1 ratio. Proliferation and survival of adoptively transferred B cells were measured 8 days post‐transplant.
- F
Fraction of donor B cells that proliferated after adoptive transfer. Three independent experiments using three different Pacs1 +/+ and Pacs1−/− donor pairs. Each symbol represents an individual recipient. Horizontal bars indicate median value. Two‐tailed unpaired t test, **P < 0.01, ***P < 0.001.
- G
Fraction of donor B cells that were Annexin V positive after adoptive transfer. Two independent experiments using two different Pacs1 +/+ and Pacs1 −/− donor pairs. Each symbol represents an individual recipient. Horizontal bars indicate median value. Two‐tailed unpaired t test, **P < 0.01, ***P < 0.001.
- H, I
Pacs1 +/+ and Pacs1 −/− mice were injected with EdU, and the fraction of EdU+ FOB and MZB cells was measured in the spleen at 1, 4, and 7 days post‐injection. Data are from one experiment.
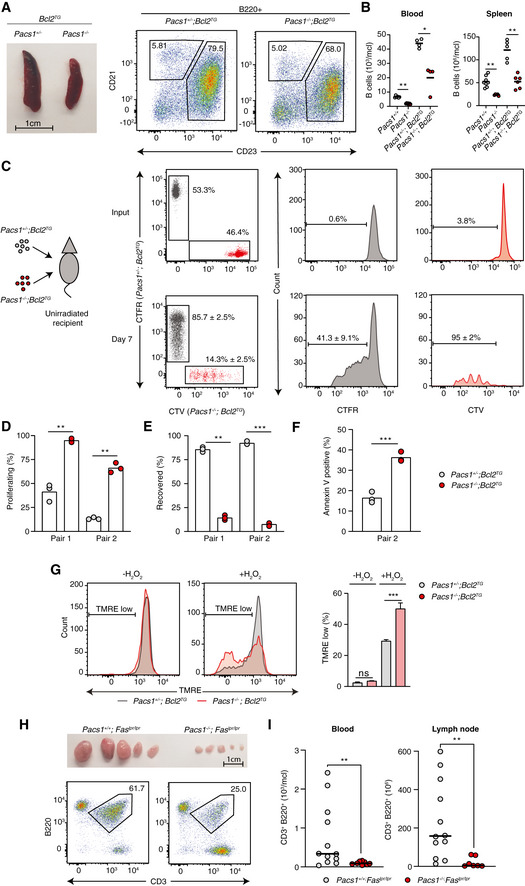
- A
Spleen size and FACS analysis of abnormally expanded B220+CD23+CD21+/low FOB cells in Pacs1 +/− ; Bcl2TG and Pacs1 −/− ; Bcl2TG mice.
- B
Number of circulating B cells in the blood and FOB cells in the spleen of Pacs1 +/− ; Bcl2TG and Pacs1 −/− ; Bcl2TG mice. Horizontal bars indicate mean value. Two‐tailed Mann–Whitney test, *P < 0.05, **P < 0.01.
- C
B cells were purified from the spleens of Pacs1 +/− ; Bcl2TG and Pacs1 −/− ; Bcl2TG mice (CD45.2), labeled with CTFR and CTV proliferation dyes, respectively, and transplanted into unirradiated CD45.1 recipients. Donor B cells were measured in the spleen of recipient mice 7 days after B cell transfer based on CD45.2 expression and proliferation dye fluorescence.
- D, E
The fraction of proliferating (D) and recovered (E) donor cells from the experiment in (C). Symbols represent individual recipient mice, and data are from two independent adoptive transfer experiments. Two‐tailed unpaired t test, **P < 0.01, ***P < 0.001.
- F
Fraction of apoptotic B cells in the adoptively transferred B cell populations in the experiment in (C). Symbols represent individual recipient mice and data are from one adoptive transfer experiment. Two‐tailed unpaired t test, ***P < 0.001.
- G
Splenocytes from Pacs1 +/− ; Bcl2TG and Pacs1 −/− ; Bcl2TG mice were stained with cell surface antibodies to identify FOB cells and treated with 100 µM H2O2 for 35 min. Cells were then labeled with TMRE to monitor MMP. TMRE fluorescence was measured by FACS analysis. Data are presented as mean ± SD of 3–4 replicates, unpaired t test, ns = not significant, ***P < 0.001. Results are from one experiment.
- H
Lymph node size and flow cytometry analysis of lymphoproliferative CD3+B220+ cells in Pacs1 +/+ ; Faslpr / lpr and Pacs1 −/− ; Faslpr / lpr mice.
- I
Enumeration of CD3+B220+ cells in the peripheral blood and lymph nodes of Faslpr / lpr dependent on Pacs1 expression. Symbols represent individual mice. Horizontal bars indicate median value. Two‐tailed Mann–Whitney test, **P < 0.01.
Similar articles
-
Molecular Basis of the Schuurs-Hoeijmakers Syndrome: What We Know about the Gene and the PACS-1 Protein and Novel Therapeutic Approaches.Int J Mol Sci. 2022 Aug 25;23(17):9649. doi: 10.3390/ijms23179649. Int J Mol Sci. 2022. PMID: 36077045 Free PMC article. Review.
-
PACS-1 variant protein is aberrantly localized in Caenorhabditis elegans model of PACS1/PACS2 syndromes.Genetics. 2024 Oct 7;228(2):iyae118. doi: 10.1093/genetics/iyae118. Genetics. 2024. PMID: 39031646 Free PMC article.
-
Coloboma may be a shared feature in a spectrum of disorders caused by mutations in the WDR37-PACS1-PACS2 axis.Am J Med Genet A. 2021 Mar;185(3):884-888. doi: 10.1002/ajmg.a.62020. Epub 2020 Dec 27. Am J Med Genet A. 2021. PMID: 33369122 Review.
-
WDR37 syndrome: identification of a distinct new cluster of disease-associated variants and functional analyses of mutant proteins.Hum Genet. 2021 Dec;140(12):1775-1789. doi: 10.1007/s00439-021-02384-y. Epub 2021 Oct 12. Hum Genet. 2021. PMID: 34642815 Free PMC article.
-
First Report of Mexican Patients with PACS1-Related Neurodevelopmental Disorder and Review of the PACS1-, PACS2-, and WDR37-Related Ophthalmological Manifestations.Mol Syndromol. 2023 Apr;14(2):143-151. doi: 10.1159/000526975. Epub 2022 Dec 16. Mol Syndromol. 2023. PMID: 37064331 Free PMC article.
Cited by
-
iPSC-derived models of PACS1 syndrome reveal transcriptional and functional deficits in neuron activity.Nat Commun. 2024 Jan 27;15(1):827. doi: 10.1038/s41467-024-44989-7. Nat Commun. 2024. PMID: 38280846 Free PMC article.
-
PACS-1 variant protein is aberrantly localized in C. elegans model of PACS1/PACS2 syndromes.bioRxiv [Preprint]. 2024 Apr 26:2024.04.22.590644. doi: 10.1101/2024.04.22.590644. bioRxiv. 2024. Update in: Genetics. 2024 Oct 7;228(2):iyae118. doi: 10.1093/genetics/iyae118. PMID: 38712144 Free PMC article. Updated. Preprint.
-
Neural deficits in a mouse model of PACS1 syndrome are corrected with PACS1- or HDAC6-targeting therapy.Nat Commun. 2023 Oct 17;14(1):6547. doi: 10.1038/s41467-023-42176-8. Nat Commun. 2023. PMID: 37848409 Free PMC article.
-
Molecular Basis of the Schuurs-Hoeijmakers Syndrome: What We Know about the Gene and the PACS-1 Protein and Novel Therapeutic Approaches.Int J Mol Sci. 2022 Aug 25;23(17):9649. doi: 10.3390/ijms23179649. Int J Mol Sci. 2022. PMID: 36077045 Free PMC article. Review.
-
PACS-1 variant protein is aberrantly localized in Caenorhabditis elegans model of PACS1/PACS2 syndromes.Genetics. 2024 Oct 7;228(2):iyae118. doi: 10.1093/genetics/iyae118. Genetics. 2024. PMID: 39031646 Free PMC article.
References
-
- Bettigole SE, Glimcher LH (2015) Endoplasmic reticulum stress in immunity. Annu Rev Immunol 33: 107–138 - PubMed
-
- Blagoveshchenskaya AD, Thomas L, Feliciangeli SF, Hung CH, Thomas G (2002) HIV‐1 Nef downregulates MHC‐I by a PACS‐1‐ and PI3K‐regulated ARF6 endocytic pathway. Cell 111: 853–866 - PubMed
Publication types
MeSH terms
Substances
Grants and funding
LinkOut - more resources
Full Text Sources
Other Literature Sources
Molecular Biology Databases
Research Materials
Miscellaneous
