. 2021 Apr 15;131(8):e145275.
doi: 10.1172/JCI145275.

Deficiency of macrophage PHACTR1 impairs efferocytosis and promotes atherosclerotic plaque necrosis

Affiliations

Deficiency of macrophage PHACTR1 impairs efferocytosis and promotes atherosclerotic plaque necrosis

Canan Kasikara et al. J Clin Invest. .

Abstract

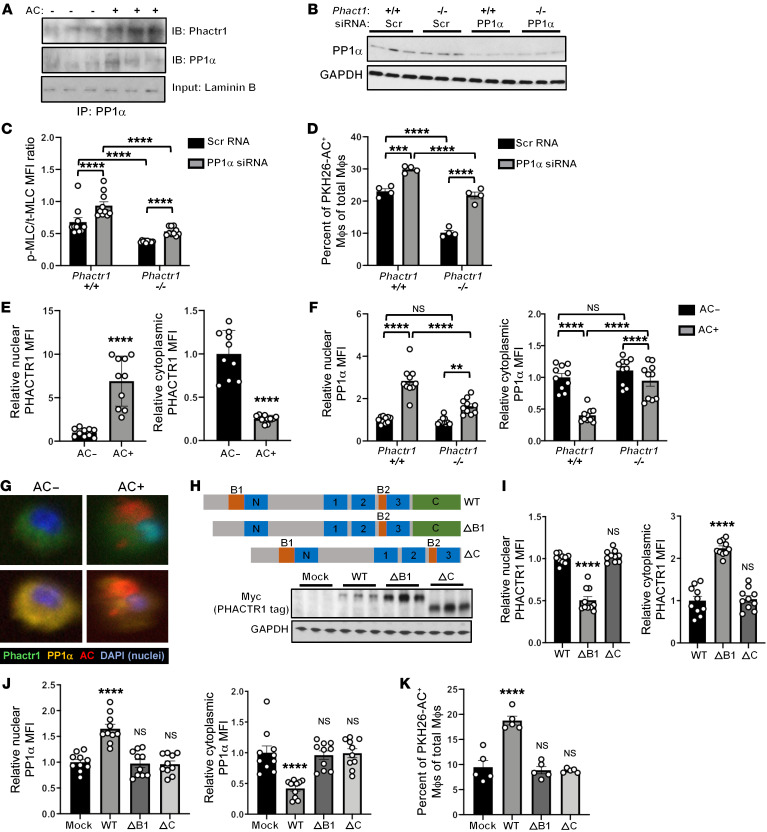
Efferocytosis, the process through which apoptotic cells (ACs) are cleared through actin-mediated engulfment by macrophages, prevents secondary necrosis, suppresses inflammation, and promotes resolution. Impaired efferocytosis drives the formation of clinically dangerous necrotic atherosclerotic plaques, the underlying etiology of coronary artery disease (CAD). An intron of the gene encoding PHACTR1 contains rs9349379 (A>G), a common variant associated with CAD. As PHACTR1 is an actin-binding protein, we reasoned that if the rs9349379 risk allele G causes lower PHACTR1 expression in macrophages, it might link the risk allele to CAD via impaired efferocytosis. We show here that rs9349379-G/G was associated with lower levels of PHACTR1 and impaired efferocytosis in human monocyte-derived macrophages and human atherosclerotic lesional macrophages compared with rs9349379-A/A. Silencing PHACTR1 in human and mouse macrophages compromised AC engulfment, and Western diet-fed Ldlr-/- mice in which hematopoietic Phactr1 was genetically targeted showed impaired lesional efferocytosis, increased plaque necrosis, and thinner fibrous caps - all signs of vulnerable plaques in humans. Mechanistically, PHACTR1 prevented dephosphorylation of myosin light chain (MLC), which was necessary for AC engulfment. In summary, rs9349379-G lowered PHACTR1, which, by lowering phospho-MLC, compromised efferocytosis. Thus, rs9349379-G may contribute to CAD risk, at least in part, by impairing atherosclerotic lesional macrophage efferocytosis.

Keywords: Cardiology; Cardiovascular disease; Cell Biology; Macrophages.


Conflict of interest statement

Conflict of interest: The authors have declared that no conflict of interest exists.

Figures

Figure 1
Figure 1. Human monocyte–derived and atherosclerotic lesional macrophages carrying the rs9349379-G CAD-risk variant have lower PHACTR1 expression and impaired efferocytosis.
(AD) Human monocyte–derived macrophages (HMDMs) were genotyped for rs9349379 SNP (n = 48; AA = 14, AG = 24, GG = 10) and then assayed as follows: relative PHACTR1 mRNA by quantitative PCR (normalized to HRPT1) (A); PHACTR1 protein (~75 kDa) by immunoblot (densitometric ratio with GAPDH [36 kDa] and expressed relative to AA) (B); and percentage of HMDMs that engulfed PKH26-labeled ACs (C). (D) Plot of efferocytosis versus PHACTR1 protein expression of rs9349379-AG HMDMs (r2 and P value obtained using Spearman correlation analysis). (EH) Human carotid endarterectomy specimens were genotyped for rs9349379 SNP (n = 45; AA=13, AG=22, GG=10) and then fixed and sectioned for immunofluorescence microscopy. (E) Sections were costained for PHACTR1, CD68, and DAPI. Scale bar: 100 μm. (F and G) The mean fluorescence intensity (MFI) of PHACTR1 in CD68+ areas (F) and the percentage of total DAPI+ cells that were CD68+ (G) were quantified. For each subject, 5 areas were analyzed, and the MFI value was averaged. Sections stained with isotype control antibodies against PHACTR1 and CD68 showed an absence of signal. (H) Sections were costained with TUNEL and CD68. Each TUNEL+ cell was determined to be either associated with a macrophage or not (“free”), and the data are presented as the ratio of macrophage-associated to free TUNEL+ cells. In AC and FH, *P < 0.05, **P < 0.01, ***P < 0.001, ****P < 0.0001 compared with the AA group, using 1-way ANOVA with Dunnett’s multiple-comparison test.
Figure 2
Figure 2. Silencing PHACTR1 in HMDMs decreases efferocytosis and phagocytosis.
HMDMs from 3 of the rs9349379-GG subjects in Figure 1 were transfected with either scrambled RNA (Scr RNA) or PHACTR1 siRNA. The cells were then incubated with or without IFN-γ and lipopolysaccharide (LPS). (AC) Immunoblots for PHACTR1 (~75 kDa) and GAPDH (36 kDa) using HMDMs from subjects 1, 2, and 3, respectively, with quantification of densitometric data. Results are shown as mean ± SEM; n = 3 experiments; *P < 0.05, **P < 0.01, ***P < 0.001 by 2-way ANOVA with post hoc Tukey’s analysis. (DF) Efferocytosis of PKH26-labeled ACs by HMDMs from subjects 1, 2, and 3, respectively. (GI) AC binding to HMDMs from subjects 1, 2, and 3, respectively, pretreated with 5 μM cytochalasin D for 20 minutes. (J and K) Internalization of E. coli and 4-μm and 10-μm polystyrene beads by HMDMs from subject 1. For DK, n = 3 biological replicates, using the average of technical triplicates for each. Results are shown as mean ± SEM, including individual data points. *P < 0.05, **P < 0.01, ***P < 0.001, ****P < 0.0001 by unpaired 2-tailed Student’s t test.
Figure 3
Figure 3. PHACTR1 deficiency impairs phagocytic internalization of ACs in BMDMs.
(AD) Bone marrow–derived macrophages (BMDMs) transfected with either scrambled RNA (Scr RNA) or Phactr1 siRNA (A and B), or from Phactr1+/+, Phactr1+/–, or Phactr1–/– mice (C and D), were incubated with or without IFN-γ and LPS and then assayed for PHACTR1 protein (~72 kDa) by immunoblot or for efferocytosis. (E) BMDMs from AD were assayed for AC binding in the presence of cytochalasin D. (F) BMDMs treated with Scr RNA or Phactr1 siRNA were transfected with LifeAct-RFP and then incubated with PKH67-labeled ACs for 45 minutes. After fixation, the cells were viewed by confocal fluorescence microscopy. Two examples of 0.5-μm Z-stack images from each group are shown. Left: RFP-PKH67-merged channel; right: RFP-only channel. Scale bars: 10 μm. In B, D, and E, values are mean ± SEM, including individual data points; n = 3 experiments. In B and upper E, *P < 0.05, ***P < 0.001 by unpaired 2-tailed Student’s t test. In D and lower E, ****P < 0.0001 compared with Phactr1+/+ by 1-way ANOVA with Dunnett’s multiple-comparison test.
Figure 4
Figure 4. PHACTR1 facilitates efferocytosis by increasing MLC phosphorylation.
(A) Ratio of MFI of phospho-MLC (p-MLC) to total MLC (t-MLC) was quantified in Phactr1+/+ and Phactr1–/– BMDMs incubated in the absence or presence of ACs (AC–, AC+). (B) HMDMs were treated with scrambled RNA or PHACTR1 siRNA and assayed for p-MLC/t-MLC MFI ratio as in A. ***P < 0.001, ****P < 0.0001. (C) Ratio of p-MLC to t-MLC was quantified for MFI in AC+ rs9349379-GG and -AA HMDMs as in Figure 1. Images were quantified for p-MLC/t-MLC MFI ratio; n = 5 HMDMs per group; ***P < 0.001 by Student’s unpaired t test. (D) BMDMs treated with scrambled RNA or Mlc2 siRNA were then immunoblotted for MLC (18 kDa) and GAPDH (36 kDa) or assayed for efferocytosis. Results are shown as mean ± SEM; n = 3 experiments; *P < 0.05 by 2-tailed Student’s unpaired t test. (E) Phactr1+/+ and Phactr1–/– BMDMs were transfected with empty vector (Mock) or vector encoding WT MLC or S18/19D MLC. One set of cells was immunoblotted for MLC and GAPDH, and the other was assayed for efferocytosis. Results are shown as mean ± SEM, including individual data points; n = 3 experiments; *P < 0.05, **P < 0.01 by 2-way ANOVA with post hoc Tukey’s analysis.
Figure 5
Figure 5. PHACTR1 sequesters PP1α in the nucleus and decreases the dephosphorylation of MLC during efferocytosis.
(A) Immunoblot of PHACTR1 (~72 kDa), PP1α (38 kDa), and laminin B (input control; 68 kDa) of anti-PP1α immunoprecipitates from BMDMs incubated in the absence or presence of ACs. (BD) Phactr1+/+ and Phactr1–/– BMDMs treated with scrambled RNA or PP1α siRNA. One set of cells was immunoblotted for PPA1α (38 kDa) and GAPDH (36 kDa), one set was stained with phospho- and total MLC antibody and quantified as phospho- to total MLC MFI ratio, and one set was assayed for efferocytosis. (E) Quantification of nuclear and cytoplasmic PHACTR1 in BMDMs incubated in the absence or presence of ACs. (F) Quantification of nuclear and cytoplasmic PP1α in Phactr1+/+ and Phactr1–/– BMDMs incubated in the absence or presence of ACs. (G) Immunofluorescence microscopy images of BMDMs incubated in the absence or presence of ACs (green, PHACTR; yellow, PP1α; red, AC; blue, DAPI [nucleus]). (H) Graphic scheme of PHACTR1 WT and mutant protein structure and immunoblots of Myc (PHACTR1 tag) and GAPDH in Phactr1–/– BMDMs transfected with WT and mutant PHACTR1 (Myc-tagged PHACTR1 protein is ~73 kDa in WT and ΔB1, and ~70 kDa in ΔC). (IK) Quantification of nuclear and cytoplasmic PHACTR1 and PP1α and efferocytosis in the BMDMs depicted in H. In CF and IK, mean ± SEM, including individual data points; n = 3 experiments, with n > 5–10 macrophages quantified for each group; **P < 0.01, ***P < 0.001, ****P < 0.0001 by 2-tailed Student’s unpaired t test (C–F), 1-way ANOVA with post hoc Dunnet’s analysis compared with WT (I), or 2-way ANOVA with post hoc Tukey’s analysis, compared with mock (J and K).
Figure 6
Figure 6. Chimeric mice lacking hematopoietic PHACTR1 show defective macrophage efferocytosis of apoptotic thymocytes.
Bone marrow cells from Phactr1+/+, Phactr1+/–, or Phactr1–/– mice were transplanted into irradiated mice. After 6 weeks, the mice were injected i.p. with PBS or 250 mg/mouse dexamethasone. After 18 hours, the thymi were harvested. (AD) Thymic weight, cellularity, and content of annexin V+ cells and F4/80+ cells. (E) Thymus sections were stained for TUNEL and Mac2 and then quantified for the ratio of macrophage-associated to free TUNEL+ cells. (F) Thymus sections were stained for TUNEL, Mac2, p-MLC, and t-MLC, and the ratio of p-MLC to t-MLC was quantified for MFI in macrophages associated with TUNEL+ cells. In AF, results are shown as individual data points with lines indicating mean ± SEM; n = 3 mice for PBS groups and n = 6 mice for dexamethasone groups; *P < 0.05, **P < 0.01, ***P < 0.001, ****P < 0.0001 by 1-way ANOVA with Dunnett’s multiple-comparison test.
Figure 7
Figure 7. WD-fed Ldlr–/– mice lacking hematopoietic PHACTR1 show defective macrophage efferocytosis and increased plaque necrosis in atherosclerotic lesions.
(AC and G) Bone marrow from Phactr1+/+ or Phactr1–/– mice was transplanted into irradiated Ldlr–/– mice. After 4 weeks, the mice were fed a Western-type diet (WD) for 8 weeks, and then aortic root lesional cross sections were analyzed. (A) Ratio of Mac2+ macrophage–associated to free TUNEL+ cells. (B) Ratio of p-MLC to t-MLC MFI in macrophages associated with TUNEL+ cells. (C) Images of aortic root sections stained with H&E (dashed lines indicate necrotic area), with quantification of necrotic and lesion areas. (DF and H) Bone marrow from Phactr1+/+ or Phactr1+/– mice was transplanted into irradiated Ldlr–/– mice. After 4 weeks, the mice were fed the WD for 12 weeks. (DF) Lesional endpoints were quantified as above. (G and H) Aortic root cross sections were stained with Picrosirius red. For each section, cap thickness was measured at the lesional midpoint and both shoulder regions and then averaged and quantified as the ratio of collagen cap thickness to lesion area, relative to the Phactr1+/+ group. (I) Bone marrow from Phactr1–/– or Phactr1+/+ mice was transplanted into irradiated Phactr1–/– Ldlr–/– mice. After 4 weeks, the mice were fed the WD diet for 8 weeks, and lesional endpoints were quantified as above. In all panels, results are shown as individual data points with lines indicating mean ± SEM; *P < 0.05, **P < 0.01, ****P < 0.0001 by 2-tailed Student’s unpaired t test. Scale bars: 100 μm.

Similar articles

Cited by

References

    1. Virani SS, et al. Heart disease and stroke statistics—2020 update: a report from the American Heart Association. Circulation. 2020;141(9):e139–e596. - PubMed
    1. Lusis AJ. Atherosclerosis. Nature. 2000;407(6801):233–241. doi: 10.1038/35025203. - DOI - PMC - PubMed
    1. Tabas I, et al. Subendothelial lipoprotein retention as the initiating process in atherosclerosis: update and therapeutic implications. Circulation. 2007;116(16):1832–1844. doi: 10.1161/CIRCULATIONAHA.106.676890. - DOI - PubMed
    1. Glass CK, Witztum JL. Atherosclerosis. the road ahead. Cell. 2001;104(4):503–516. doi: 10.1016/S0092-8674(01)00238-0. - DOI - PubMed
    1. Kasikara C, et al. The role of non-resolving inflammation in atherosclerosis. J Clin Invest. 2018;128(7):2713–2723. doi: 10.1172/JCI97950. - DOI - PMC - PubMed

Publication types

MeSH terms