. 2021 Apr 8;6(7):e145928.
doi: 10.1172/jci.insight.145928.

Chronic HIV infection induces transcriptional and functional reprogramming of innate immune cells

Affiliations

Chronic HIV infection induces transcriptional and functional reprogramming of innate immune cells

Wouter A van der Heijden et al. JCI Insight. .

Abstract

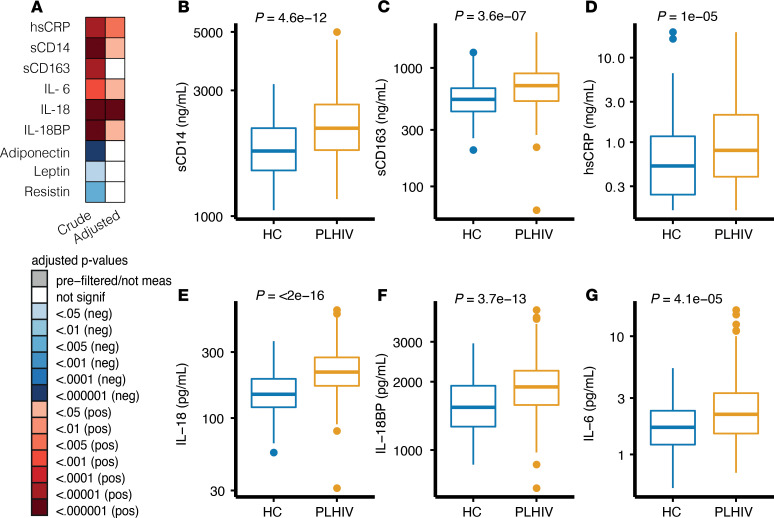
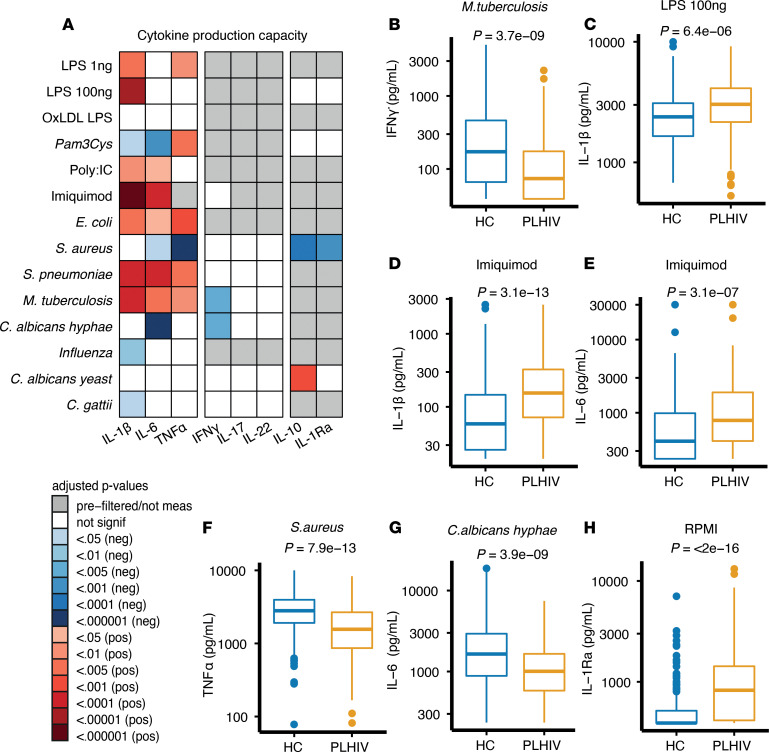
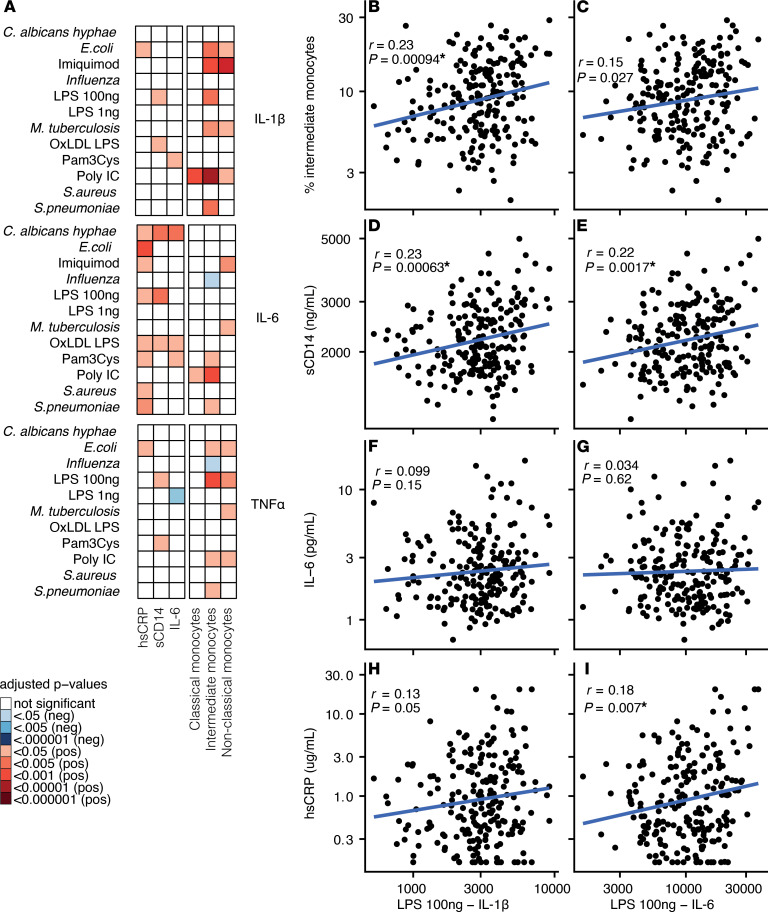
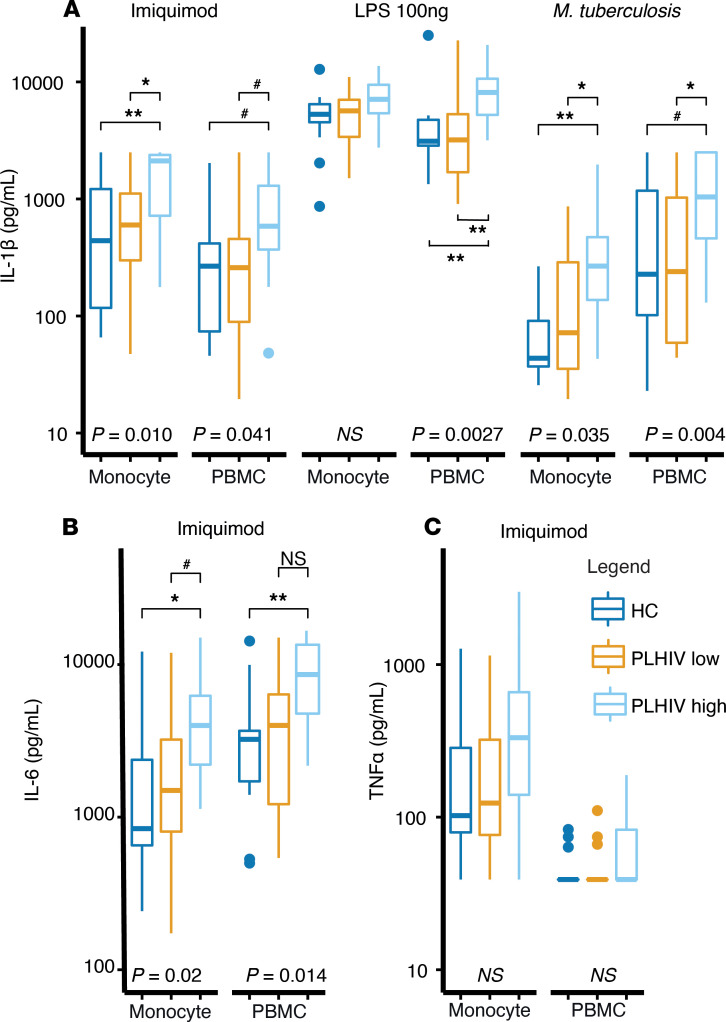
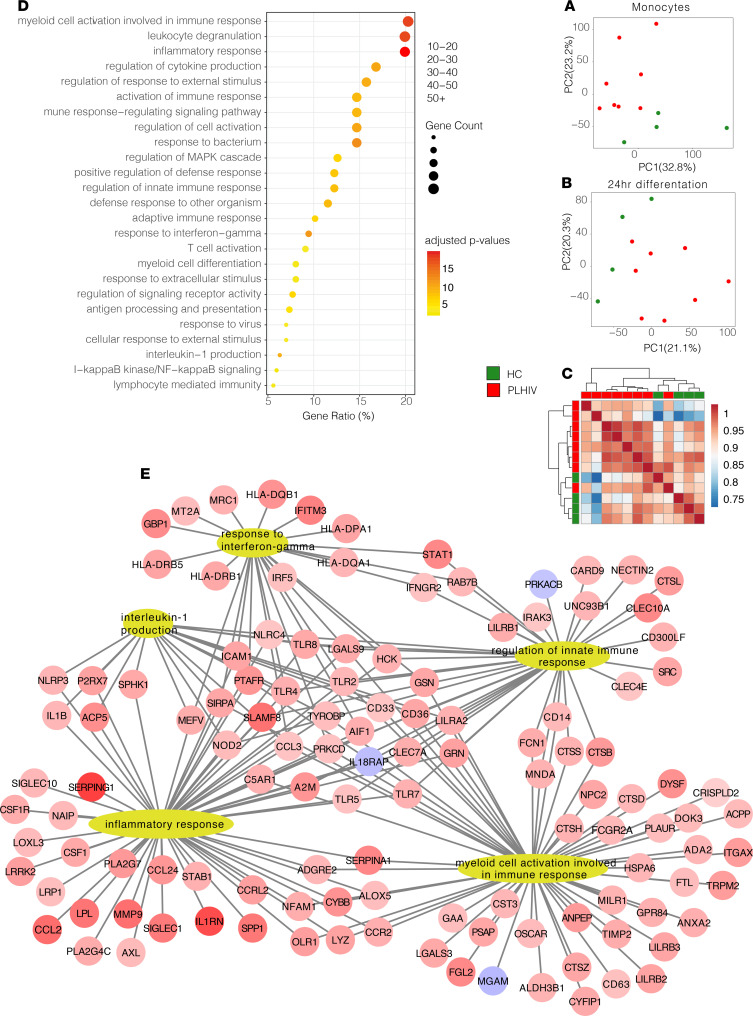
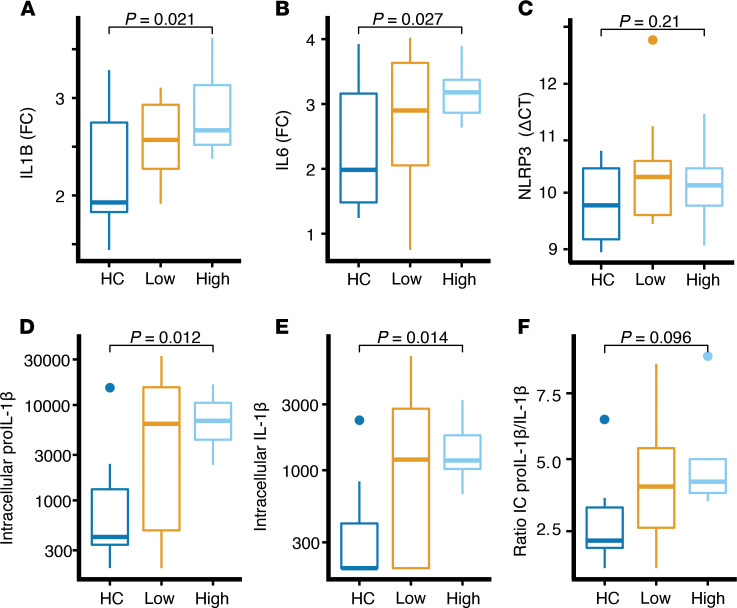
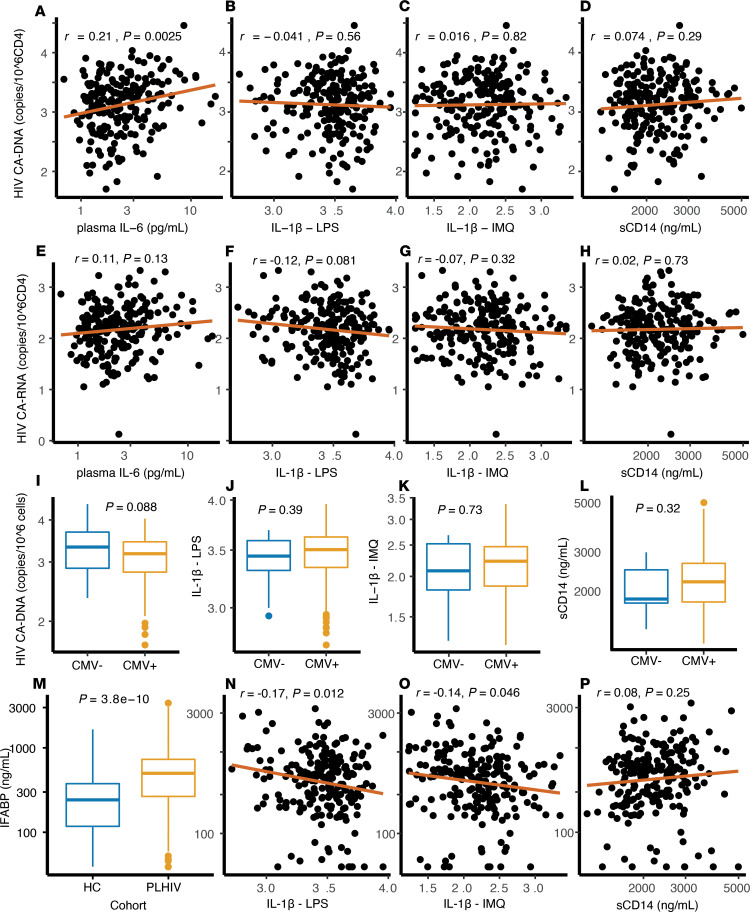
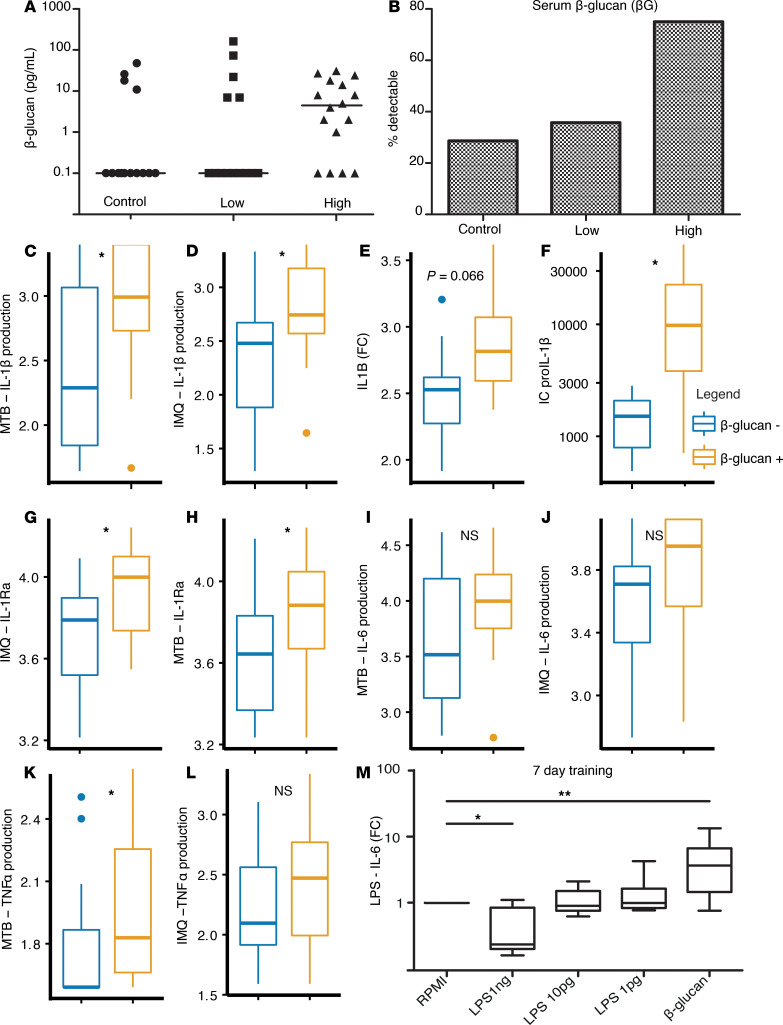
Chronic inflammation and immune dysfunction play a key role in the development of non-AIDS-related comorbidities. The aim of our study was to characterize the functional phenotype of immune cells in people living with HIV (PLHIV). We enrolled a cross-sectional cohort study of PLHIV on stable antiretroviral therapy and healthy controls. We assessed ex vivo cytokine production capacity and transcriptomics of monocytes and T cells upon bacterial, fungal, and viral stimulation. PLHIV exhibited an exacerbated proinflammatory profile in monocyte-derived cytokines, but not in lymphocyte-derived cytokines. Particularly, the production of the IL-1β to imiquimod, E. coli LPS, and Mycobacterium tuberculosis was increased, and this production correlated with plasma concentrations of high-sensitivity C-reactive protein and soluble CD14. This increase in monocyte responsiveness remained stable over time in subsequent blood sampling after more than 1 year. Transcriptome analyses confirmed priming of the monocyte IL-1β pathway, consistent with a monocyte-trained immunity phenotype. Increased plasma concentrations of β-glucan, a well-known inducer of trained immunity, were associated with increased innate cytokine responses. Monocytes of PLHIV exhibited a sustained proinflammatory immune phenotype with priming of the IL-1β pathway. Training of the innate immune system in PLHIV likely plays a role in long-term HIV complications and provides a promising therapeutic target for inflammation-related comorbidities.

Keywords: AIDS/HIV; Immunology; Innate immunity; Monocytes; Transcription.


Conflict of interest statement

Conflict of interest: QDM, AJAMVDV, and MGN received research support from ViiV Healthcare.

Figures

Figure 1
Figure 1. Circulating factors in PLHIV versus uninfected HCs.
(A) Circulating factors in PLHIV and uninfected controls. Crude model is linear regression after inverse rank-based transformation. Adjusted model included age, sex, and seasonality as covariates. Red depicts the marker is significantly increased in PLHIV; blue depicts the marker is decreased in PLHIV compared with HCs. All P values are FDR corrected (Benjamini-Hochberg method). (BG) Box plots depicting circulating factors of inflammation stratified by cohort; PLHIV (blue), uninfected controls (yellow). P values are calculated using 2-tailed Student’s t test. Box plots are depicted according to Tukey; median (line), IQR (edge of box plot), range (whiskers), and outliers 3 times IQR are depicted as dots. All plots include data from PLHIV (n = 211) and HCs (n = 56). PLHIV, people living with HIV; HCs, healthy controls; hsCRP, high-sensitivity C-reactive protein; sCD14, soluble CD14; sCD163, soluble CD163; IL-18BP, IL-18–binding protein.
Figure 2
Figure 2. Cytokine production capacity in PLHIV versus uninfected HCs.
(A) Ex vivo cytokine production capacity between PLHIV and HCs after 24 hours (in case of IL-1β, TNF-α, IL-6, IL-10, and IL-1Ra) and 7 days stimulation (IL-22, IL-17, and IFN-γ). FDR-corrected (Benjamini-Hochberg method) P values are depicted from an adjusted model that included age, sex, seasonality as covariates. Red depicts a significantly higher cytokine production capacity, and blue depicts a lower cytokine production capacity in PLHIV compared with HCs. (BH) Box plots depicting ex vivo cytokine production capacity stratified by cohort. PLHIV depicted in blue and uninfected controls in yellow. P values, depicted in box plots, were calculated using 2-tailed Student’s t test after log transformation. All box plots are depicted according to Tukey; median (line), IQR (edge of box plot), range (whiskers), and outliers 3 times IQR are depicted as dots. All plots include data from PLHIV (n = 211) and HCs (n = 56). PLHIV, people living with HIV; HCs, healthy controls; oxLDL, oxidized LDL; Pam3Cys, synthetic TLR2 ligand; Poly IC, TLR3 ligand; imiquimod, TLR7 ligand.
Figure 3
Figure 3. Cytokine production capacity versus circulating factors.
(A) Correlation plot with adjusted P value shown after correcting for age, sex, and seasonality as covariates. Red depicts a significant positive correlation and blue depicts a negative correlation within PLHIV. All P values were FDR corrected per circulating factor. (BI) Correlation plots without cofactor adjustment. Pearson’s coefficient (r) with P value after log transformation is shown. All plots include data from PLHIV (n = 211) and HCs (n = 56). PLHIV, people living with HIV; HCs, healthy controls; oxLDL, oxidized LDL; Pam3Cys, synthetic TLR2 ligand; Poly IC, TLR3 ligand; imiquimod, TLR7 ligand; hsCRP, high-sensitivity C-reactive protein; sCD14, soluble CD14; sCD163, soluble CD163; IL-18BP, IL-18–binding protein. *P < 0.05 after FDR correction.
Figure 4
Figure 4. Ex vivo cytokine production capacity of monocytes in a validation cohort.
(A) IL-1β production upon 24 hours’ stimulation with imiquimod (1 μg/mL), LPS (100 ng/mL), or M. tuberculosis (1 μg/mL) in PBMCs or monocyte-only culture (magnetic beads CD14+ isolation). (B) IL-6 production upon imiquimod stimulation. (C) TNF-α production upon imiquimod stimulation. All data are stratified by HCs (n = 14), PLHIV low initial IL-1β–producers (n = 13), and PLHIV high IL-1β–producers (n = 15). All box plots are depicted according to Tukey; median (line), IQR (edge of box plot), range (whiskers), and outliers 3 times IQR (dots). A Kruskal-Wallis test was performed with a post hoc testing when the P value was below 0.05. Post hoc testing was performed by using a Mann-Whitney U test on the comparison PLHIV high vs. HCs and PLHIV high vs. PLHIV low. A Bonferroni’s multiple-testing correction was used by setting the significance level at P < 0.025 for post hoc analysis. *P < 0.025, **P < 0.001, #P < 0.05 (above multiple-testing threshold), ns, nonsignificant. PLHIV, people living with HIV; HCs, healthy controls.
Figure 5
Figure 5. Transcriptome analysis of monocytes.
(A) PCA plot of transcriptome of monocytes from PLHIV and HCs directly after isolation. (B) PCA plot of transcriptome of monocytes from PLHIV and HCs after 24 hours’ macrophage differentiation in medium only. (C) Hierarchical clustering plot (PLHIV vs. HCs). (D) Gene ontology of differentially expressed genes (PLHIV vs. HCs) including adjusted P value and gene count. (E) Top pathways of gene ontology plot after macrophage differentiation (gene ontology interaction terms). PLHIV, n = 8; HC, n = 4. PCA, principal component analysis; PLHIV, people living with HIV; HCs, healthy controls.
Figure 6
Figure 6. IL1B gene expression and intracellular pro–IL-1β.
(A) IL1B gene expression after imiquimod 1 μg/mL stimulation depicted as FC from medium (RPMI). (B) IL6 gene expression after imiquimod stimulation depicted as FC from medium. (C) NLRP3 gene expression (by ΔCT) in RPMI. (D) Intracellular levels of pro–IL-1β protein after imiquimod stimulation. (E) Intracellular mature IL-1β protein after imiquimod stimulation. (F) Ratio of intracellular pro–IL-1β vs. IL-1β after imiquimod stimulation protein. All data are stratified by HCs (n = 14), PLHIV low initial IL-1β–producers (n = 13), and PLHIV high IL-1β–producers (n = 15). All box plots are depicted according to Tukey; median (line), IQR (edge of box plot), range (whiskers), and outliers 3 times IQR are depicted as dots. P values were calculated by 2-way ANOVA and subsequently by pair-wise 2-tailed Student’s t test. FC, fold change; PLHIV, people living with HIV; HCs, healthy controls.
Figure 7
Figure 7. Parameters of HIV reservoir, CMV seropositivity, and microbial integrity.
(AD) Log10-transformed CA-DNA in CD4+ cells correlation with (A) circulating IL-6 levels, (B) IL-1β production after LPS (100 ng/mL) stimulation, (C) IL-1β production after IMQ (1 μg/mL) stimulation, and (D) soluble CD14 plasma concentration. (EH) Log10-transformed CA-RNA in CD4+ cells correlation with (E) circulating IL-6 levels, (F) IL-1β production after LPS stimulation, (G) IL-1β production after imiquimod stimulation, and (H) sCD14 plasma concentration. (IL) Stratified by CMV seropositivity: (I) log10-transformed CA-DNA in CD4+ cells, (J) IL-1β production after LPS stimulation, (K) IL-1β production after imiquimod stimulation, and (L) sCD14 plasma concentration. (M) Plasma iFABP, a marker of intestinal integrity, between HCs (n = 56) and PLHIV (n = 211). (NP) Plasma iFABP concentration correlation with (N) IL-1β production after LPS stimulation, (O) IL-1β production after imiquimod, and (P) sCD14 plasma concentration. All box plots are depicted according to Tukey; median (line), IQR (edge of box plot), range (whiskers), and outliers 3 times IQR (dots). Pearson’s coefficient (r) after log transformation is shown in correlation plots. Data in box plots are analyzed using 2-tailed Student’s t test after log10 transformation. All plots depict data from PLHIV only (n = 211) unless otherwise stated. CA-DNA, cell-associated HIV-1 DNA; CA-RNA, cell-associated HIV-1 RNA; IMQ, imiquimod; iFABP, intestinal fatty acid–binding protein; PLHIV, people living with HIV; HCs, healthy controls.
Figure 8
Figure 8. β-Glucan induces a proinflammatory phenotype in monocytes.
(A) β-Glucan in serum stratified by HCs (control) and PLHIV with low or high initial IL-1β response. (B) Percentage of detectable levels of β-glucan in serum, stratified by control and PLHIV with high and low initial IL-1β response. (C and D) IL-1β production after 24 hours’ stimulation with imiquimod (C) (1 μg/mL) or Mycobacterium tuberculosis (Mtb) (D) (1 μg/mL) in PLHIV stratified by detectable β-glucan levels. (E) IL1B gene expression after imiquimod stimulation depicted as FC from medium (RPMI). (F) Intracellular levels of pro–IL-1β protein after imiquimod stimulation. (G and H) IL-1Ra production after 24 hours’ stimulation with imiquimod (G) or Mtb (H) in PLHIV stratified by β-glucan. (I and J) IL-6 production after 24 hours’ stimulation with imiquimod (I) or Mtb (J) in PLHIV stratified by β-glucan. (K and L) TNF-α production after 24 hours’ stimulation with imiquimod (K) or Mtb (L) in PLHIV stratified by β-glucan. (AL) PLHIV, n = 28; HCs, n = 14. All box plots are depicted according to Tukey; median (line), IQR (edge of box plot), range (whiskers), and outliers 3 times IQR are depicted as dots. Data were analyzed using 2-tailed Student’s t test after log10 transformation. (M) Initial training with LPS, β-glucan (10 μg/mL), or medium only (RPMI plus 10% serum) was performed for 24 hours on day 1. Thereafter, a 5-day resting period in medium only (supplemented by 10% serum); on day 6, adherent monocytes were restimulated with LPS 10 ng/mL. IL-6 was measured in the supernatant and FC from training with medium only are depicted. Data are from 3 separate experiments (n = 9). Data were analyzed using Wilcoxon matched pairs signed-rank test. *P < 0.05 **P < 0.01. IMQ, imiquimod; FC, fold change.

Similar articles

Cited by

References

    1. Deeks SG, et al. Systemic effects of inflammation on health during chronic HIV infection. Immunity. 2013;39(4):633–645. doi: 10.1016/j.immuni.2013.10.001. - DOI - PMC - PubMed
    1. Hunt PW, et al. Immunologic biomarkers, morbidity, and mortality in treated HIV infection. J Infect Dis. 2016;214(suppl 2):S44–S50. doi: 10.1093/infdis/jiw275. - DOI - PMC - PubMed
    1. INSIGHT START Study Group. et al. Initiation of antiretroviral therapy in early asymptomatic HIV infection. N Engl J Med. 2015;373(9):795–807. doi: 10.1056/NEJMoa1506816. - DOI - PMC - PubMed
    1. Strategies for Management of Antiretroviral Therapy (SMART) Study Group. et al. CD4+ count-guided interruption of antiretroviral treatment. New Engl J Med. 2006;355(22):2283–2296. doi: 10.1056/NEJMoa062360. - DOI - PubMed
    1. Freeman ML, et al. Cytokines and T-cell homeostasis in HIV infection. J Infect Dis. 2016;214(suppl 2):S51–S57. doi: 10.1093/infdis/jiw287. - DOI - PMC - PubMed

Publication types

MeSH terms