. 2021 May 3;131(9):e144864.
doi: 10.1172/JCI144864.

Beryllium-specific CD4+ T cells induced by chemokine neoantigens perpetuate inflammation

Affiliations

Beryllium-specific CD4+ T cells induced by chemokine neoantigens perpetuate inflammation

Michael T Falta et al. J Clin Invest. .

Abstract

Discovering dominant epitopes for T cells, particularly CD4+ T cells, in human immune-mediated diseases remains a significant challenge. Here, we used bronchoalveolar lavage (BAL) cells from HLA-DP2-expressing patients with chronic beryllium disease (CBD), a debilitating granulomatous lung disorder characterized by accumulations of beryllium-specific (Be-specific) CD4+ T cells in the lung. We discovered lung-resident CD4+ T cells that expressed a disease-specific public CDR3β T cell receptor motif and were specific to Be-modified self-peptides derived from C-C motif ligand 4 (CCL4) and CCL3. HLA-DP2-CCL/Be tetramer staining confirmed that these chemokine-derived peptides represented major antigenic targets in CBD. Furthermore, Be induced CCL3 and CCL4 secretion in the lungs of mice and humans. In a murine model of CBD, the addition of LPS to Be oxide exposure enhanced CCL4 and CCL3 secretion in the lung and significantly increased the number and percentage of CD4+ T cells specific for the HLA-DP2-CCL/Be epitope. Thus, we demonstrate a direct link between Be-induced innate production of chemokines and the development of a robust adaptive immune response to those same chemokines presented as Be-modified self-peptides, creating a cycle of innate and adaptive immune activation.

Keywords: Adaptive immunity; Pulmonology; T cell receptor; T cells.


Conflict of interest statement

Conflict of interest: The authors have declared that no conflict of interest exists.

Figures

Figure 1
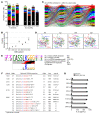
Figure 1. Identification of Be-specific BAL-derived T cells that express a CBD-related CDR3β motif.
(A) Stacked bar representation of clonality found by single-cell TCR analysis of CD4+ T cells from CBD patients. Black portions of bars proportionately count unique clonotypes; colored portions enumerate αβTCR-defined clonal expansions with height proportional to the number of cells in the expansion. Total αβTCR pairs obtained for each patient are indicated. (B) Inverse Simpson’s diversity plot of clone-size distributions. Displayed are means with upper and lower limits. (C) Cord diagram of T cell TR gene usage from CBD patients. Each individual T cell’s TR gene usage profile is connected by a curved line whose thickness is proportional to the number of T cells with the respective gene pairing. Genes are color coded based on frequency of usage, and enrichment of some genes relative to a background naive repertoire is indicated by arrows. (D) Two-dimensional PCA of TCRdist values for αβTCRs from all patients combined. Each dot represents a T cell, and color indicates usage of different TR genes. (E) TCR logo of CDR3β amino acid sequence motif identified in BAL-derived CBD T cells. Statistical significance was determined by χ2 analysis comparing the observed frequency of this motif versus the expected frequency. Panels show by proportion TRBV (left) and TRBJ (right) gene usage and encoded amino acid sequences (middle, top), respectively. Colored bars in the middle indicate the inferred nucleotide source for the corresponding position (black, TRD gene; red, N-insertions). Bottom panel summarizes the likelihood of each amino acid residue being non–germline derived (taller is more likely). (F) TRB gene usage and junctional region amino acid sequence of T cells comprising the LKGGG CDR3β motif cluster. Red (and blue [K]) colors indicate nongermline or TRBD gene–encoded amino acids. Also shown are the number of identical TCRs over the total number of sequences obtained for each patient and TCRs selected to express in hybridomas. (G) IL-2 response of T cell hybridomas to medium and BeSO4 presented by splenic B cells isolated from HLA-DP2 transgenic mice. Data are representative of 3 experiments done in triplicate.
Figure 2
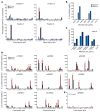
Figure 2. Antigen discovery of BAL-derived LKGGG CDR3β TCRs using unbiased and biased decapeptide PSLs.
(A) Representative results of 2 experiments depicting IL-2 responses (pg/mL, done in duplicate) of hybridomas 8133-c4r and 8845-c3 to an unbiased PSL. Peptide mixtures (200 μg/mL) were presented by HLA-DP2–transfected fibroblast line DP2.21 in the presence of BeSO4 (75 μM), and data were normalized to peak IL-2 produced in the assay for each hybridoma (mixture E7, lower left). Label on x axis denotes amino acid (single letter code) fixed at each defined position. Four (p4, p5, p7, p8) of 10 peptide positions scanned are displayed. (B and C) IL-2 produced (pg/mL) by indicated hybridomas in response to select dual-defined (100 μg/mL) (B) and triple-defined (20 μg/mL) (C) mixtures in the presence of BeSO4 (75 μM). (D and E) IL-2 responses (pg/mL) of hybridomas 8133-c4r and 8845-c3 (D) and hybridoma DV-13 (E) to a biased PSL with 2 positions fixed (D5E8). Each panel shows a different peptide position scanned using peptide mixtures (20 μg/mL) tested in duplicate in the presence of BeSO4 and including a control D5E8 mixture (Ct). Asterisks indicate amino acids selected at each peptide position for synthesis of mimotopes.
Figure 3
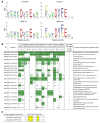
Figure 3. Identification of Be-dependent naturally occurring peptides that stimulate T cell hybridomas expressing the LKGGG CDR3β motif.
(A) Sequence logos summarizing hybridoma responses to the D5E8 PSL are shown, depicting amino acids fixed at the listed peptide position by hybridoma activity. Only amino acids with greater than 25% of maximal activity for each hybridoma are shown, and the height of each amino acid (single-letter code) corresponds to the activity of the peptide. If no amino acids are displayed, none met the threshold. The color of each letter groups amino acids by their chemical characteristics. (B) Response of 8 hybridomas expressing LKGGG CDR3β TCRs to naturally occurring peptides plus BeSO4 presented by HLA-DP2–transfected fibroblasts. Peptides are ordered by their biometrical analysis ranking and are included on the list only if at least one of the hybridomas demonstrated a positive response (>200 pg/mL IL-2 at 1.0 μg/mL peptide). Intensity of green color highlights peptides inducing the highest IL-2 secretion. The protein source of each peptide is indicated by its UniProt identification number and name. (C) UniProt number and amino acid sequence of related human chemokine peptides derived from CCL4 and CCL3 (biometrical analysis peptides BA001 and BA002, respectively).
Figure 4
Figure 4. Characterization of human chemokine-derived peptides that stimulate Be-specific T cell hybridomas expressing the LKGGG CDR3β CBD public motif.
(A) Dose-response curves to CCL4 peptides with single alanine substitutions are shown for representative hybridoma 8845-c3r. Data are plotted as the percentage of maximum IL-2 secretion against peptide concentration in the presence of BeSO4. The natural CCL4 peptide (WT) curve is drawn in red. (B) Summary of CCL4 peptide alanine scan for 4 T cell hybridomas. EC50 values (nM) are presented for a representative experiment and are color coded based on peptide activity (green, high; yellow, moderate; orange, negative). (C and D) Dose-response curves of representative hybridomas 8133-c4 (C) and 8845-c3 (D) in response to length variants of the CCL4 (C) and CCL3 (D) peptides are shown. Length and first amino acid (single-letter code) of each peptide is indicated, and EC50 values (nM) of each experiment are displayed. (E) EC50 values (nM) quantitating T cell hybridoma (n = 4) responses to CCL4 peptides with varying acidic amino acid composition (aspartic acid or glutamic acid) at positions p5 and p8 are shown. Data are representative of 2 separate experiments. nd, not determined due to low responses.
Figure 5
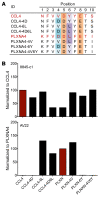
Figure 5. An LKGGG CDR3β TCR crossreactive to CCL4 and PLXNA4 peptides.
(A) Set of CCL4 and PLXNA4 WT (red) and variant peptides that differed at the p4 and p6 positions. Colors highlight D5E8 and amino acids that vary at p4 and p6. (B) IL-2 production by hybridomas 8845-c1 (top) and AV22 (bottom) in response to CCL4 and PLXNA4 WT and variant peptides presented by HLA-DP2–transfected fibroblasts at 300 ng/mL in the presence of BeSO4. Data were normalized to WT peptides (CCL4 for 8845-c1; PLXNA4 for AV22) and are representative of 2 experiments done in duplicate.
Figure 6
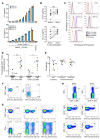
Figure 6. Validation of Be-modified CCL4 and CCL3 as antigenic targets of CD4+ T cells in CBD.
(A) IL-2 response (mean ± SD pg/ml) of LKGGG CDR3β hybridomas to recombinant CCL4 (upper) and CCL3 (lower) proteins is displayed. Results are representative of 2 experiments. (B) In vitro Be-induced secretion of CCL4 (upper) and CCL3 (lower) from BAL cells isolated from CBD patients (n = 13) is shown. Chemokines were assessed by ELISA in duplicate. Dotted lines represent ELISA limits of detection. Statistical significance was determined using Wilcoxon’s rank sum test. ***P < 0.001. (C) Staining of T cell hybridomas with BeSO4-saturated HLA-DP2 tetramers. (D) Summary of HLA-DP2 tetramer staining of ex vivo BAL cells from BeS (n = 7–8) and CBD (n = 10) subjects. For HLA-DP2+ CBD patients, each subject is represented by a different color/symbol combination. Statistical significance was determined using a Mann-Whitney U test. *P < 0.05; **P < 0.01. (E) Summary of HLA-DP2 tetramer and IFN-γ ICS of ex vivo BAL cells from HLA-DP2+ CBD patients. Color/symbol combinations used for patients match those in D. Percentages (mean ± SEM) of CD4+ T cells expressing IFN-γ and the fraction of CD4+ T cells expressing IFN-γ that also bind each tetramer are shown. Gray circles represent patients with no evidence of active disease. (F) Flow cytometric analysis of HLA-DP2 tetramer and intracellular IFN-γ staining of ex vivo BAL cells from an HLA-DP2 CBD patient is displayed. (G) Flow cytometric density plots showing the frequency of CD4+ T cells from CBD patient 8845 that bind to HLA-DP2–CLIP (upper left), HLA-DP2–CCL4/Be (upper middle), and HLA-DP2–CCL3/Be tetramers. Density plots in lower panels depict tetramer staining in relation to IFN-γ expression induced in CD4+ T cells after stimulation with BeSO4 (lower left, medium control). (H) Tetramer/ICS staining of ex vivo BAL cells from CBD patients 8845 (left) and 8133 (right) 5 years after single-cell TCR studies and flow cytometric analysis of BAL cells. Cells were stained for intracellular IFN-γ (upper panels), HLA-DP2–CCL3/Be (middle panels), and HLA-DP2–PLXN/Be tetramers (lower panels).
Figure 7
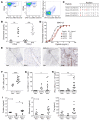
Figure 7. HLA-DP2 transgenic mice and 8845-c3 TCR retrogenic HLA-DP2 mice replicate features of CBD.
(A) Flow cytometric density plots illustrating representative HLA-DP2–CCL4/Be (left), HLA-DP2–CCL3/Be (middle), and cotetramer staining (right) of HLA-DP2 transgenic C57BL/6 mouse BAL cells treated with BeO. (B) CCL4 and CCL3 chemokines present in the BAL fluid of BeO-treated C57BL/6 mice. BAL fluid from control (PBS: CCL4, n = 4; CCL3, n = 12) and treated (BeO: CCL4, n = 7; CCL3 n = 12) mice was assessed by ELISA. (C and D) Amino acid differences (red) between orthologous human and murine Be-dependent CCL4 and CCL3 epitopes (C) and dose-response curves of hybridoma 8845-c3 (D) comparing its activity to the human and murine peptides in the presence of BeSO4. (E) Representative CD4 staining of lungs from BeO-treated control DV-13 TCR (left panels) and Be-specific 8845-c3 TCR (right panels) retrogenic RAG–/– B6 mice showing CD4 T cell infiltrates. (F) Quantification of CD4+ T cells in lung tissue of BeO-treated DV-13 (n = 6) and 8845-c3 (n = 14) retrogenic mice. (G and H) Summary of IL-2– (G) and IFN-γ–secreting (H) T cells in spleen of PBS-exposed HLA-DP2 Tg mice (IL-2, n = 7; IFN-γ, n = 7) and BeO-exposed HLA-DP2 Tg (IL-2, n = 7; IFN-γ, n = 7) and 8845-c3 TCR retrogenic is shown (IL-2, n = 10; IFN-γ, n = 14). ELISPOT data are expressed as the mean ± SEM spot-forming units (SFUs) per 1 × 10⁶ cells. (I) Total protein (left), albumin (middle), and podoplanin (T1a, right) measured by ELISA from BAL fluid of HLA-DP2 Tg C57BL/6 mice treated with PBS (n = 3) and BeO (n = 11) and BeO-treated 8845-c3 TCR retrogenic mice (n = 8). Statistical significance was determined using a Mann-Whitney U test (B and F) and 1-way ANOVA (GI). Bars for all data plots represent mean values ± SEM. *P < 0.05; ** P < 0.01; *** P < 0.001; **** P < 0.0001, determined by 1-way ANOVA. Data are pooled from separate experiments.
Figure 8
Figure 8. LPS increased chemokine/Be-specific CD4+ T cells and inflammation in BeO-exposed HLA-DP2 Tg mice.
(A) CCL4 (left) and CCL3 (right) measured by ELISA (pg/ml) in the BAL fluid of FVB/N HLA-DP2 Tg mice. After standard sensitization with BeO, mice were boosted on day 14 with either BeO (n = 5) or BeO plus LPS (10 μg; n = 5) and sacrificed 24 hours later. (B) Frequency of Be-specific CD4+ T cells at day 21 in the lungs of PBS- (n = 4), BeO- (n = 5), and BeO/LPS-treated (n = 5) HLA-DP2 Tg mice measured by IFN-γ (left) and IL-2 (right) ELISPOT is shown. Data are expressed as the mean ± SEM spot-forming units per 4 × 10⁴ cells. (C) Shown are the frequency (left) and total number (right) of HLA-DP2–CCL4/Be tetramer staining CD4+ T cells isolated from the lungs of PBS- (n = 4), BeO (n = 5), and BeO/LPS-treated mice (n = 5) sacrificed on day 21. (D) Flow cytometric density plots illustrating representative HLA-DP2–CCL4/Be tetramer staining of lung cells derived from PBS- (left), BeO- (middle), and BeO/LPS-exposed (right) HLA-DP2 Tg mice sacrificed on day 21. (E) Frequency of HLA-DP2–plexin A/Be tetramer staining CD4+ T cells from the lungs of mice treated as indicated (PBS, n = 4; BeO, n = 5; BeO/LPS, n = 5). (F) Representative H&E staining of lungs from BeO-treated (upper panels) and BeO/LPS-treated (lower panels) mice showing mononuclear cell infiltrates at low and higher magnification. (G) Quantification of mononuclear cells in lung tissue of HLA-DP2 Tg mice treated as indicated (PBS, n = 3; BeO n = 4; BeO/LPS, n = 4). Bars for all data plots represent the mean ± SEM. *P < 0.05; **P < 0.01; ***P < 0.001; ****P < 0.0001, Mann-Whitney U test (A) and 1-way ANOVA (B, C, E, and G). Data are representative of 2 separate experiments.

Comment in

Similar articles

Cited by

References

    1. Dendrou CA, et al. HLA variation and disease. Nat Rev Immunol. 2018;18(5):325–339. doi: 10.1038/nri.2017.143. - DOI - PubMed
    1. Jurewicz MM, Stern LJ. Class II MHC antigen processing in immune tolerance and inflammation. Immunogenetics. 2019;71(3):171–187. doi: 10.1007/s00251-018-1095-x. - DOI - PMC - PubMed
    1. Vizcaino JA, et al. The Human Immunopeptidome Project: a roadmap to predict and treat immune diseases. Mol Cell Proteomics. 2020;19(1):31–49. doi: 10.1074/mcp.R119.001743. - DOI - PMC - PubMed
    1. Delong T, et al. Pathogenic CD4 T cells in type 1 diabetes recognize epitopes formed by peptide fusion. Science. 2016;351(6274):711–714. doi: 10.1126/science.aad2791. - DOI - PMC - PubMed
    1. Faridi P, et al. A subset of HLA-I peptides are not genomically templated: Evidence for cis- and trans-spliced peptide ligands. Sci Immunol. 2018;3(28):eaar3947. doi: 10.1126/sciimmunol.aar3947. - DOI - PubMed

Publication types

MeSH terms