. 2021 Dec 1;41(4):431-441.
doi: 10.1097/WNO.0000000000001203.

Peripapillary Hyper-reflective Ovoid Mass-like Structure (PHOMS): An Optical Coherence Tomography Marker of Axoplasmic Stasis in the Optic Nerve Head

Affiliations

Peripapillary Hyper-reflective Ovoid Mass-like Structure (PHOMS): An Optical Coherence Tomography Marker of Axoplasmic Stasis in the Optic Nerve Head

J Alexander Fraser et al. J Neuroophthalmol. .

Abstract

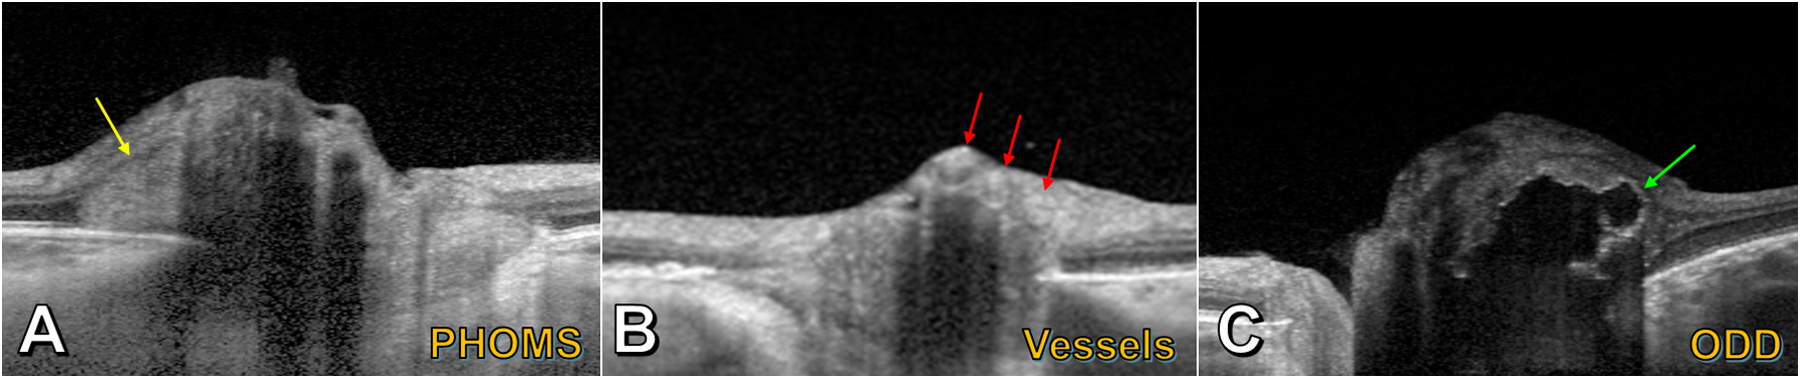
Background: With the development and widespread adoption of spectral-domain optical coherence tomography (OCT), peripapillary hyper-reflective ovoid mass-like structures (PHOMS) have become a frequent OCT finding in neuro-ophthalmic practice. Although originally assumed to represent a form of buried optic disc drusen (ODD), PHOMS differ from ODD in many important ways. The histopathological underpinnings of PHOMS are now becoming more clearly understood.

Evidence acquisition: Review of literature.

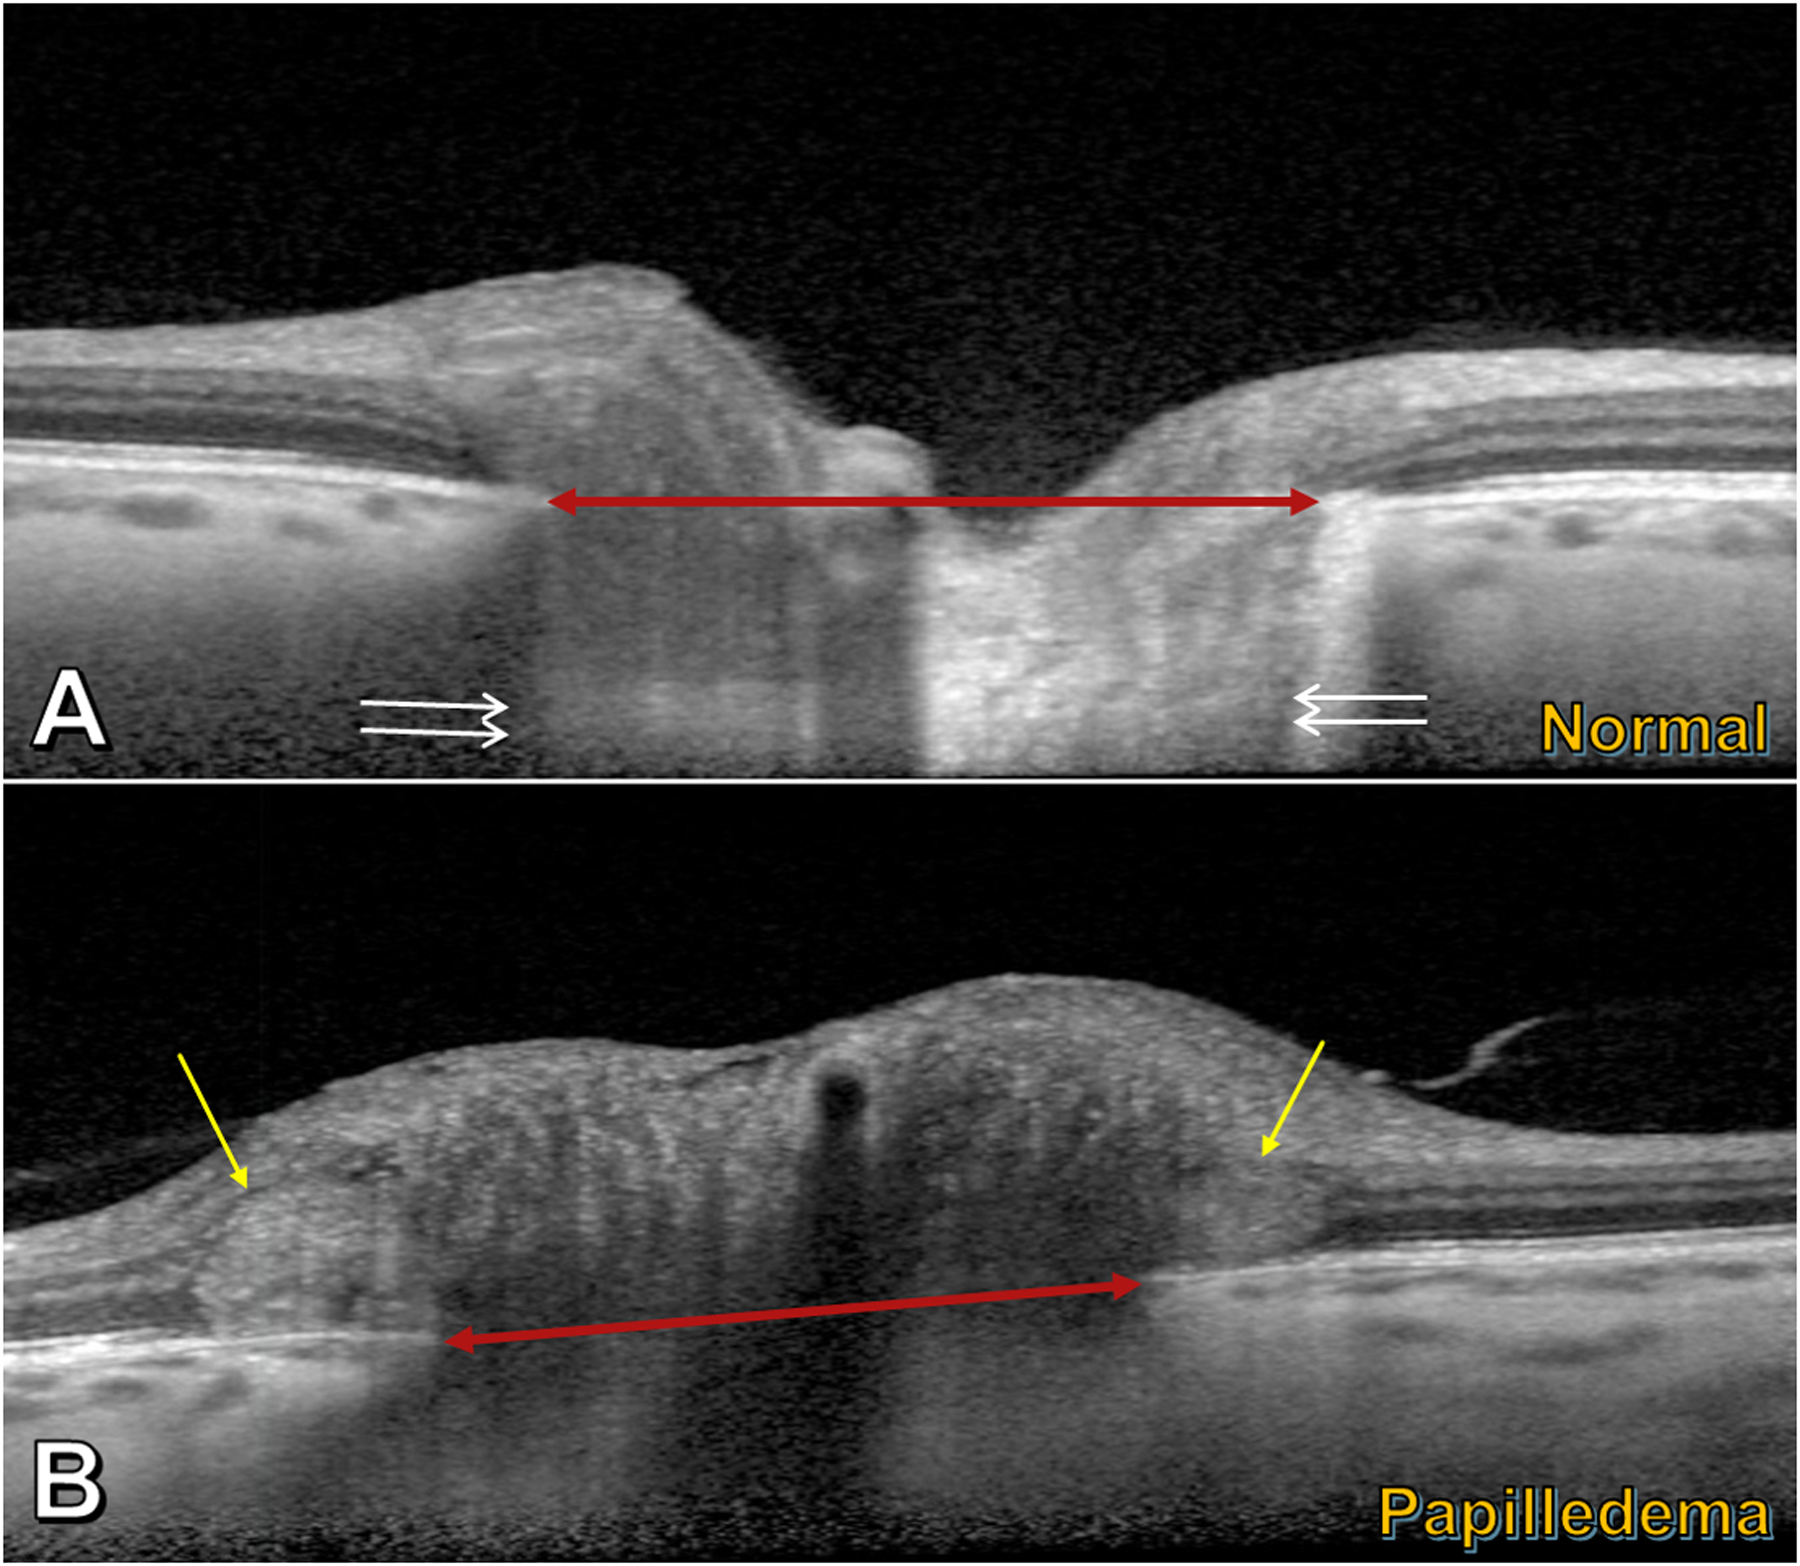
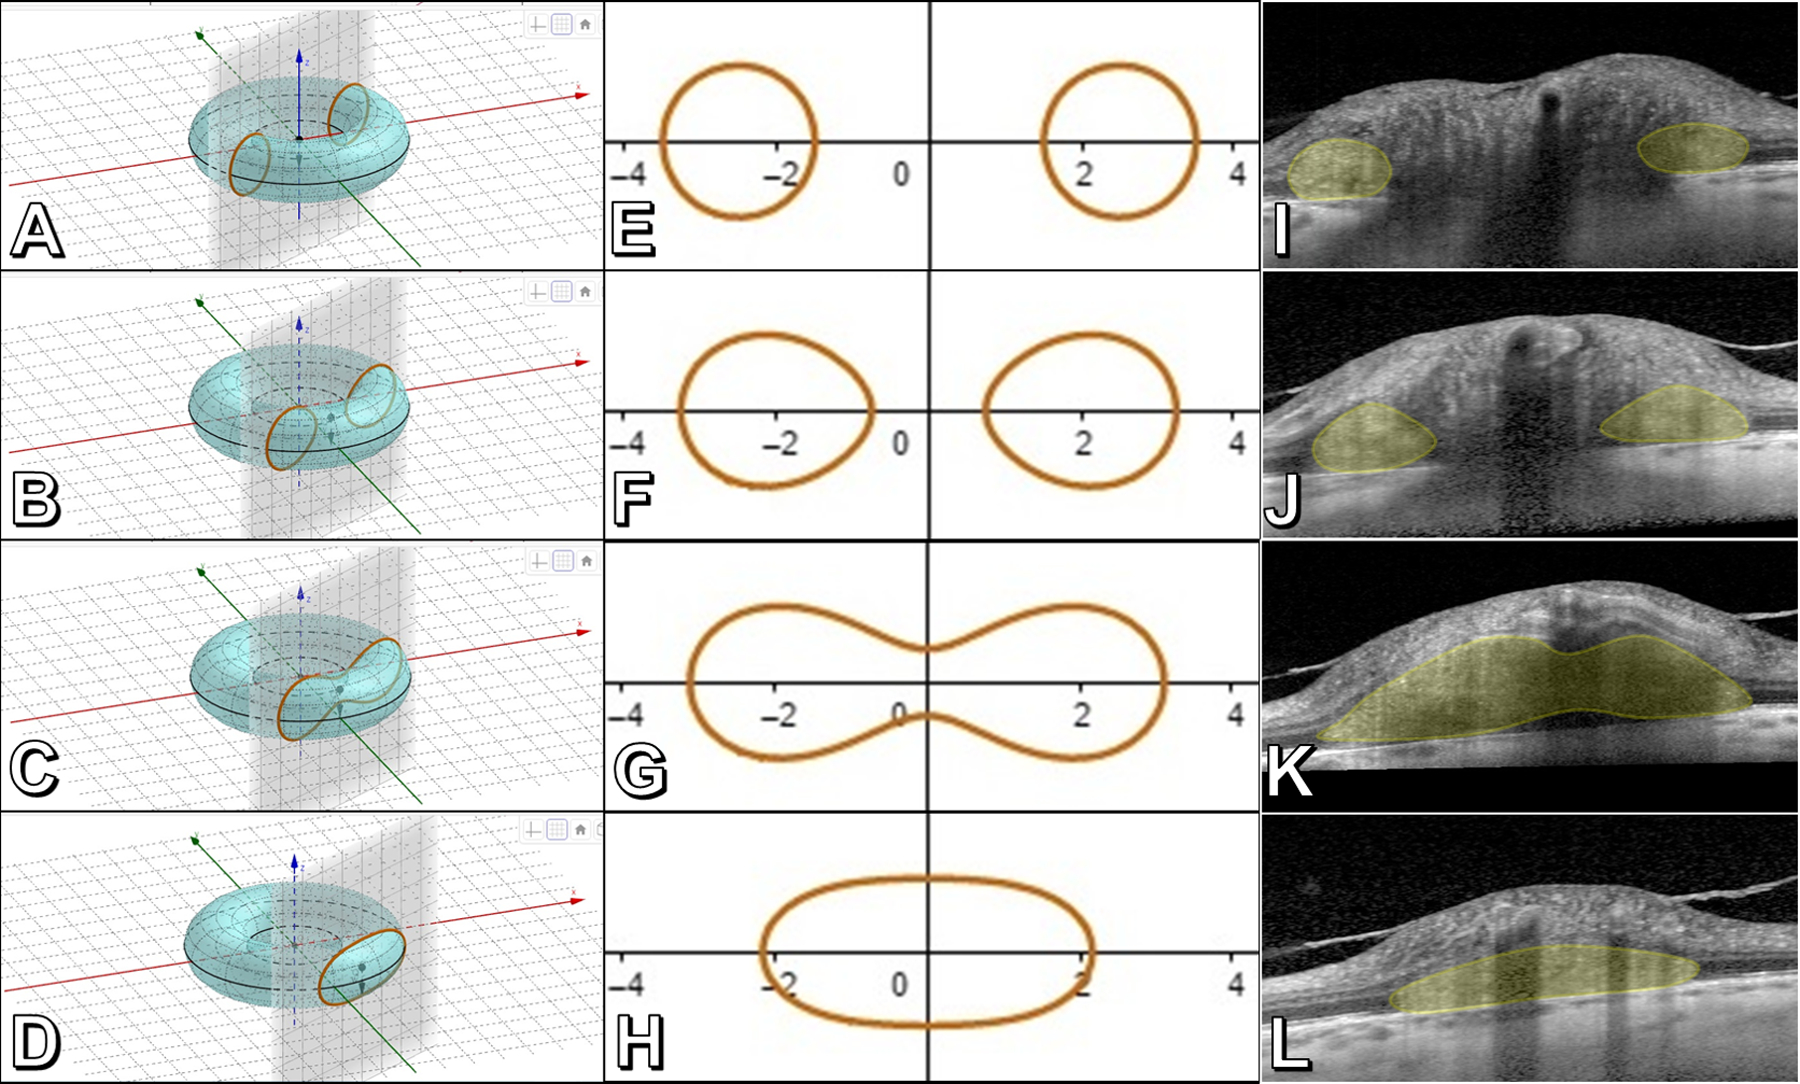
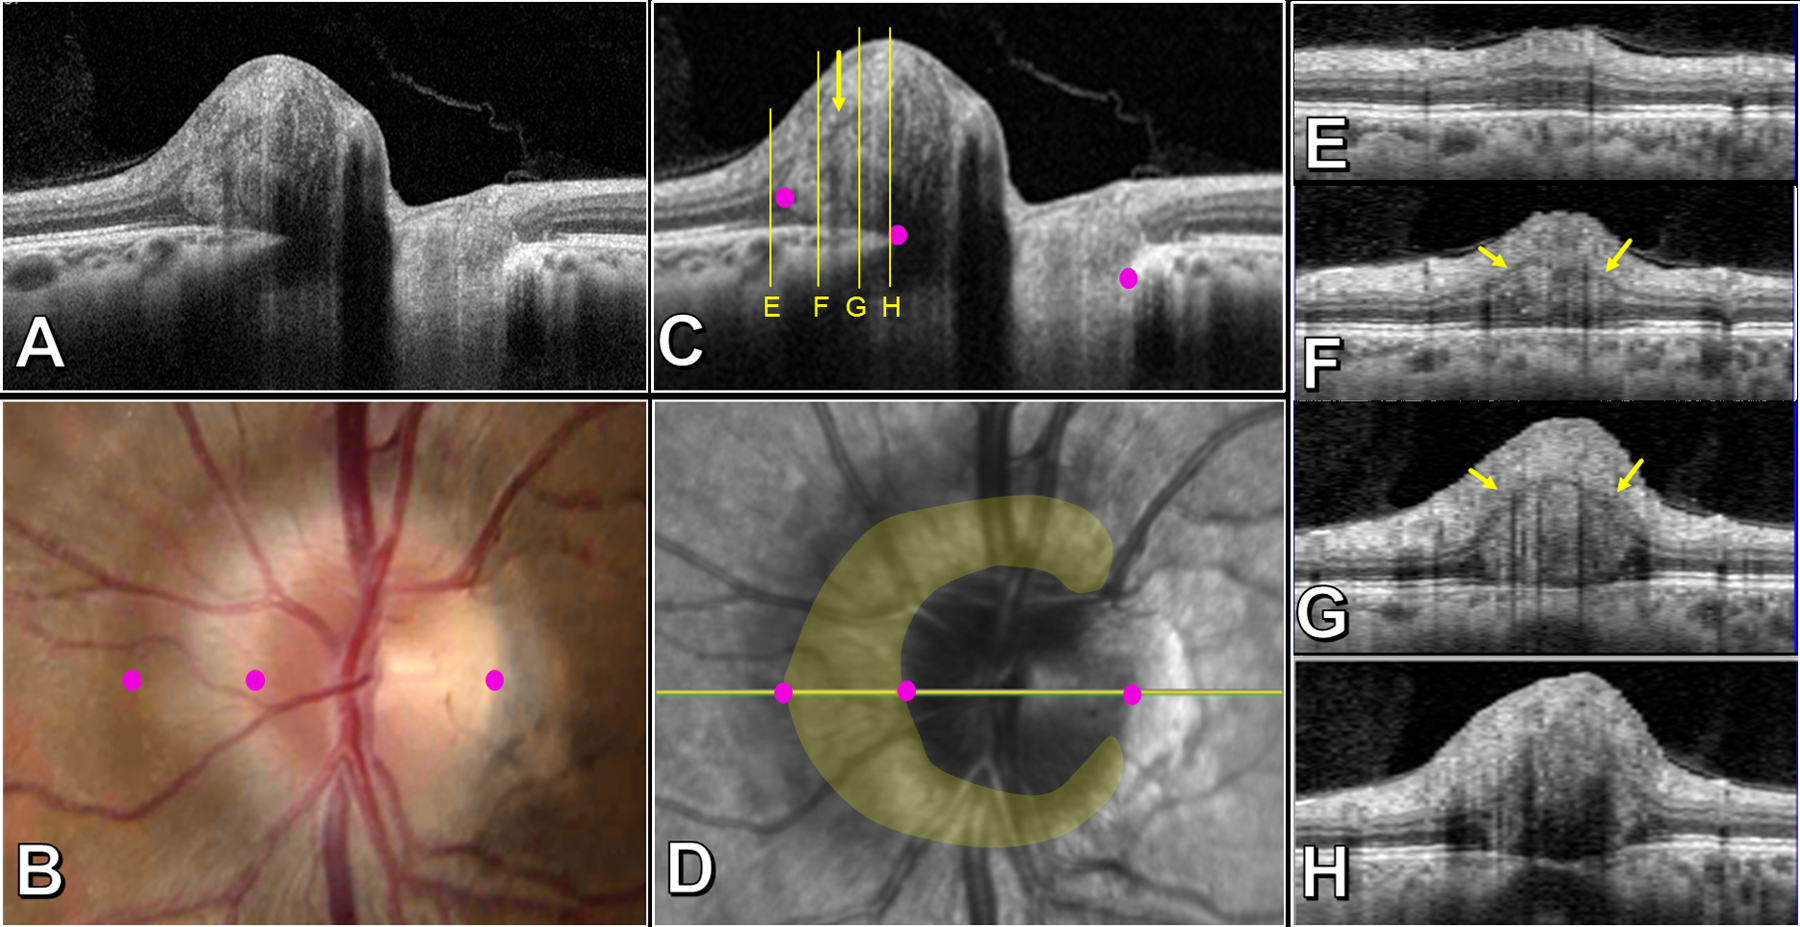
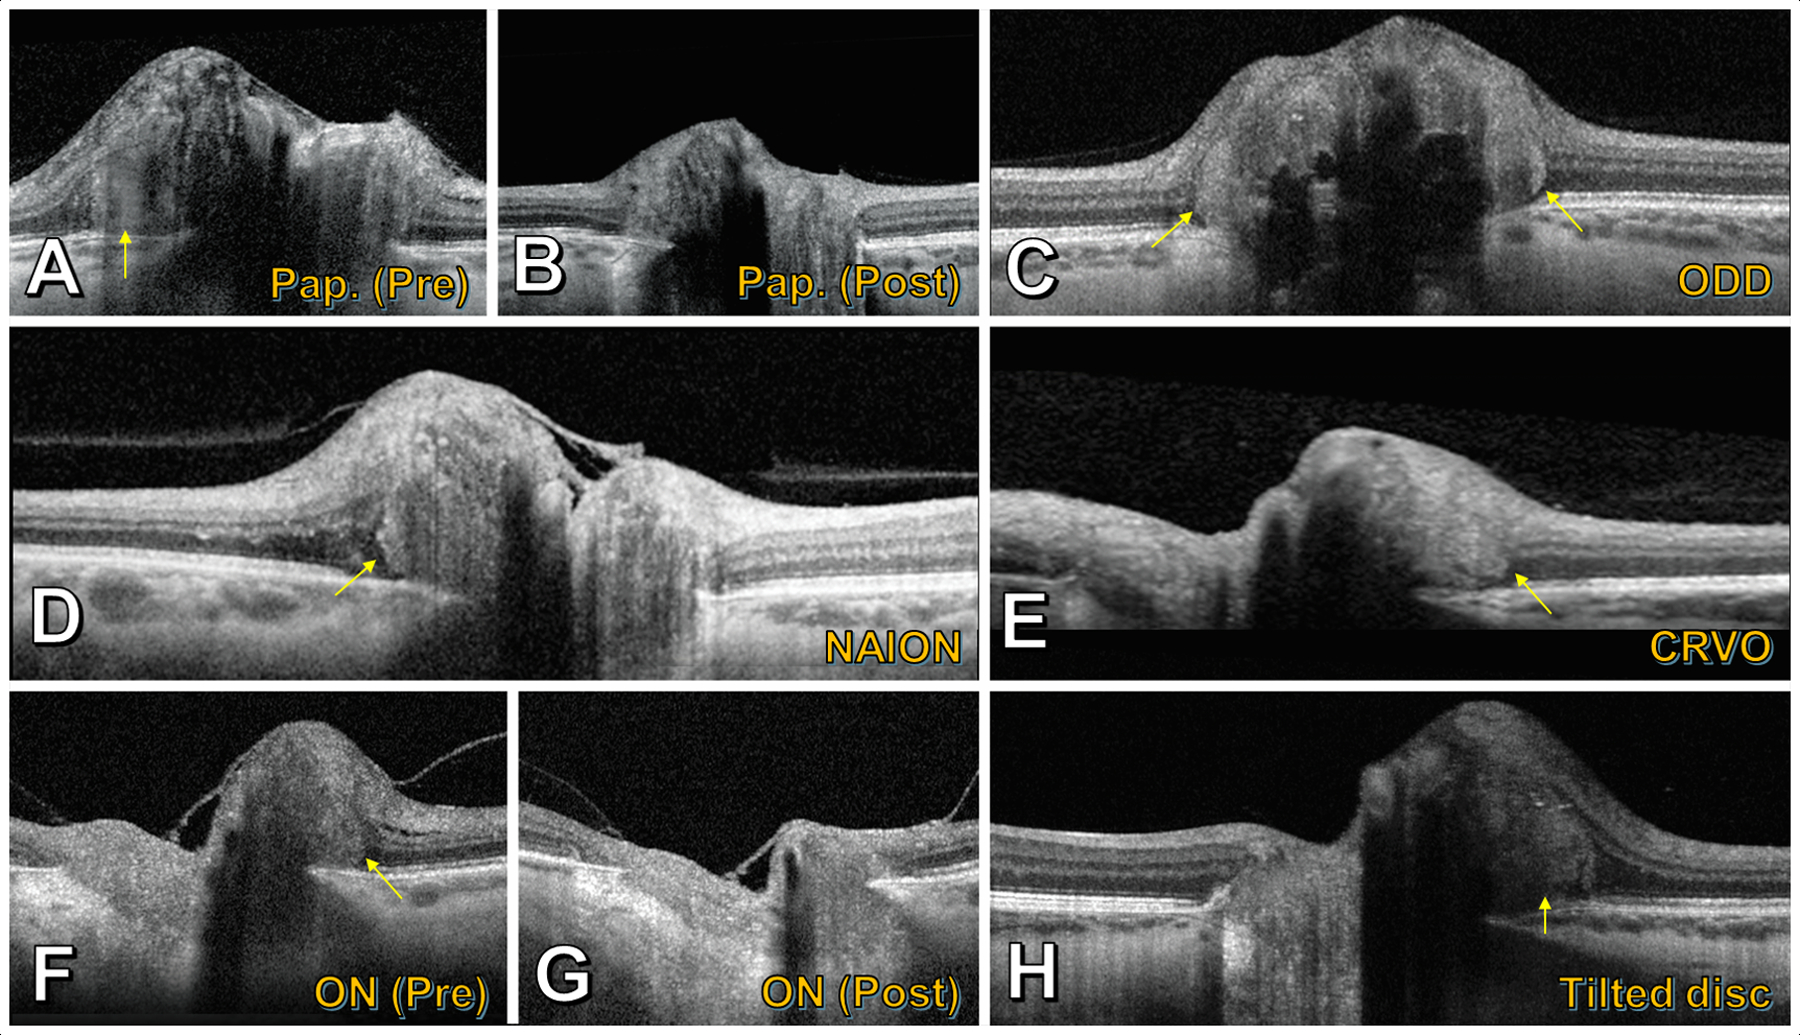
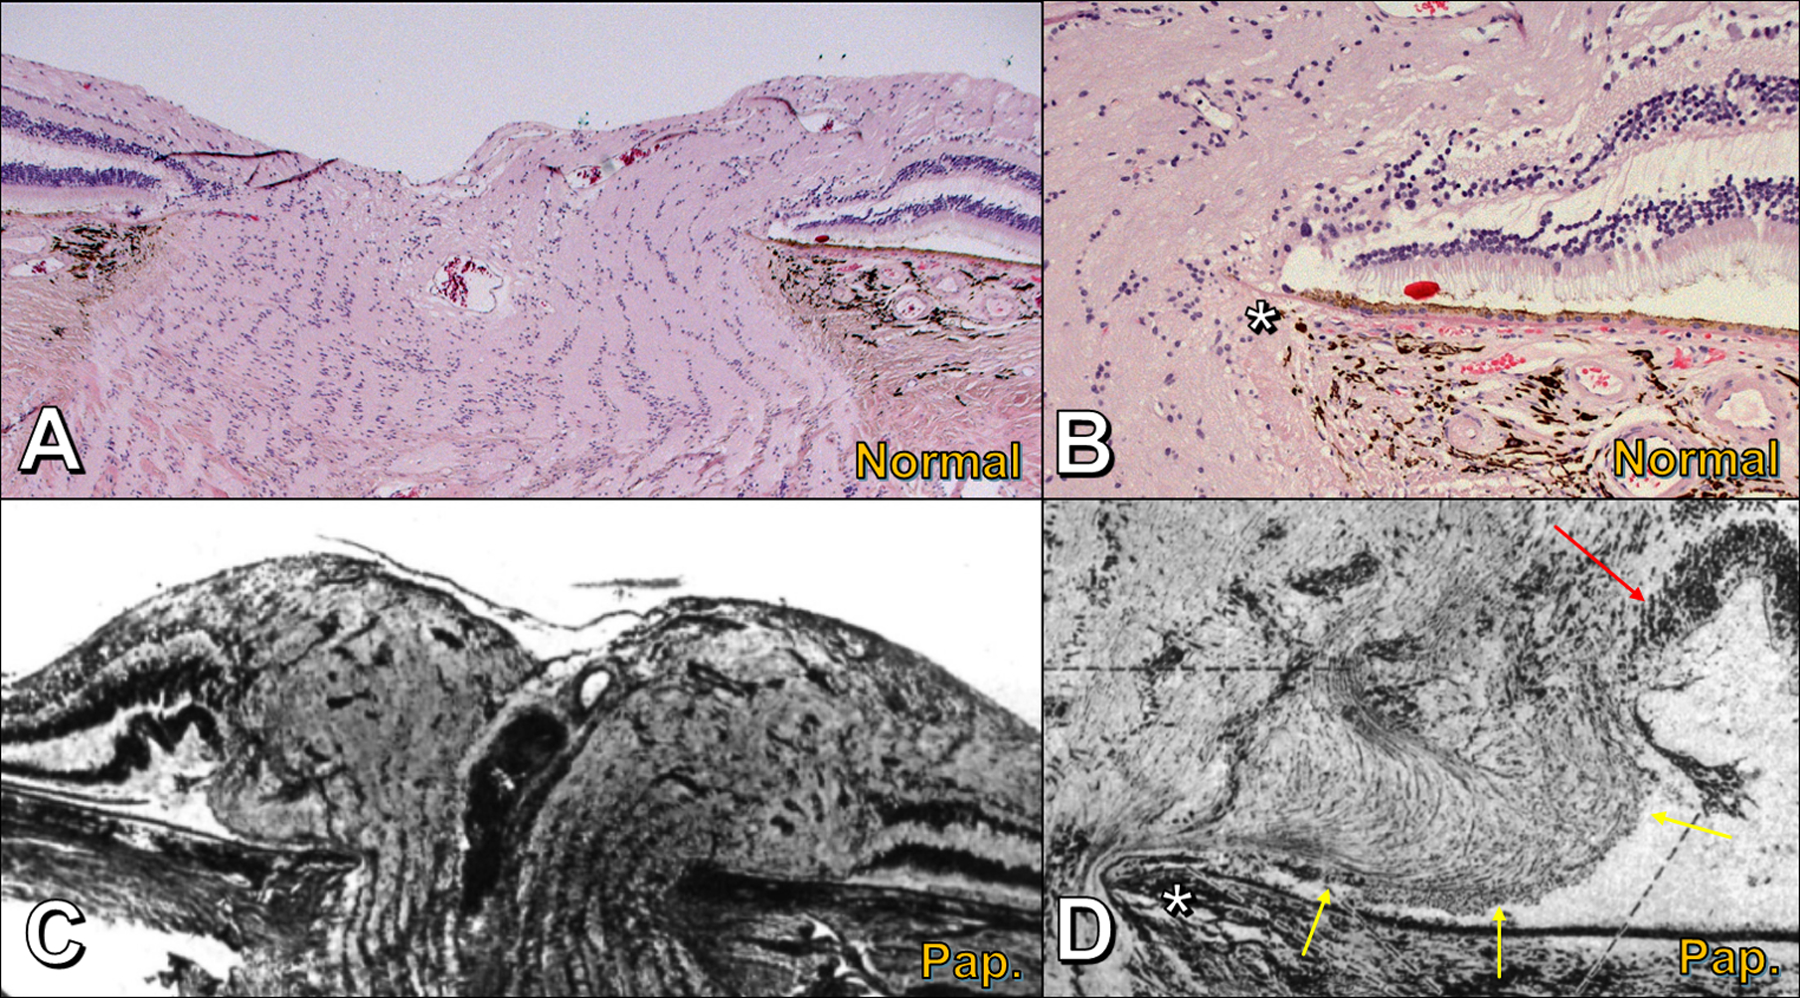
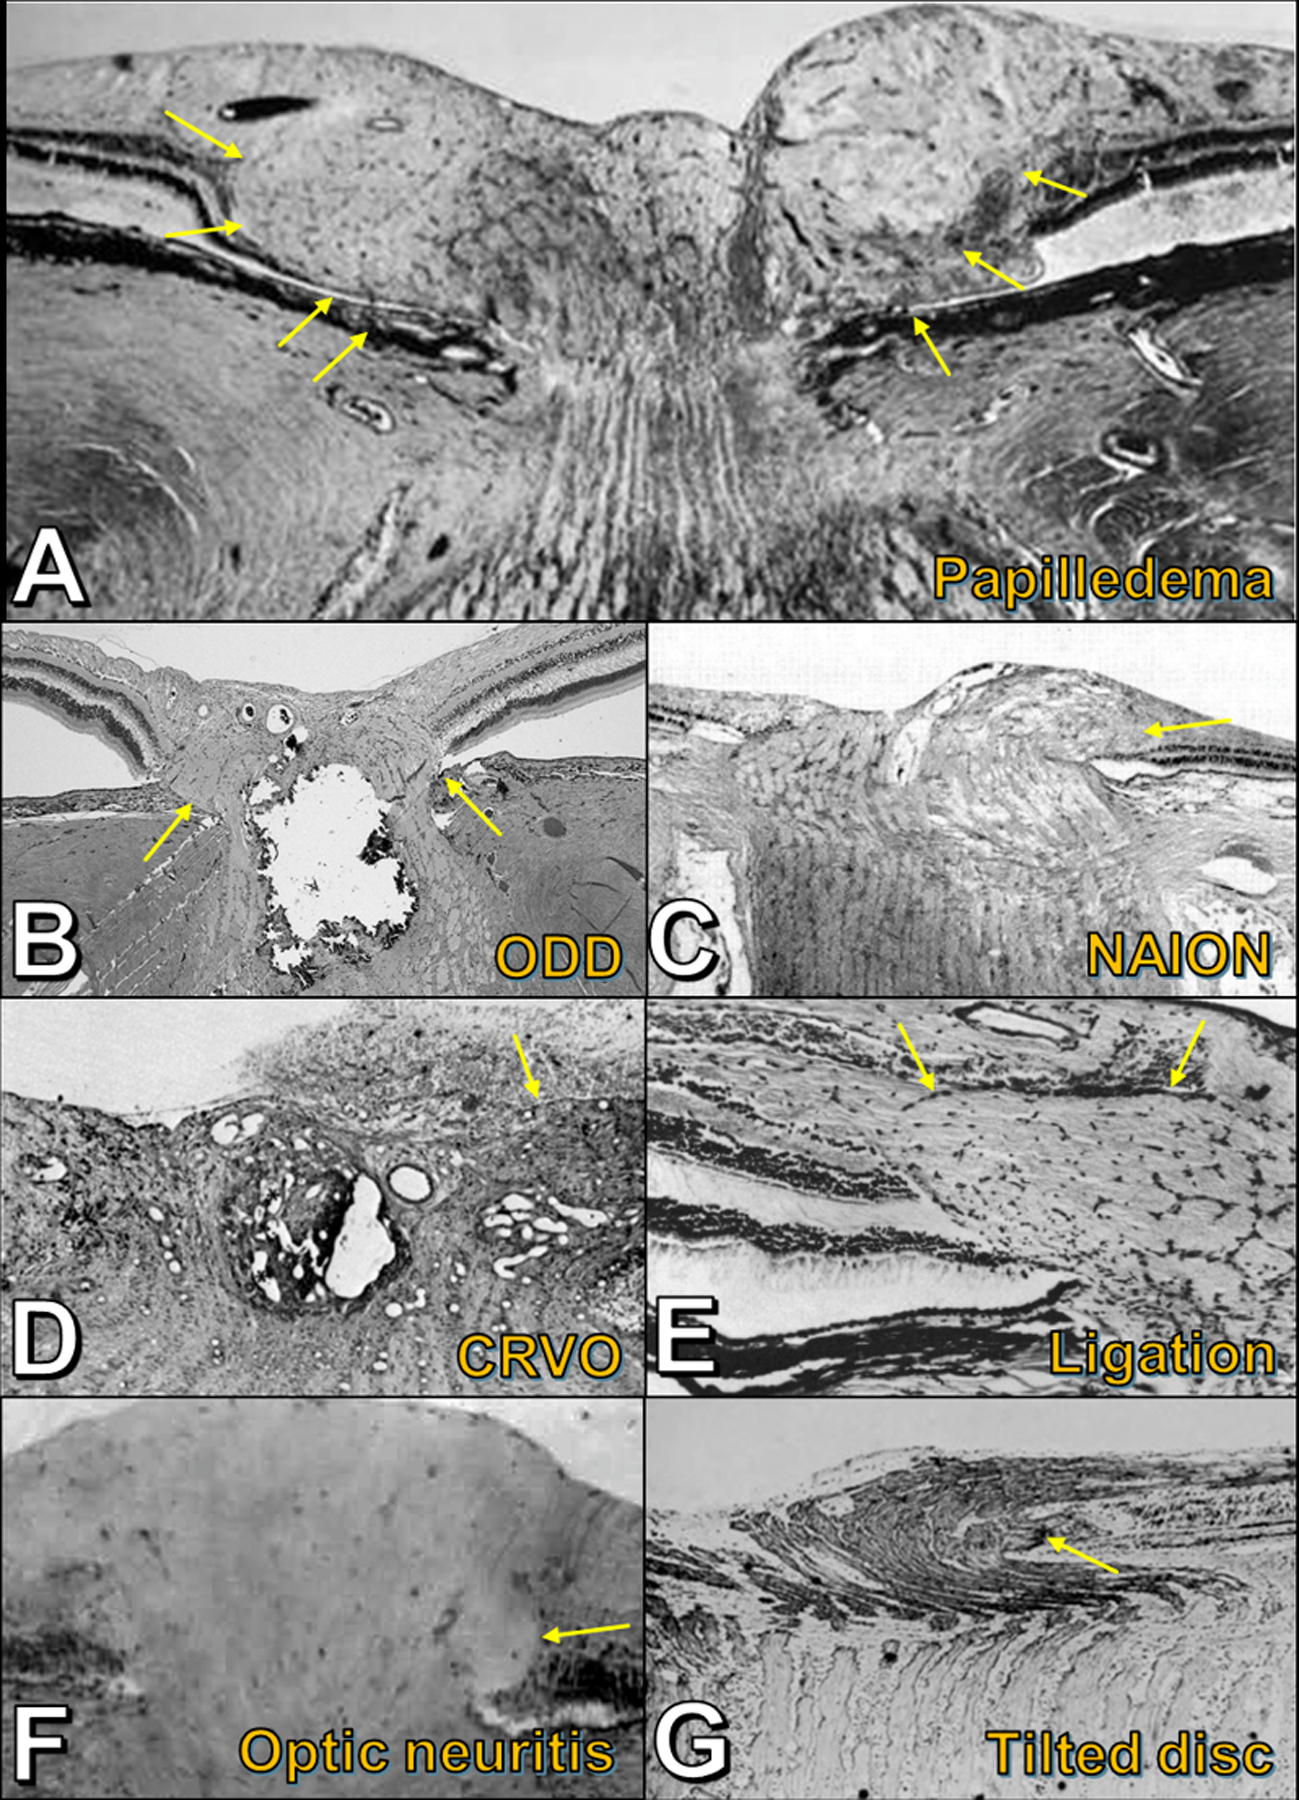
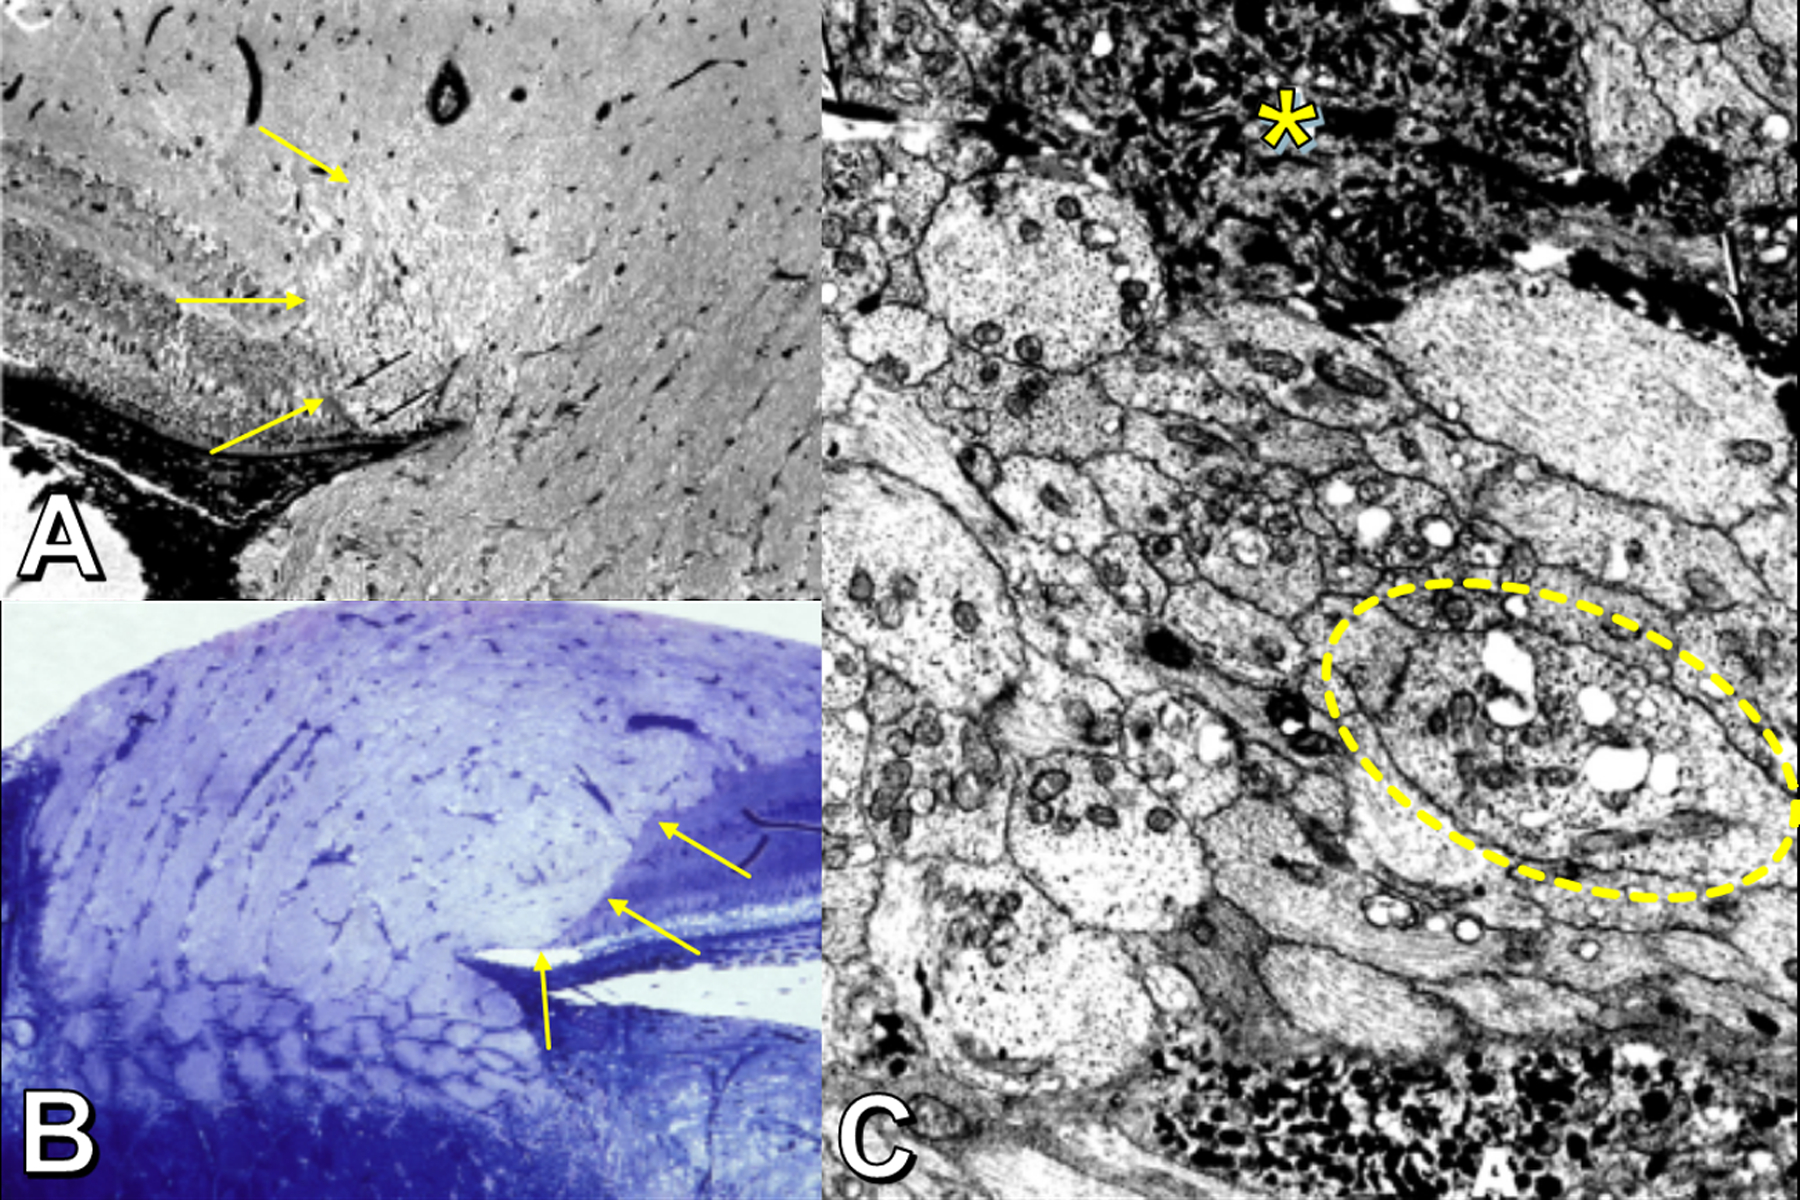
Results: PHOMS can be broadly classified as disk edema-associated PHOMS, ODD-associated PHOMS, or anomalous disk-associated PHOMS. PHOMS are seen in many conditions, including papilledema, nonarteritic anterior ischemic optic neuropathy, central retinal vein occlusion, acute demyelinating optic neuritis, ODD, and tilted disks (myopic obliquely inserted disks) and in many cases resolve along with the underlying condition. The histopathological study of these diverse entities reveals the common feature of a bulge of optic nerve fibers herniating centrifugally over Bruch membrane opening into the peripapillary space, correlating exactly with the location, shape, and space-occupying nature of PHOMS on OCT. Because of the radial symmetry of these herniating optic nerve fibers, PHOMS are best thought of as a complete or partial torus (i.e., donut) in 3 dimensions.

Conclusions: PHOMS are a common but nonspecific OCT marker of axoplasmic stasis in the optic nerve head. They are not themselves ODD or ODD precursors, although they can be seen in association with ODD and a wide spectrum of other conditions. They do not exclude papilledema and often accompany it. The circumferential extent and characteristic 3D toroidal nature of a PHOMS are best appreciated by scrolling through consecutive OCT images.


Conflict of interest statement

The authors report no conflicts of interest.

Figures

Figure 1 –
Figure 1 –
Enhanced-depth imaging OCT transecting the optic nerve head. A) Normal eye: features include Bruch’s membrane opening (BMO) (red double arrowhead) and lamina cribrosa (between pairs of white arrows). B) Papilledematous eye (in a patient with idiopathic intracranial hypertension): PHOMS (yellow arrows) are seen in the peripapillary region on either side of BMO (red double arrowhead), just above the Bruch’s membrane/retinal pigment epithelium complex; the PHOMS are hyperreflective (light grey), stereotypically ovoid in shape, and deflect the retinal layers upwards and laterally.
Figure 2 –
Figure 2 –
The toroidal nature of a PHOMS. Panels A-D: An idealized torus (i.e., donut) transected at different distances from the center by a plane perpendicular to the torus’ central axis, representing B-scan OCT “slices” through a PHOMS. Panels E-H: Corresponding “toric sections” (known as “Cassini’s ovals”) arising from each idealized cut in A-D. Panels I-L: Real-world B-scan EDI-OCT slices though a papilledematous optic disc at the distances depicted in panels A-D, confirming the toroidal nature of a PHOMS (yellow shading). (Panels A-H created using the Geogebra applet at https://lucamoroni.it/simulations/intersection-torus-plane-simulation/ (13))
Figure 3 –
Figure 3 –
Salient features of a PHOMS in a patient with papilledema, left eye. Transverse axial OCT (A and C), optic disc photo (B), confocal scanning laser ophthalmoscopic image (D), and sagittal cross-sectional OCTs through the nasal optic disc (E-H). The corresponding margins of the Bruch’s membrane opening and nasal edge of the PHOMS are identified with magenta dots in images B, C, D. The yellow overlay in D shows that the PHOMS is a C-shaped partial torus that surrounds the disc nasally, superiorly, and inferiorly, sparing the temporal quadrant. The nasal bulge of the PHOMS abuts and splays the surrounding retina (E-H): the inner nuclear layer (INL) is displaced superiorly and appears as a fine hypodense line that forms the superior border of the PHOMS (small yellow arrows in C, F, G); panel E demonstrates widening of the outer nuclear layer just beyond the PHOMS’ border. Panel H depicts the junction between PHOMS and RNFL where the INL is no longer visible. As the level of the image slice in E-H approaches the center of the disc, the deflection of overlying retinal layers, likened to a “ski slope” becomes steeper; tangential B-scans may therefore underestimate the true mass effect of the PHOMS on the overlying retinal layers.
Figure 4 –
Figure 4 –
Enhanced-depth imaging OCT of PHOMS and mimics. A) A PHOMS (yellow arrow) in the peripapillary region appears hyperreflective and deflects the retinal layers upwards and laterally; though the left part of the PHOMS appears ovoid, the right part of the PHOMS is obscured by an overlying shadow. B) Blood vessels (red arrows) appear as superficial circular structures casting long dark shadows; their tubular 3D structures are revealed by scrolling through consecutive OCT slices. C) A large lobulated optic disc drusen (ODD) (green arrow) is identifiable by its hyperreflective “shell” and hyporeflective core.
Figure 5 –
Figure 5 –
Enhanced-depth imaging OCT depicting PHOMS (yellow arrows) in a spectrum of conditions. A) Patient with papilledema from idiopathic intracranial hypertension, who had B) significant reduction in the PHOMS after six months of weight loss and acetazolamide. C) Optic disc drusen. D) Acute nonarteritic anterior ischemic optic neuropathy. E) Acute central retinal vein occlusion. F) Patient with isolated acute demyelinating optic neuritis, who had G) significant reduction in the PHOMS following treatment with high-dose corticosteroids. H) Tilted optic disc syndrome.
Figure 6 –
Figure 6 –
Histomorphology of the optic nerve head; compare normal optic nerve head (A,B) to papilledema (C,D). A) Normal optic nerve head; note the relatively flat, layered architecture of the retinal layers extending right to Bruch’s membrane opening (BMO) and narrowing of scleral canal anterior to lamina cribrosa. B) Normal optic nerve head, peripapillary region; optic nerve fibers bend smoothly around Bruch’s membrane opening (asterisk) in a gentle C-shaped configuration. C) Papilledema; compared to panel A, the peripapillary retinal layers are displaced laterally (right) or raised and folded (left) by the distended and tortuous prelaminar optic nerve fibers; adapted from (27). D) Papilledema, peripapillary region; compared to panel B, herniating optic nerve fibers above Bruch’s membrane opening (asterisk) are bent into an S-shaped configuration; the bottom part of the S forms an ovoid mass-like structure (yellow arrows) that elevates and folds the neighboring retinal layers (red arrow); adapted from (27).
Figure 7 –
Figure 7 –
Histopathology in a spectrum of conditions, showing laterally bulging optic nerve fibers (yellow arrows) in response to axoplasmic stasis. A) Papilledema. B) Optic disc drusen. C) Acute nonarteritic anterior ischemic optic neuropathy. D) Acute central retinal vein occlusion. E) Experimental ligation of retrobulbar optic nerve (simian model). F) Acute demyelinating optic neuritis (juvenile guinea pig model). G) Tilted optic disc. Figures adapted with permission as follows: A (44); C (34); D (35); E (36); F (37); G (44).
Figure 8 –
Figure 8 –
Features of axoplasmic stasis (experimental rhesus model of papilledema). Panels A and B: Histopathology showing lateral bulge of optic nerve fibers (yellow arrows); axons appear vacuolated, abut the retinal pigment epithelium, and displace the retina laterally. Panel C: Electron microscopy showing swollen and vacuolated axons (one shown within dotted oval) with disrupted neurotubules and numerous disorganized mitochondria. The most swollen axons (asterisk) contain large accumulations of giant mitochondria with irregularly arranged cristae and laminated dense bodies (asterisk). Radiotracer studies (not depicted) show obstruction of axonal transport at the level of the lamina cribrosa. Adapted with permission from (26).

Similar articles

Cited by

References

    1. Johnson LN, Diehl ML, Hamm CW, Sommerville DN, Petroski GF. Differentiating optic disc edema from optic nerve head drusen on optical coherence tomography. Arch Ophthalmol 2009; 127:45–49. - PubMed
    1. Flores-Rodriguez P, Gili P, Martin-Rios MD. Sensitivity and specificity of time-domain and spectral-domain optical coherence tomography in differentiating optic nerve head drusen and optic disc oedema. Ophthalmic Physiol Opt 2012; 32:213–221. - PubMed
    1. Wojtkowski M, Bajraszewski T, Gorczynska I, Targowski P, Kowalczyk A, Wasilewski W, Radzewicz C. Ophthalmic imaging by spectral optical coherence tomography. Am J Ophthalmol 2004; 138:412–419. - PubMed
    1. Nassif N, Cense B, Park BH, Yun SH, Chen TC, Bouma BE, Tearney GJ, de Boer JF. In vivo human retinal imaging by ultrahigh-speed spectral domain optical coherence tomography. Opt Lett 2004; 29:480–482. - PubMed
    1. Spaide RF, Koizumi H, Pozonni MC. Enhanced depth imaging spectral-domain optic coherence tomography. Am J Ophthalmol 2008; 146:496–500. - PubMed

MeSH terms