. 2021 Feb 25;19(2):e3001091.
doi: 10.1371/journal.pbio.3001091. eCollection 2021 Feb.

A plasmid DNA-launched SARS-CoV-2 reverse genetics system and coronavirus toolkit for COVID-19 research

Suzannah J Rihn  1 Andres Merits  2 Siddharth Bakshi  1 Matthew L Turnbull  1 Arthur Wickenhagen  1 Akira J T Alexander  1 Carla Baillie  3 Benjamin Brennan  1 Fiona Brown  3 Kirstyn Brunker  4 Steven R Bryden  1 Kerry A Burness  3 Stephen Carmichael  1 Sarah J Cole  1 Vanessa M Cowton  1 Paul Davies  3 Chris Davis  1 Giuditta De Lorenzo  1 Claire L Donald  1 Mark Dorward  3 James I Dunlop  1 Matthew Elliott  3 Mazigh Fares  1 Ana da Silva Filipe  1 Joseph R Freitas  5 Wilhelm Furnon  1 Rommel J Gestuveo  1   6 Anna Geyer  3 Daniel Giesel  3 Daniel M Goldfarb  1 Nicola Goodman  3 Rory Gunson  7 C James Hastie  3 Vanessa Herder  1 Joseph Hughes  1 Clare Johnson  3 Natasha Johnson  1 Alain Kohl  1 Karen Kerr  1 Hannah Leech  3 Laura Sandra Lello  2 Kathy Li  1 Gauthier Lieber  1 Xiang Liu  5 Rajendra Lingala  8 Colin Loney  1 Daniel Mair  1 Marion J McElwee  1 Steven McFarlane  1 Jenna Nichols  1 Kyriaki Nomikou  1 Anne Orr  1 Richard J Orton  1 Massimo Palmarini  1 Yasmin A Parr  1 Rute Maria Pinto  1 Samantha Raggett  3 Elaine Reid  3 David L Robertson  1 Jamie Royle  1 Natalia Cameron-Ruiz  1 James G Shepherd  1 Katherine Smollett  1 Douglas G Stewart  1 Meredith Stewart  1 Elena Sugrue  1 Agnieszka M Szemiel  1 Aislynn Taggart  1 Emma C Thomson  1 Lily Tong  1 Leah S Torrie  9 Rachel Toth  3 Margus Varjak  1 Sainan Wang  2 Stuart G Wilkinson  3 Paul G Wyatt  9 Eva Zusinaite  2 Dario R Alessi  3 Arvind H Patel  1 Ali Zaid  5   10 Sam J Wilson  1 Suresh Mahalingam  5
Affiliations

A plasmid DNA-launched SARS-CoV-2 reverse genetics system and coronavirus toolkit for COVID-19 research

Suzannah J Rihn et al. PLoS Biol. .

Abstract

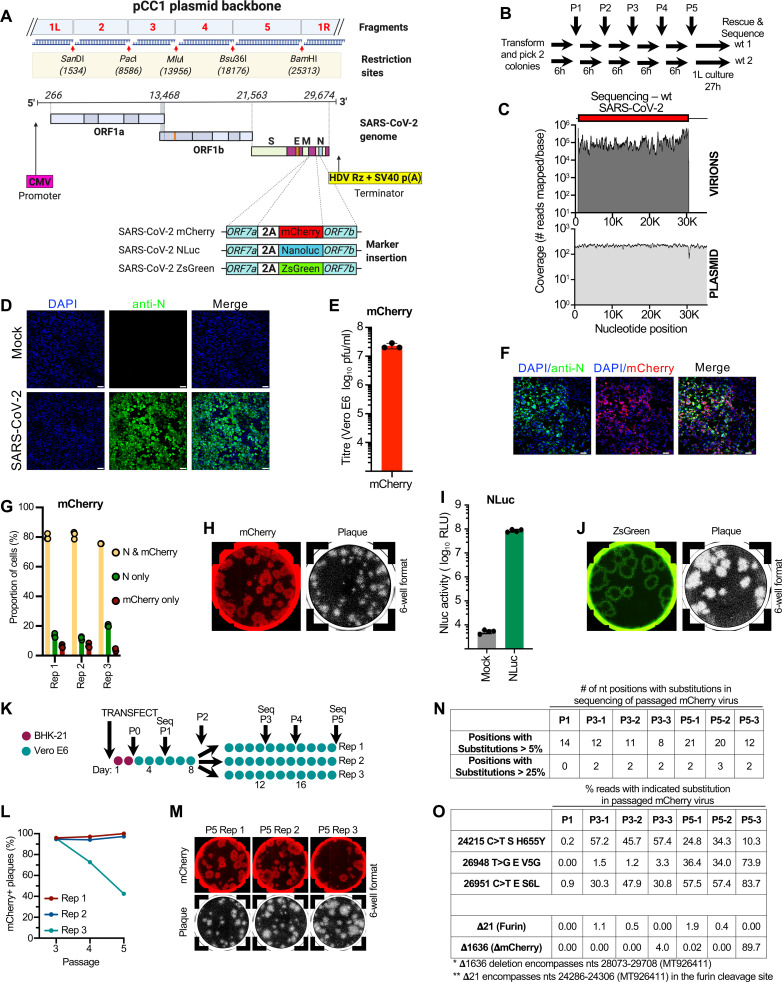
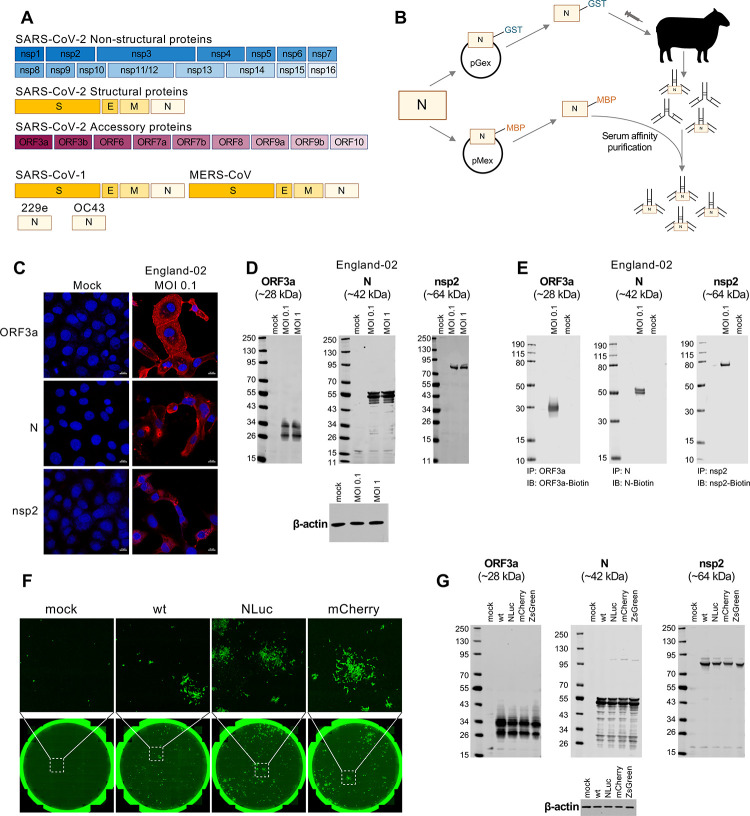
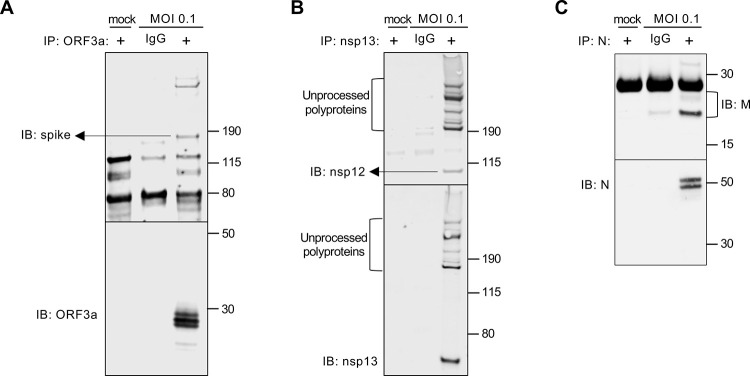
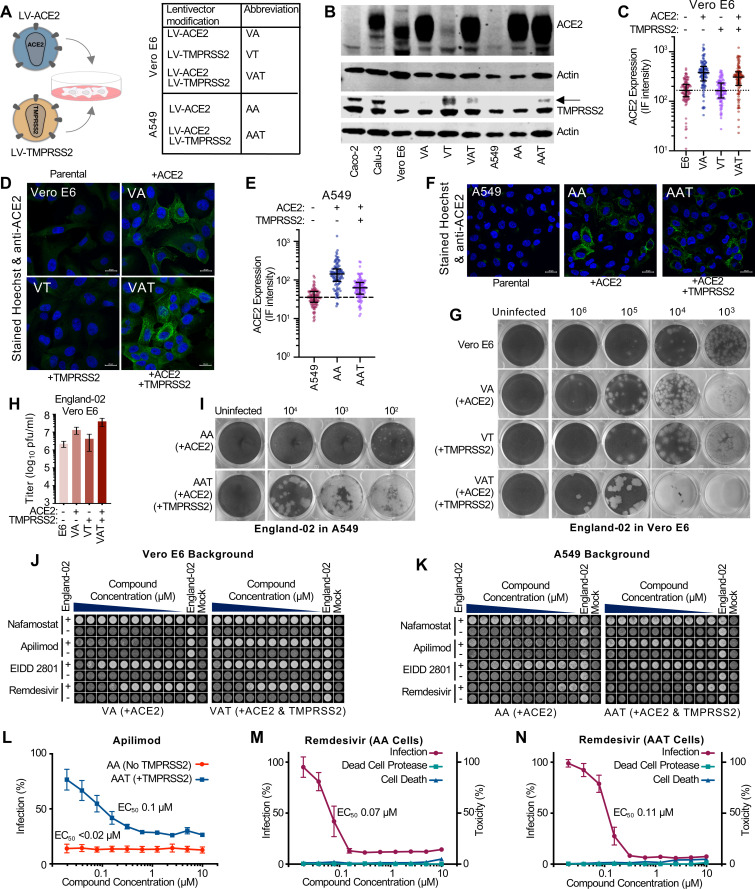
The recent emergence of Severe Acute Respiratory Syndrome Coronavirus 2 (SARS-CoV-2), the underlying cause of Coronavirus Disease 2019 (COVID-19), has led to a worldwide pandemic causing substantial morbidity, mortality, and economic devastation. In response, many laboratories have redirected attention to SARS-CoV-2, meaning there is an urgent need for tools that can be used in laboratories unaccustomed to working with coronaviruses. Here we report a range of tools for SARS-CoV-2 research. First, we describe a facile single plasmid SARS-CoV-2 reverse genetics system that is simple to genetically manipulate and can be used to rescue infectious virus through transient transfection (without in vitro transcription or additional expression plasmids). The rescue system is accompanied by our panel of SARS-CoV-2 antibodies (against nearly every viral protein), SARS-CoV-2 clinical isolates, and SARS-CoV-2 permissive cell lines, which are all openly available to the scientific community. Using these tools, we demonstrate here that the controversial ORF10 protein is expressed in infected cells. Furthermore, we show that the promising repurposed antiviral activity of apilimod is dependent on TMPRSS2 expression. Altogether, our SARS-CoV-2 toolkit, which can be directly accessed via our website at https://mrcppu-covid.bio/, constitutes a resource with considerable potential to advance COVID-19 vaccine design, drug testing, and discovery science.


Conflict of interest statement

The authors have declared that no competing interests exist.

Figures

Fig 1
Fig 1. An openly available plasmid launched SARS-CoV-2 RG system.
(A) Schematic of the design and construction of a pCC1-4K-SARS-CoV-2-Wuhan-Hu-1 icDNA clone. Synthetic DNA fragments 1, 2, and 3 based on the SARS-CoV-2-Wuhan-Hu1 sequence were cloned into the pCC1 plasmids, and fragments 4 and 5 were cloned into high copy plasmid pUC57Kan by the gene synthesis company (Genscript). Fragments were designed to contain specific restriction cloning sites SanDl, PacI, Mlul, Bsu36I, and BamHI for cloning purposes. Sequences encoding for mCherry, ZsGreen, and NLuc markers were cloned in-frame to the C-terminus of the ORF7a protein via an FMDV 2A linker. (B) A summary of the passage (P) history of the extensively propagated wt 1 and wt 2 plasmid preps (expanded 6 times on solid agar and 5 times in liquid culture prior to being “grown up” in liquid culture for DNA extraction). (C) Summary plots of the number of reads mapping to the wt rescue plasmid and to the rescued viral genome. (D) Detection of SARS-CoV-2 N antigen in Vero E6 cells infected with RG-rescued SARS-CoV-2-Wuhan-Hu-1. Cells were not infected (Mock) or infected at MOI 1.0 for 48 h and then fixed and stained with mouse monoclonal anti-N antibody and counterstained with DAPI. Cells were imaged using a confocal microscope. Scale bar = 50 μm. (E) Titre of the mCherry virus (plaque forming units on Vero E6 cells) following propagation in Vero E6 cells (P3). (F) Detection of infected Vero E6 cells using the RG-rescued SARS-CoV-2-mCherry. Cells were infected for 48 h at MOI 1.0, then fixed, stained with anti-N antibody, and imaged as in (D). Scale bar = 50 μm. (G) Quantification of mCherry and N expression in Vero E6 cells infected with SARS-CoV-2-mCherry at an MOI of 0.1 for 48 h. Fixed and permeabilised cells were stained for N protein and with Hoechst 33342 (2 μg/ml). Cells were imaged using the Celigo Imaging Cytometer to identify the proportion of infected cells positive for mCherry and/or N protein. (H) Fixed plaque assays were scanned using a Celigo Imaging Cytometer (Nexcelom Bioscience) using the red channel to visualise mCherry. The cells were then subsequently stained with Coomassie staining solution and imaged again. (I) Detection of viral replication in infected Vero E6 cells using the RG-rescued SARS-CoV-2-NLuc. Cells were not infected (Mock) or infected at MOI 1.0 for 24 h, then lysed. NLuc activity was measured in the lysate using a luminometer. (J) Fluorescent plaques of the SARS-CoV-2-ZsGreen virus were visualised using the green channel as in panel H. (K) A schematic of the passage (P) history of the SARS-CoV-2 mCherry virus used to assess reporter stability. Each filled circle represents 1 day of propagation. (L) Plaque assays of passages 3 to 5 were scanned (Celigo) as in (H). The percentage of plaques visible following Coomassie staining that were mCherry-positive in the linear range of the dilution series (total plaque number in the range of 22 to 55 for each replicate) are plotted for each lineage at each passage. (M) Typical images of fluorescent plaques used for the quantification in (L) are shown. (N) A summary of the variation generated during the passage of the mCherry virus summarised in panel K. The variation is detailed in S1 Table. (O) The percentage of the viral swarm displaying all variants that exceed 25% of the swarm at any time point is shown. The low-level deletion of the furin cleavage site is also highlighted for interest. The data underlying Fig 1E, 1G, 1I and 1L may be found in S1 Data. FMDV, foot-and-mouth disease virus; icDNA, infectious cDNA; MOI, multiplicity of infection; NLuc, Nanoluciferase; RG, reverse genetics; SARS-CoV-2, Severe Acute Respiratory Syndrome Coronavirus 2; wt, wild-type.
Fig 2
Fig 2. Production and validation of a near-comprehensive panel of openly available SARS-CoV-2 and coronavirus antibodies.
(A) Schematic representation of the SARS-CoV-2 and other coronavirus-processed proteins for which antibody synthesis and validation is described in this study. All antibodies (and corresponding proteins and cDNAs) listed are available upon request at https://mrcppu-covid.bio/. Accession numbers for the sequences utilised can be found in S2 Table and at https://mrcppu-covid.bio/. (B) A schematic illustrating the method of production for the antibodies shown in (A), utilising N (nucleocapsid) as an example. Each cDNA encoding a coronavirus protein was cloned into both pGex (carrying a GST tag) and pMex (MBP tag) plasmids, in order to yield corresponding GST- and MBP-tagged viral proteins. Sheep were subsequently immunised by utilising the GST-tagged proteins as antigens. At day 7 postimmunisation, serum was harvested and antibodies were affinity purified using the corresponding MBP-tagged protein. Additional inoculations (up to 5 in total) occurred 28 days apart. Exceptions to this method occurred for SARS-CoV-2 ORF7a, S, and S-RBD antibodies, where the MBP-tagged proteins were used as antigens, and after harvest, serum was again purified against the MBP-tagged protein, followed by depletion of the antibody against MBP. The SARS-CoV-2 S antibody was purified using protein G Sepharose chromatography. (C) IF validation for three of the antibodies (against nonstructural nsp2, structural N, and accessory ORF3a proteins) shown in (A) was conducted in Vero E6 cells that were uninfected (mock) or infected with the SARS-CoV-2 England-02 virus at an MOI of 0.1 for 48 h prior to fixation, permeabilization, and staining. IF validation for the remaining antibodies in (A) is shown in S2 Fig. (D) WB validation for the 3 antibodies shown in (C) was conducted using Vero E6 cells that were uninfected (mock) or infected with England-02 virus at an MOI of 0.1 or 1 (as indicated) for 72 h followed by WB analysis of whole cell lysates. WB validation for the remaining antibodies in (A) is shown in S3 and S4 Figs. (E) IP validation for the 3 antibodies shown in (C) was conducted using Vero E6 cells that were uninfected (mock) or infected with England-02 virus at an MOI of 0.1 for 3 days. IP validation for the remaining antibodies in (A) is shown in S4 and S5 Figs. (F) Immunostaining of cells either uninfected (mock) or infected with the RG-rescued SARS-CoV-2 and its mCherry and NLuc derivatives. Cells were stained using the N antibody utilised in (C–E) and imaged using a Celigo imaging cytometer. (G) WB validation of Vero E6 cells infected for 48 h with the RG viruses shown from Fig 1A for 48 h, using the 3 antibodies shown in (C–E). GST, glutathione S-transferase; IB, immunoblotting; IF, immunofluorescence; IP, immunoprecipitation; MBP, maltose-binding protein; MERS-CoV, Middle East Respiratory Syndrome Coronavirus; MOI, multiplicity of infection; NLuc, Nanoluciferase; RG, reverse genetics; SARS-CoV-2, Severe Acute Respiratory Syndrome Coronavirus 2; WB, western blotting; wt, wild-type.
Fig 3
Fig 3. Usage of our toolkit antibodies to demonstrate or confirm SARS-CoV-2 protein interactions.
(A) A co-IP was performed using lysates from Vero E6 cells infected with England-02 at MOI 0.1 for 3 days. Using the specific anti-ORF3a antibody described herein, SARS-CoV-2 ORF3a was immunoprecipitated (alongside a preimmune IgG control), and the immune complexes were western blotted for the presence of SARS-CoV-2 spike (S) and ORF3a. (B) As in (A), SARS-CoV-2 nsp13 (or IgG control) was immunoprecipitated and the immune complexes were probed for nsp13 and nsp11/12 by WB. (C) As in (A, B), SARS-CoV-2 N (or IgG control) was immunoprecipitated and the immune complexes were probed for matrix (M) and N by WB. co-IP, co-immunoprecipitation; IB, immunoblotting; IgG, immunoglobulin G; MOI, multiplicity of infection; SARS-CoV-2, Severe Acute Respiratory Syndrome Coronavirus 2; WB, western blotting.
Fig 4
Fig 4. Conventional cell lines modified to express ACE2 and TMPRSS2 lentiviruses have utility in SARS-CoV-2 phenotypic assays.
(A) A schematic illustrating the LV-ACE2 and LV-TMPRSS2 lentiviruses that have been used to transduce multiple cell lines. The corresponding abbreviations of the modified lines are also shown. (B) The abundance of ACE2 and TMPRSS2 in Vero E6 cells, A549 cells and derivatives modified to express exogenous ACE2 and/or TMPRSS2 was assessed by WB. Permissive Calu-3 and Caco-2 samples were included for reference. Two actin blots are presented as different samples of equivalent cells were used to stain for ACE2 and TMPRSS2. (C) ACE2 intensity values from confocal microscopy images of ACE2 and Hoechst-stained Vero E6 cells and VA, VT, and VAT derivatives were measured using Cell Profiler (cellprofiler.org). (D) Randomly selected confocal microscopy images used for the quantification in (C) are shown. (E) As in panel C, using stained A549 cells, as well as AA and AAT cell derivatives. (F) Randomly selected confocal microscopy images used for the quantification in (E) are shown. (G) The plaque phenotype produced by the same preparation of SARS-CoV-2 England-02 on Vero E6 cells and VA, VT, and VAT derivatives. (H) As in (G), indicating the titre (in pfu/ml) of the same preparation of SARS-CoV-2 England-02 in cells with or without exogenous ACE2 and/or TMPRSS2. (I) As in panel G, AA and AAT derivatives of A549 cells were infected with SARS-CoV-2 England-02 to observe the plaque phenotype. (J) An example of a phenotypic well clearance/monolayer integrity assay used to assess the anti-SARS-CoV-2 activity of various compounds (nafamostat, apilimod, EIDD_2801, or remdesivir). The cells were treated with 2-fold serially diluted compound (10 μM to 20 nM) before being mock infected or infected with SARS-CoV-2. At 72 h postinfection, the monolayers were fixed and Coomassie-stained before scanning using a Celigo imaging cytometer. (K) As in panel J, well clearance assays in AA and AAT cells using SARS-CoV-2 England-02 are shown. (L) Quantification of the anti-SARS-CoV-2 activity of apilimod in AA and AAT cells. The mean and standard error of 4 replicates are plotted. (M) Dose response curve of remdesivir using the well-clearance assay in AA cells (as in panel K) multiplexed with a dead cell protease toxicity assay. The mean and standard error of 4 replicates are plotted. (N) as in panel M using AAT cells. The data underlying Fig 4C, 4E, 4H, 4L, 4M and 4N may be found in S1 Data. AA, A549-ACE2; AAT, A549-ACE2-TMPRSS2; ACE2, angiotensin-converting enzyme 2; SARS-CoV-2, Severe Acute Respiratory Syndrome Coronavirus 2; VA, Vero E6-ACE2; VAT, Vero E6-ACE2-TMPRSS2; VT, Vero E6-TMPRSS2; WB, western blotting.
Fig 5
Fig 5. Toolkit of SARS-CoV-2 clinical isolates.
(A) A comparison of plaque phenotypes in VAT cells from the 3 SARS-CoV-2 viruses isolated in this study and the England-02 SARS-CoV-2 virus. (B) A comparison of viral titers (in pfu/ml) of the 3 SARS-CoV-2 viruses isolated in this study and the England-02 SARS-CoV-2 virus in AA, AAT, Vero E6 (E6), VA, and VAT cells. All cells with exogenous ACE2 or TMPRSS2 were transduced with the lentiviruses described in Fig 4. (C) Quantification of plaque area (in mm2) was calculated in ImageJ (plaques not overlapping other plaques or the side of the well) from 4 replicates of the data presented in (A) and (B). Significance was determined using a Mann–Whitney U test. (D) A table showing the amino acid substitutions present in England-02 and 3 SARS-CoV-2 viruses isolated from clinical samples in this study, relative to Wuhan-Hu-1 (NC_045512). CVR-GLA-1 (MT882022) was isolated from sputum (CVR837 [EPI_ISL_461705]), CVR-GLA-2 (MT906650) was isolated from sputum (CVR2224 [EPI_ISL_448167], and CVR-GLA-3 (MT906649) was isolated from bronchoalveolar lavage (CVR3899_BAL [EPI_ISL_490695]). (E) IF of the 3 SARS-CoV-2 viruses isolated in this study and the England-02 SARS-CoV-2 virus in AAT cells (at MOI 0.01 for 48 h), using ORF3a, N, and nsp2 antibodies, as in Fig 2. The data underlying Fig 5B and 5C may be found in S1 Data. AA, A549-ACE2; AAT, A549-ACE2-TMPRSS2; ACE2, angiotensin-converting enzyme 2; IF, immunofluorescence; MOI, multiplicity of infection; SARS-CoV-2, Severe Acute Respiratory Syndrome Coronavirus 2; VA, Vero E6-ACE2; VAT, Vero E6-ACE2-TMPRSS2.
Fig 6
Fig 6. Sequence changes observed in SARS-CoV-2 CVR-GLA-1 following in vitro propagation.
(A) A schematic of the passage history of the SARS-CoV-2 CVR-GLA-1 virus in Vero E6 and AAT cells. Each filled circle represents 1 day of propagation. (B) A summary of the variation generated during the passage of the CVR-GLA-1 virus indicated in panel A. The variation is detailed in S1 Table. The percentage of the viral swarm displaying all variants that exceed 5% or 25% of the swarm at any time point is shown. The percentage occurrence of several deletion mutants is highlighted for interest. AAT, A549-ACE2-TMPRSS2; SARS-CoV-2, Severe Acute Respiratory Syndrome Coronavirus 2.

References

    1. Wang H, Zhang Y, Huang B, Deng W, Quan Y, Wang W, et al.. Development of an inactivated vaccine candidate, BBIBP-CorV, with potent protection against SARS-CoV-2. Cell [Internet]. 2020. June 6 [cited 2020 Jun 8];0(0). Available from: https://www.cell.com/cell/abstract/S0092-8674(20)30695-4. - PMC - PubMed
    1. WHO Coronavirus Disease (COVID-19) Dashboard [Internet]. [cited 2020 Aug 23]. Available from: https://covid19.who.int.
    1. Cui J, Li F, Shi Z-L. Origin and evolution of pathogenic coronaviruses. Nat Rev Microbiol. 2019. March;17(3):181–92. 10.1038/s41579-018-0118-9 - DOI - PMC - PubMed
    1. Song Z, Xu Y, Bao L, Zhang L, Yu P, Qu Y, et al.. From SARS to MERS,. Thrusting Coronaviruses into the Spotlight Viruses. 2019. January;11(1):59. - PMC - PubMed
    1. Petersen E, Koopmans M, Go U, Hamer DH, Petrosillo N, Castelli F, et al.. Comparing SARS-CoV-2 with SARS-CoV and influenza pandemics. The Lancet Infectious Diseases [Internet]. 2020. July 3 [cited 2020 Aug 20];0(0). Available from: https://www.thelancet.com/journals/laninf/article/PIIS1473-3099(20)30484.... 10.1016/S1473-3099(20)30484-9 - DOI - PMC - PubMed

Publication types