

Reduction in live births in Japan nine months after the Fukushima nuclear accident: An observational study
- PMID: 33630835
- PMCID: PMC7906319
- DOI: 10.1371/journal.pone.0242938
Reduction in live births in Japan nine months after the Fukushima nuclear accident: An observational study
Abstract
Background: After the Chernobyl accident on 26 April 1986, a drop in birth-rate was found in several European countries in the first quarter of 1987. The objective of the present study was to investigate whether a similar drop in live births occurred in Japan after the Fukushima nuclear accident.
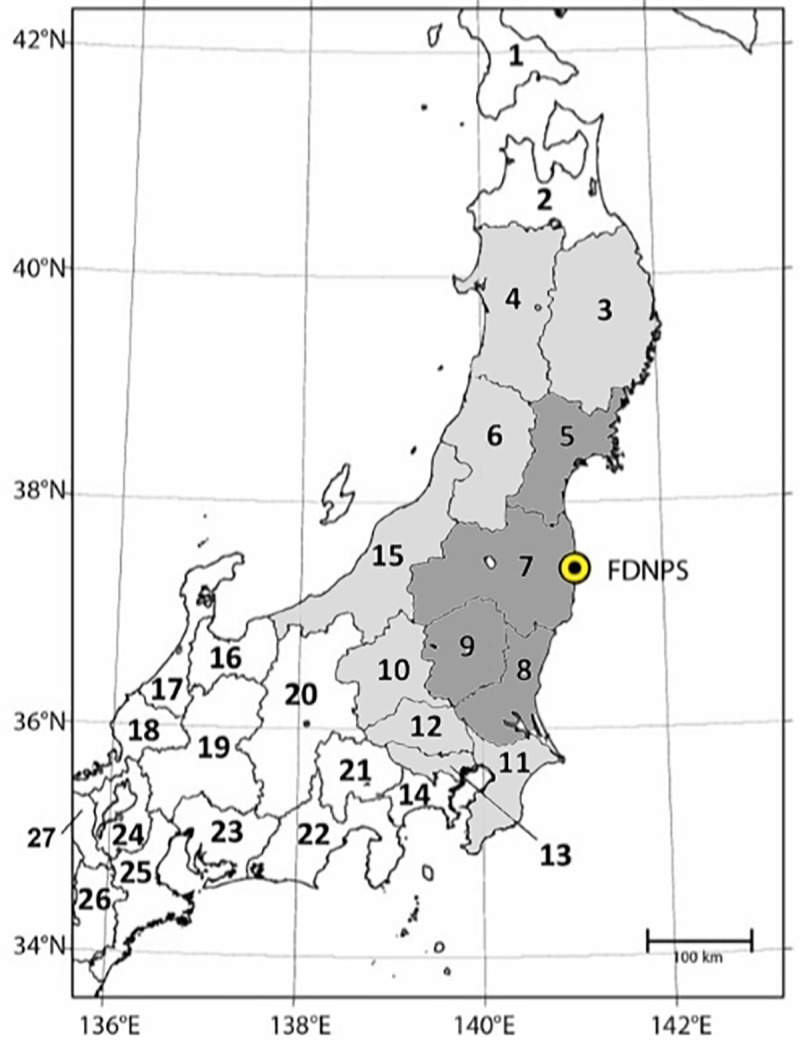
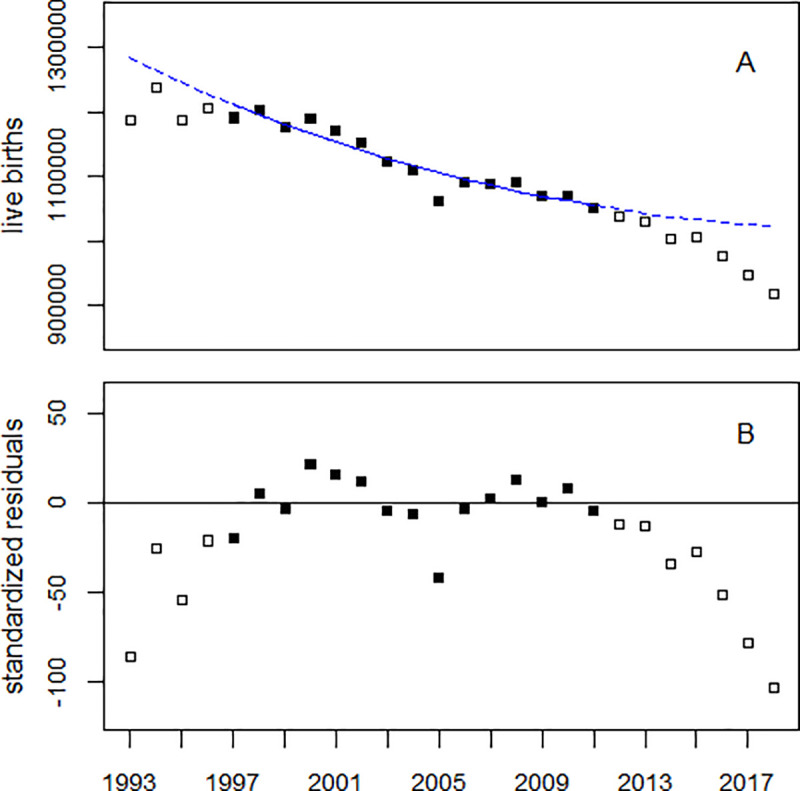
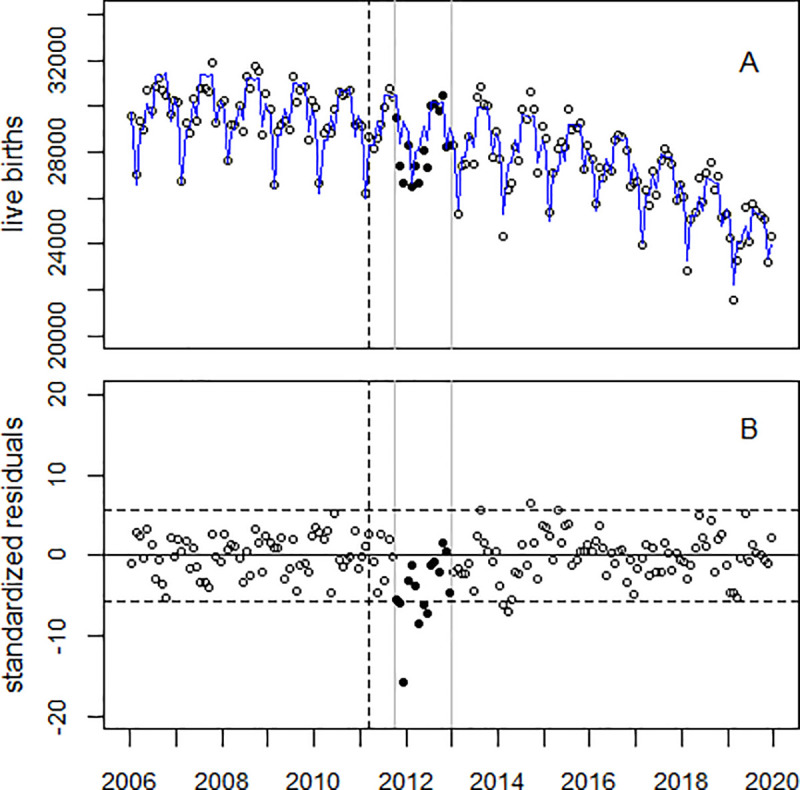
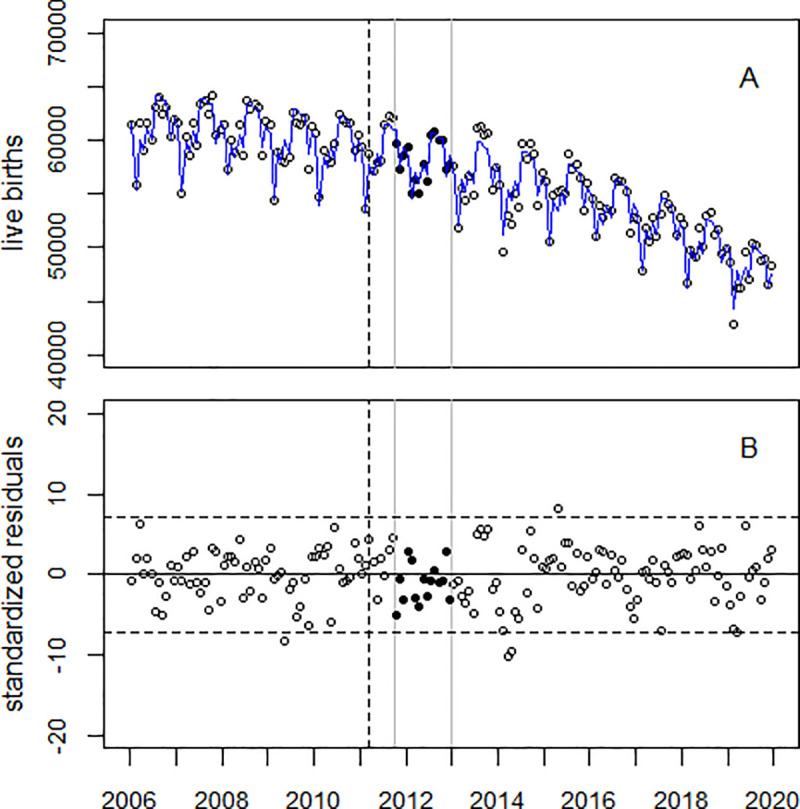
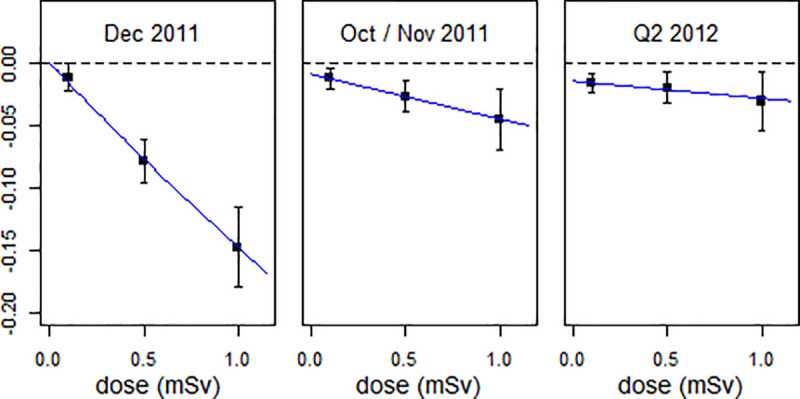
Data and methods: A study region was defined consisting of Fukushima prefecture plus 10 nearby prefectures. The observed monthly numbers of live births (LB) in October 2011 through December 2012 were compared with the predicted numbers determined from the trend of live births in the remaining months from January 2006 through December 2018. The study region was divided into Fukushima plus three adjacent prefectures (Area A, assumed effective mean dose in the first year 1 mSv) and seven surrounding prefectures (Area B, 0.5 mSv). The rest of Japan (Area C) served as the comparison (control) region (0.1 mSv). A combined regression of live births (LB) in areas A, B, C was conducted with individual trend parameters but common parameters for monthly variations.
Results: In the study region as a whole (areas A and B combined) a highly significant 9.1% (95% CI: -12.2%, -6.0%) drop in LB was found in December 2011. Reduced numbers of live births were also observed in October-November 2011 (-3.3%, p = 0.006), i.e. in births exposed early in pregnancy. In the second quarter of 2012, i.e. in live births conceived more than 3 months after the Fukushima accident, the decrease was greater (-4.3%, p < 0.001) than in the first quarter (-1.6%, p = 0.11). i.e. in those conceived within the first three months after the accident while no significant decrease was detected in the third (-0.7%, p = 0.44) and fourth (-0.5%, p = 0.62) quarters. The effect in Dec 2011 was greater in Area A with -14.0 (-17.6, -10.3) % than in Area B with -7.8 (-11.1, -4.5) % and non-significant in Area C with -1.3 (-4.2, +1.6) %, p = 0.38. The combined regression of the data in areas A, B, and C found a highly significant association of the effect in December 2011 with radiation dose. Conclusion: It is suggested that the observed drop in LB in December 2011 may reflect early deaths of the conceptus from high radiation exposure following the triple meltdown at the Fukushima Daiichi nuclear power plant on March 12-15, 2011.
Conflict of interest statement
The authors have declared that no competing interests exist.
Figures
Similar articles
-
Increases in perinatal mortality in prefectures contaminated by the Fukushima nuclear power plant accident in Japan: A spatially stratified longitudinal study.Medicine (Baltimore). 2016 Sep;95(38):e4958. doi: 10.1097/MD.0000000000004958. Medicine (Baltimore). 2016. PMID: 27661055 Free PMC article.
-
Spatiotemporal association of low birth weight with Cs-137 deposition at the prefecture level in Japan after the Fukushima nuclear power plant accidents: an analytical-ecologic epidemiological study.Environ Health. 2020 Jul 9;19(1):82. doi: 10.1186/s12940-020-00630-w. Environ Health. 2020. PMID: 32646457 Free PMC article.
-
Association of the Great East Japan Earthquake and the Daiichi Nuclear Disaster in Fukushima City, Japan, With Birth Rates.JAMA Netw Open. 2019 Jan 4;2(1):e187455. doi: 10.1001/jamanetworkopen.2018.7455. JAMA Netw Open. 2019. PMID: 30681714 Free PMC article.
-
Ethical Issues Related to the Promotion of a "100 mSv Threshold Assumption" in Japan after the Fukushima Nuclear Accident in 2011: Background and Consequences.Curr Environ Health Rep. 2017 Jun;4(2):119-129. doi: 10.1007/s40572-017-0145-0. Curr Environ Health Rep. 2017. PMID: 28429301 Review.
-
Radioactive Doses - Predicted and Actual - and Likely Health Effects.Clin Oncol (R Coll Radiol). 2016 Apr;28(4):245-54. doi: 10.1016/j.clon.2015.12.028. Epub 2016 Jan 21. Clin Oncol (R Coll Radiol). 2016. PMID: 26805911 Review.
Cited by
-
Human fertility after a disaster: a systematic literature review.Proc Biol Sci. 2023 May 10;290(1998):20230211. doi: 10.1098/rspb.2023.0211. Epub 2023 May 10. Proc Biol Sci. 2023. PMID: 37161332 Free PMC article.
-
Considerations of Medical Preparedness to Assess and Treat Various Populations During a Radiation Public Health Emergency.Radiat Res. 2023 Mar 1;199(3):301-318. doi: 10.1667/RADE-22-00148.1. Radiat Res. 2023. PMID: 36656560 Free PMC article. Review.
-
Perinatal mortality after the Fukushima nuclear accident: An ecological study.PLoS One. 2022 Feb 28;17(2):e0264491. doi: 10.1371/journal.pone.0264491. eCollection 2022. PLoS One. 2022. PMID: 35226693 Free PMC article.
-
Effects of External Radiation Exposure on Perinatal Outcomes in Pregnant Women After the Fukushima Daiichi Nuclear Power Plant Accident: the Fukushima Health Management Survey.J Epidemiol. 2022;32(Suppl_XII):S104-S114. doi: 10.2188/jea.JE20210252. J Epidemiol. 2022. PMID: 36464294 Free PMC article.
References
-
- Skjeldestad FE, Munch JS, Madland TM. Tsjernobyl-ulykken—påvirket den svangerskapsutfall i Norge? [The Chernobyl accident—did it influence the pregnancy outcome in Norway?]. Tidsskr Nor Laegeforen. 1992. April 10;112(10):1278–81. Norwegian. . - PubMed
Publication types
MeSH terms
LinkOut - more resources
Full Text Sources
Other Literature Sources
Research Materials
Miscellaneous
