. 2021 Feb 25;17(2):e1008720.
doi: 10.1371/journal.pcbi.1008720. eCollection 2021 Feb.

Impact of between-tissue differences on pan-cancer predictions of drug sensitivity

Affiliations

Impact of between-tissue differences on pan-cancer predictions of drug sensitivity

John P Lloyd et al. PLoS Comput Biol. .

Abstract

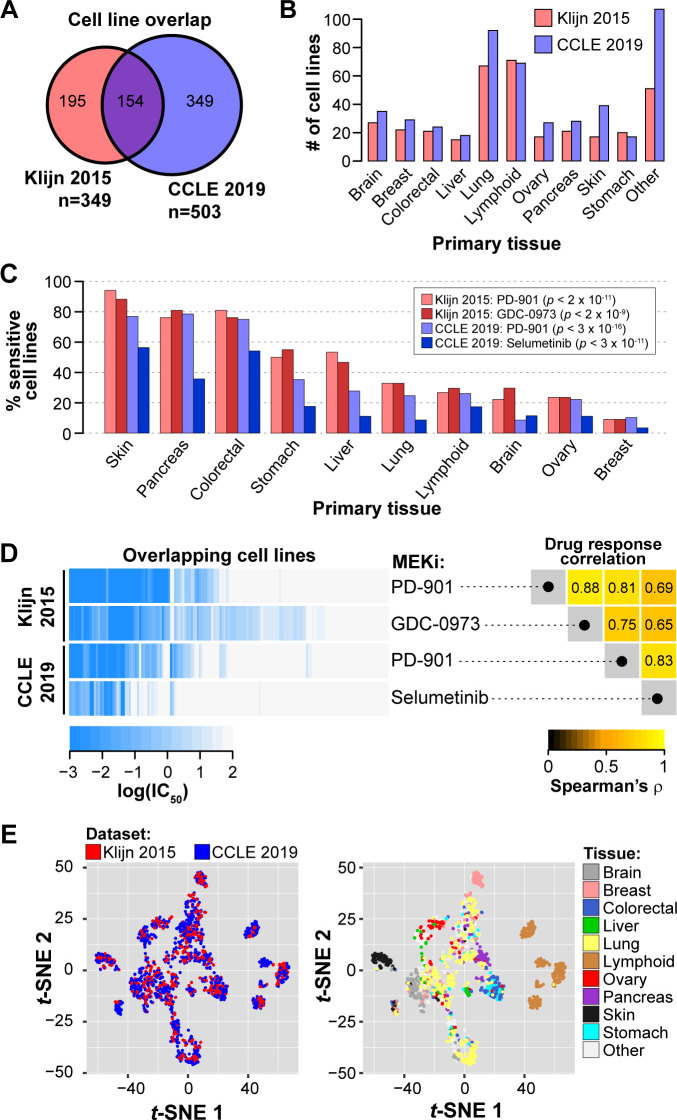
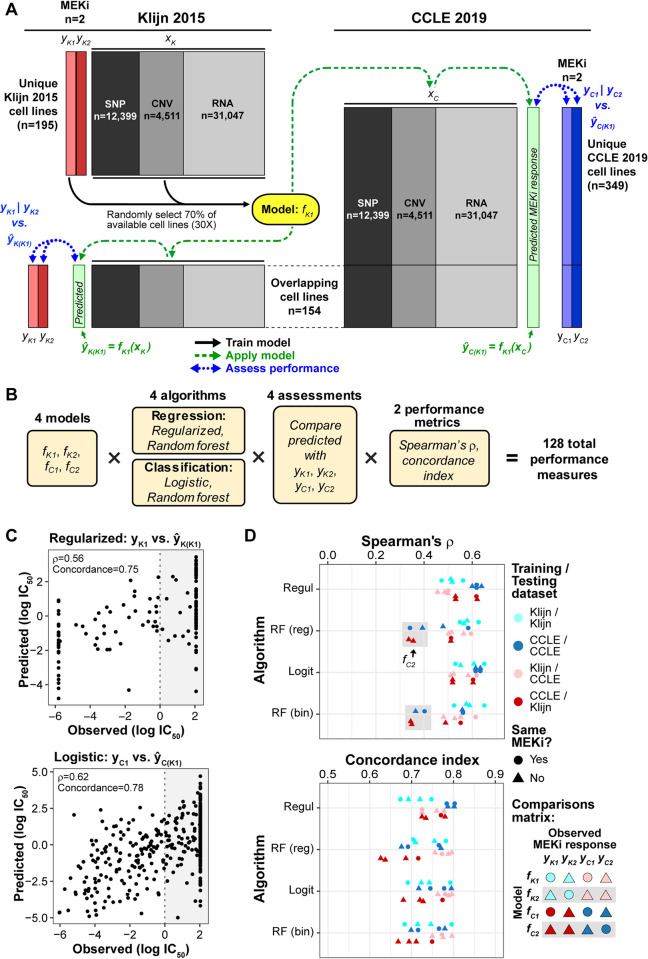
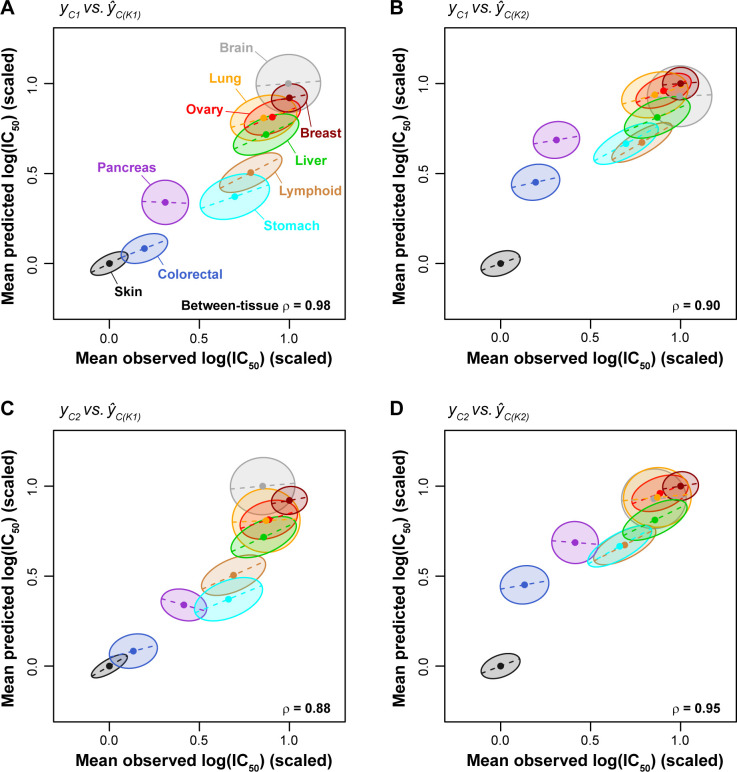
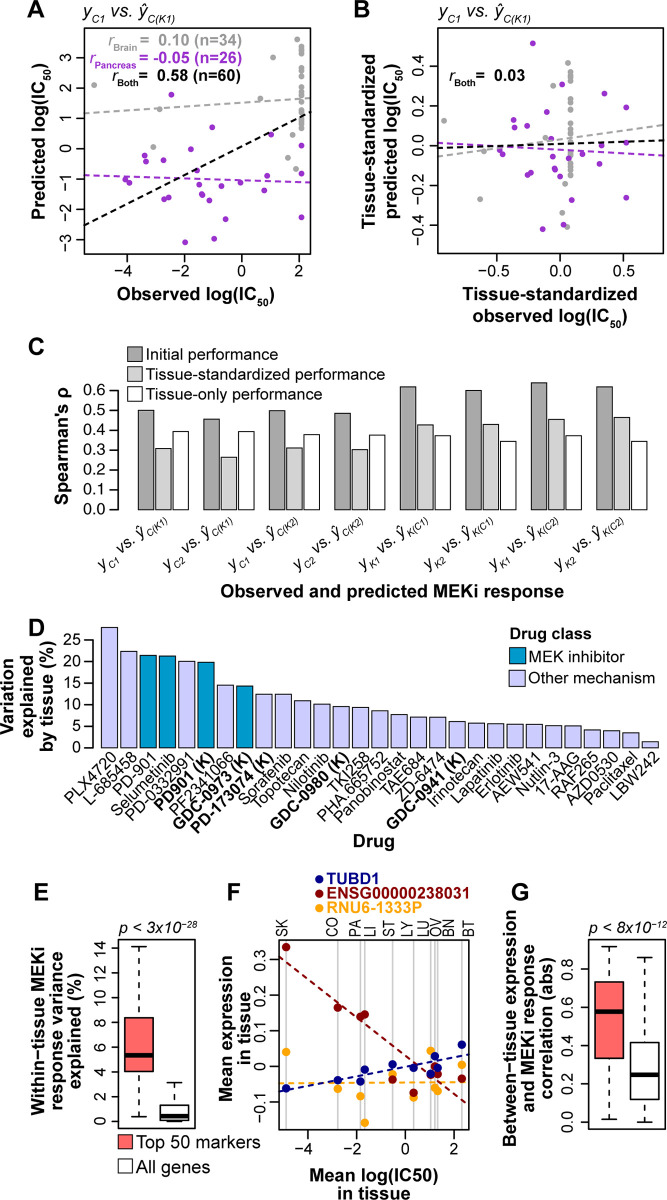
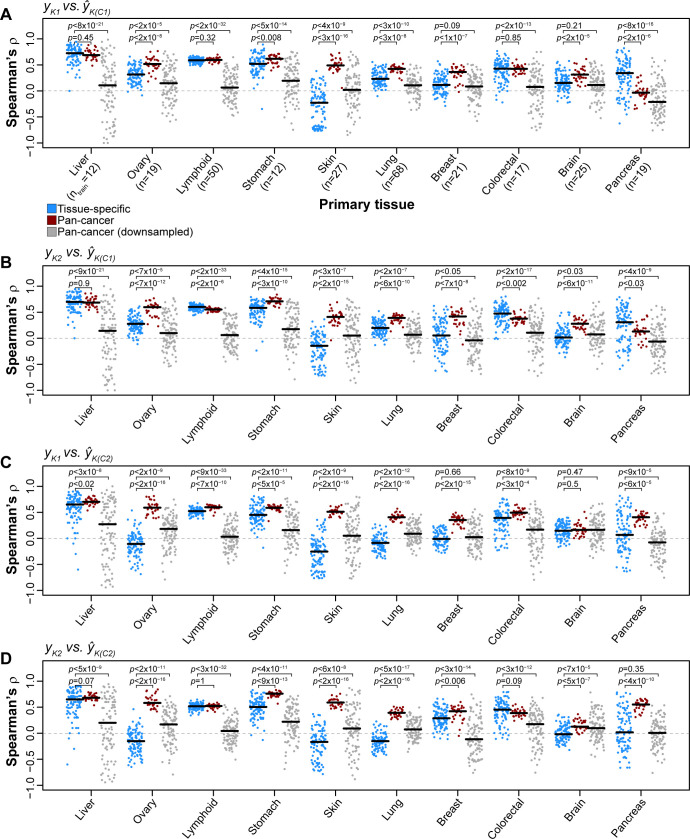
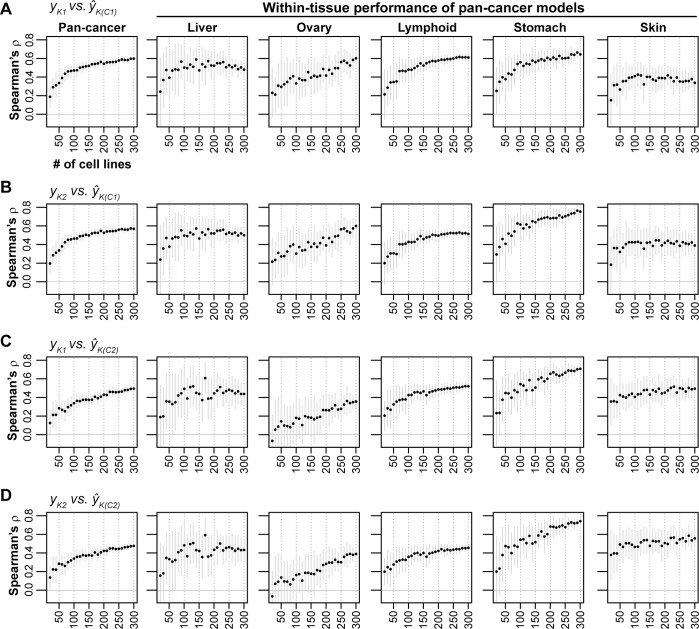
Increased availability of drug response and genomics data for many tumor cell lines has accelerated the development of pan-cancer prediction models of drug response. However, it is unclear how much between-tissue differences in drug response and molecular characteristics may contribute to pan-cancer predictions. Also unknown is whether the performance of pan-cancer models could vary by cancer type. Here, we built a series of pan-cancer models using two datasets containing 346 and 504 cell lines, each with MEK inhibitor (MEKi) response and mRNA expression, point mutation, and copy number variation data, and found that, while the tissue-level drug responses are accurately predicted (between-tissue ρ = 0.88-0.98), only 5 of 10 cancer types showed successful within-tissue prediction performance (within-tissue ρ = 0.11-0.64). Between-tissue differences make substantial contributions to the performance of pan-cancer MEKi response predictions, as exclusion of between-tissue signals leads to a decrease in Spearman's ρ from a range of 0.43-0.62 to 0.30-0.51. In practice, joint analysis of multiple cancer types usually has a larger sample size, hence greater power, than for one cancer type; and we observe that higher accuracy of pan-cancer prediction of MEKi response is almost entirely due to the sample size advantage. Success of pan-cancer prediction reveals how drug response in different cancers may invoke shared regulatory mechanisms despite tissue-specific routes of oncogenesis, yet predictions in different cancer types require flexible incorporation of between-cancer and within-cancer signals. As most datasets in genome sciences contain multiple levels of heterogeneity, careful parsing of group characteristics and within-group, individual variation is essential when making robust inference.


Conflict of interest statement

The authors have declared that no competing interests exist.

Figures

Fig 1
Fig 1. Overview of between-cancer type differences of MEK inhibitor response and expression patterns in the Klijn 2015 and Cancer Cell Line Encyclopedia datasets.
(A) Overlap in cell lines with drug response and RNA expression and DNA variant data. (B) Counts of tumor cell lines with MEKi response data for 10 shared cancer types (n ≥15 in both datasets). (C) Proportion of MEKi-sensitive cell lines stratified by tissue. Cell lines were considered sensitive based on a threshold of IC50 ≤ 1 nM. P-values from χ2 test of independence of sensitive vs. resistant cell line proportions across the 10 tissues. (D) Variability in the response to the MEK small molecule inhibitors. Left: Heatmap of MEKi response in log(IC50) for four data series (in rows). Each column corresponds to a single cell line with drug response data for both MEKi in both datasets; columns were hierarchically clustered. Right: Rank correlation of log(IC50) among the four data series in the left panel. (E) Scatterplots of the first two dimensions from t-distributed stochastic neighbor embedding (t-SNE) analysis on transcriptome data. Each point represents a cell line and is colored by dataset (left) and tissue-of-origin (right).
Fig 2
Fig 2. Pan-cancer machine learning predictions of MEKi response.
(A) Schematic of an example of training-prediction-assessment workflow, depicting the generation of a prediction model (yellow, fK1) that considers MEKi PD-901 response data from the Klijn 2015 dataset (yK1, light red) and DNA and RNA features (xK). The 154 cell lines in common between the two datasets were excluded from model building. Prediction models were built on 70% of training cell lines (selected randomly), repeated 30 times, and the final predicted drug response of a given cell line in the validation sets was calculated as the average of the 30 repeats. The resulting prediction models are applied to within-dataset and cross-dataset RNA and DNA data (xK and xC) to generate predicted drug response scores (ŷK(K1) and ŷC(K1)). Predicted drug response values, shown in light green boxes, were then compared with observed drug response to evaluate model performance (within-dataset: ŷK(K1) vs. yK1 | yK2; cross-dataset: ŷC(K1) vs. yC1 | yC2). Model generation is depicted with black arrows, model application with green dashed arrows, and performance assessment with blue dotted arrows. (B) Outline of the full combinations of 4 models based on input data, 4 algorithms, assessments by comparing predicted MEKi response to the 4 series of observed response data, and 2 performance metrics. (C) Two examples showing observed and predicted log(IC50) from the fK1 model: regularized regression and within-dataset validation (top panel) or logistic regression and cross-dataset validation (bottom). Rank correlation (Spearman’s ρ) and concordance index are shown in the top left corner. (D) Performance of all combinations of models, algorithms (y-axis), and assessments by rank correlation (Spearman’s ρ, top panel) and concordance index (bottom). Within-dataset performances are indicated by shades of blue: cyan/dark blue, while between-dataset performances are indicated by shades of red: pink/dark red. Models trained from CCLE data are indicated by the darker shade. Gray boxes: random forest models trained on CCLE-Selumetinib data (fC2). Regul: regularized regression; RF (reg): regression-based random forest; Logit: logistic regression; RF (bin): classification-based (binary) random forest.
Fig 3
Fig 3. Cigar plots of pan-cancer MEKi response predictions within and between cancer types.
Dots at the center of ellipses indicate the mean observed and predicted log(IC50) values for a given tissue (mean values were scaled linearly between 0 and 1). ρ values indicate rank correlation among centers of ellipses. Maximum ellipsis length scales with the range of MEKi responses for a given tissue, where tissues with larger response ranges are associated with longer ellipses (e.g. stomach and lymphoid) while tissues with a smaller response range are associated with shorter ellipses (e.g. skin and breast). The slope of dashed lines (and tilt of ellipses) corresponds to the within-tissue regression coefficient of the predicted values against the observed values (Pearson’s r). The width of ellipses also corresponds to the within-tissue regression coefficient, i.e., a high correlation value is shown as a slender ellipse while a low correlation value leads to a round ellipse. (A-D) Within- and between-tissue performances for the 4 combinations of drug/models trained on Klijn 2015 data and applied to CCLE data.
Fig 4
Fig 4. Effects of between-tissue signals on prediction performance and biomarker importance.
(A) Performance of pan-cancer prediction models for a combination of brain and pancreas tissues. Correlation (Pearson’s r) is shown for brain cell lines (gray), pancreas cell lines (purple), and both brain and pancreas combined (black). Dashed lines indicate lines of best fit. (B) Performance of pan-cancer prediction models for a combination of brain and pancreas tissues following standardization of observed and predicted MEKi response within tissues. Standardization was performed by scaling linearly between 0 and 1 and subtracting the scaled mean. (C) Comparisons of initial performance (dark gray bars; Fig 2D), performances calculated following standardization of observed and predicted log(IC50) values within tissues (light gray bars), and performances of tissue-only predictions (white bars) for regularized regression models. (D) Variation in drug response explained by tissue for the 29 drug screens in the Klijn 2015 (n = 5; bold and suffixed with “(K)” on x-axis) and CCLE 2019 (n = 24) datasets. Variation explained was calculated with analysis of variance (ANOVA) on a linear model of log(IC50) ~ tissue. (E) Within-tissue variation in drug response explained by gene expression for the top 50 RNA biomarkers (pink) and all genes (white) for the fK1 regularized regression model. P-value from a Mann-Whitney U test. (F) Example correlation between mean log(IC50) and mean expression levels within tissues for three of the top 50 markers (red, blue, orange) for the fK1 regularized regression model. Dashed lines indicate lines of best fit for the color-matched points. Vertical gray lines denote mean log(IC50) values for the 10 tissues, which are abbreviated at the top of the plot: SK: skin, CO: colorectal, PA: pancreas, LI: liver, ST: stomach, LY: lymphoid, LU: lung, OV: ovary, BN: brain, BT: breast. (G) Absolute (abs) correlation between mean log(IC50) and mean gene expression across 10 tissues for the top 50 RNA biomarkers (pink) and all genes (white) for the fK1 regularized regression model. P-value from a Mann Whitney U test.
Fig 5
Fig 5. Comparisons of pan-cancer and tissue-specific MEKi response prediction models.
For each tissue with ≥15 cell lines in both Klijn 2015 and CCLE datasets, a tissue-specific prediction model was trained and tested by considering only cell lines from a given tissue. Regularized regression prediction models were trained on a random selection of 75% of cell lines in CCLE data of a given tissue type and applied to Klijn 2015 cell lines of the same tissue type (repeated 100 times). Performance was reported using rank correlation between observed and predicted MEKi drug response for each iteration (blue points). Rank correlation for the 30 iterations of MEKi response predictions based on pan-cancer prediction models (Fig 2) for a given tissue are indicated with red points. Pan-cancer prediction models were trained and tested using many more cell lines than tissue-specific prediction models. A new set of pan-cancer prediction models were generated by downsampling the available pan-cancer cell line sets to sample sizes equal to tissue-specific prediction models (gray points). (A-D) Results are shown for the 4 combinations of drug-models trained using CCLE data and applied to Klijn 2015 data. Black horizontal lines: median performance for a given distribution. Sample sizes on the x-axis in (A) indicate the number of cell lines used to train tissue-specific and downsampled pan-cancer models for the associated tissue. P-values from Mann-Whitney U tests.
Fig 6
Fig 6. Performance of pan-cancer MEKi response predictions based on downsampled sets of cell lines.
Downsampled pan-cancer models were applied, from left to right, on pan-cancer testing sets and five single-tissue testing sets. Cell lines in the CCLE dataset were randomly downsampled to sample sizes ranging from 20 to 300 in 10 cell line increments (x-axis; niterations = 30). Regularized regression prediction models were trained on downsampled cell lines sets and applied to cell lines in the Klijn 2015 dataset. Mean ranked correlation (Spearman’s ρ) between observed and predicted logged IC50 values across the 30 iterations for each sample size are plotted. (A-D) Results are shown for the 4 combinations of drug-models trained using CCLE data and applied to Klijn 2015 data. Solid gray vertical lines: ±standard deviation.

References

    1. Garraway LA, Verweij J, Ballman KV. Precision Oncology: An Overview. Journal of Clinical Oncology. 2013;31: 1803–1805. 10.1200/JCO.2013.49.4799 - DOI - PubMed
    1. Prasad V, Fojo T, Brada M. Precision oncology: origins, optimism, and potential. The Lancet Oncology. 2016;17: e81–e86. 10.1016/S1470-2045(15)00620-8 - DOI - PubMed
    1. Schwartzberg L, Kim ES, Liu D, Schrag D. Precision Oncology: Who, How, What, When, and When Not? ASCO Educational Book. 2017;37: 160–169. 10.1200/EDBK_174176 - DOI - PubMed
    1. Kumar-Sinha C, Chinnaiyan AM. Precision oncology in the age of integrative genomics. Nature Biotechnology. 2018;36: 46–60. 10.1038/nbt.4017 - DOI - PMC - PubMed
    1. Goossens N, Nakagawa S, Sun X, Hoshida Y. Cancer biomarker discovery and validation. Transl Cancer Res. 2015;4: 256–269. 10.3978/j.issn.2218-676X.2015.06.04 - DOI - PMC - PubMed

Publication types

MeSH terms