Functional capacities of microbial communities to carry out large scale geochemical processes are maintained during ex situ anaerobic incubation
- PMID: 33630888
- PMCID: PMC7906461
- DOI: 10.1371/journal.pone.0245857
Functional capacities of microbial communities to carry out large scale geochemical processes are maintained during ex situ anaerobic incubation
Abstract
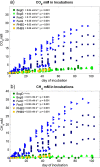
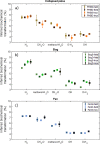
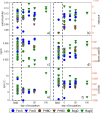
Mechanisms controlling CO2 and CH4 production in wetlands are central to understanding carbon cycling and greenhouse gas exchange. However, the volatility of these respiration products complicates quantifying their rates of production in the field. Attempts to circumvent the challenges through closed system incubations, from which gases cannot escape, have been used to investigate bulk in situ geochemistry. Efforts towards mapping mechanistic linkages between geochemistry and microbiology have raised concern regarding sampling and incubation-induced perturbations. Microorganisms are impacted by oxygen exposure, increased temperatures and accumulation of metabolic products during handling, storage, and incubation. We probed the extent of these perturbations, and their influence on incubation results, using high-resolution geochemical and microbial gene-based community profiling of anaerobically incubated material from three wetland habitats across a permafrost peatland. We compared the original field samples to the material anaerobically incubated over 50 days. Bulk geochemistry and phylum-level microbiota in incubations largely reflected field observations, but divergence between field and incubations occurred in both geochemistry and lineage-level microbial composition when examined at closer resolution. Despite the changes in representative lineages over time, inferred metabolic function with regards to carbon cycling largely reproduced field results suggesting functional consistency. Habitat differences among the source materials remained the largest driver of variation in geochemical and microbial differences among the samples in both incubations and field results. While incubations may have limited usefulness for identifying specific mechanisms, they remain a viable tool for probing bulk-scale questions related to anaerobic C cycling, including CO2 and CH4 dynamics.
Conflict of interest statement
Funding for this research was provided by the Genomic Science Program of the United States Department of Energy Office of Biological and Environmental Research Grants DE-SC0010580 & DESC0016440. A portion of this research was performed using EMSL (Ringgold ID 130367), a DOE Office of Science User Facility sponsored by the Office of Biological and Environmental Research. One or more of the authors is employed by a commercial company: Ventana Medical Systems, Horsely Witten Group, Viosimo LLC. This does not alter our adherence to PLOS ONE policies on sharing data and materials.
Figures


Similar articles
-
Anaerobic respiration pathways and response to increased substrate availability of Arctic wetland soils.Environ Sci Process Impacts. 2020 Oct 1;22(10):2070-2083. doi: 10.1039/d0em00124d. Epub 2020 Sep 7. Environ Sci Process Impacts. 2020. PMID: 33084697
-
Distinct Anaerobic Bacterial Consumers of Cellobiose-Derived Carbon in Boreal Fens with Different CO2/CH4 Production Ratios.Appl Environ Microbiol. 2017 Feb 1;83(4):e02533-16. doi: 10.1128/AEM.02533-16. Print 2017 Feb 15. Appl Environ Microbiol. 2017. PMID: 27913414 Free PMC article.
-
Soil properties and sediment accretion modulate methane fluxes from restored wetlands.Glob Chang Biol. 2018 Sep;24(9):4107-4121. doi: 10.1111/gcb.14124. Epub 2018 Apr 10. Glob Chang Biol. 2018. PMID: 29575340
-
Dynamics of microbial communities and CO2 and CH4 fluxes in the tundra ecosystems of the changing Arctic.J Microbiol. 2019 May;57(5):325-336. doi: 10.1007/s12275-019-8661-2. Epub 2019 Jan 16. J Microbiol. 2019. PMID: 30656588 Review.
-
Methane emissions from wetlands: biogeochemical, microbial, and modeling perspectives from local to global scales.Glob Chang Biol. 2013 May;19(5):1325-46. doi: 10.1111/gcb.12131. Epub 2013 Feb 11. Glob Chang Biol. 2013. PMID: 23505021 Review.
Cited by
-
Applications of Fourier Transform-Infrared spectroscopy in microbial cell biology and environmental microbiology: advances, challenges, and future perspectives.Front Microbiol. 2023 Nov 21;14:1304081. doi: 10.3389/fmicb.2023.1304081. eCollection 2023. Front Microbiol. 2023. PMID: 38075889 Free PMC article. Review.
-
Quantifying the inhibitory impact of soluble phenolics on anaerobic carbon mineralization in a thawing permafrost peatland.PLoS One. 2022 Feb 2;17(2):e0252743. doi: 10.1371/journal.pone.0252743. eCollection 2022. PLoS One. 2022. PMID: 35108267 Free PMC article.
-
Impact of storage and extraction methods on peat soil microbiomes.PeerJ. 2024 Dec 23;12:e18745. doi: 10.7717/peerj.18745. eCollection 2024. PeerJ. 2024. PMID: 39726749 Free PMC article.
-
Genomic insights into redox-driven microbial processes for carbon decomposition in thawing Arctic soils and permafrost.mSphere. 2024 Jul 30;9(7):e0025924. doi: 10.1128/msphere.00259-24. Epub 2024 Jun 11. mSphere. 2024. PMID: 38860762 Free PMC article.
References
-
- Bridgham SD, Megonigal JP, Keller JK, Bliss NB, Trettin C. The carbon balance of North American wetlands. Wetlands. 2006. December 1;26(4):889–916.
-
- Bridgham SD, Johnston CA, Pastor J, Updegraff K. Potential feedbacks of northern wetlands on climate change. BioScience. 1995. April 1;45(4):262–74.
-
- Updegraff K, Pastor J, Bridgham SD, Johnston CA. Environmental and substrate controls over carbon and nitrogen mineralization in northern wetlands. Ecological applications. 1995. February;5(1):151–63.
-
- Schädel C, Bader MK, Schuur EA, Biasi C, Bracho R, Čapek P, et al.. Potential carbon emissions dominated by carbon dioxide from thawed permafrost soils. Nature Climate Change. 2016. October;6(10):950–3.
-
- Ma S, Jiang J, Huang Y, Shi Z, Wilson RM, Ricciuto D, et al.. Data‐constrained projections of methane fluxes in a Northern Minnesota Peatland in response to elevated CO2 and warming. Journal of Geophysical Research: Biogeosciences. 2017. November;122(11):2841–61.
Publication types
MeSH terms
Substances
LinkOut - more resources
Full Text Sources
Other Literature Sources

