

Registration of spatio-temporal point clouds of plants for phenotyping
- PMID: 33630896
- PMCID: PMC7906482
- DOI: 10.1371/journal.pone.0247243
Registration of spatio-temporal point clouds of plants for phenotyping
Abstract
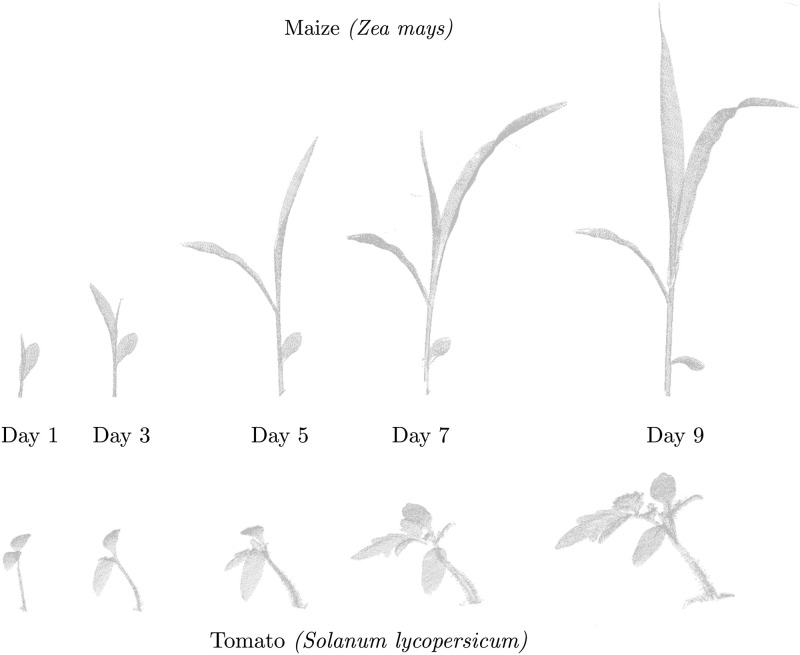
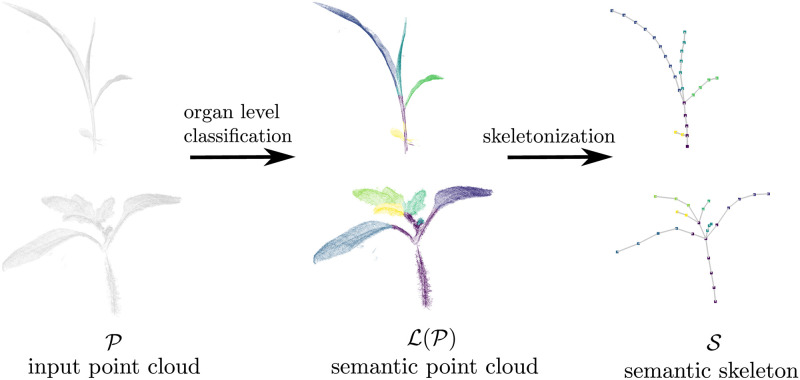
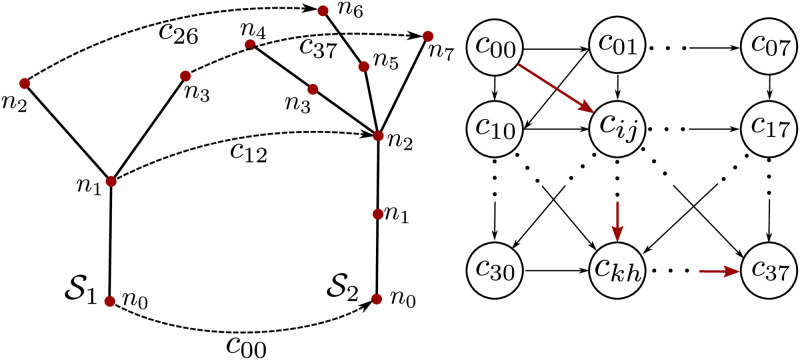
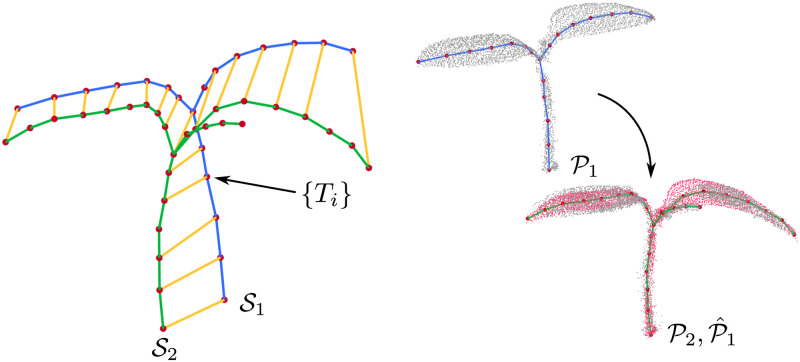
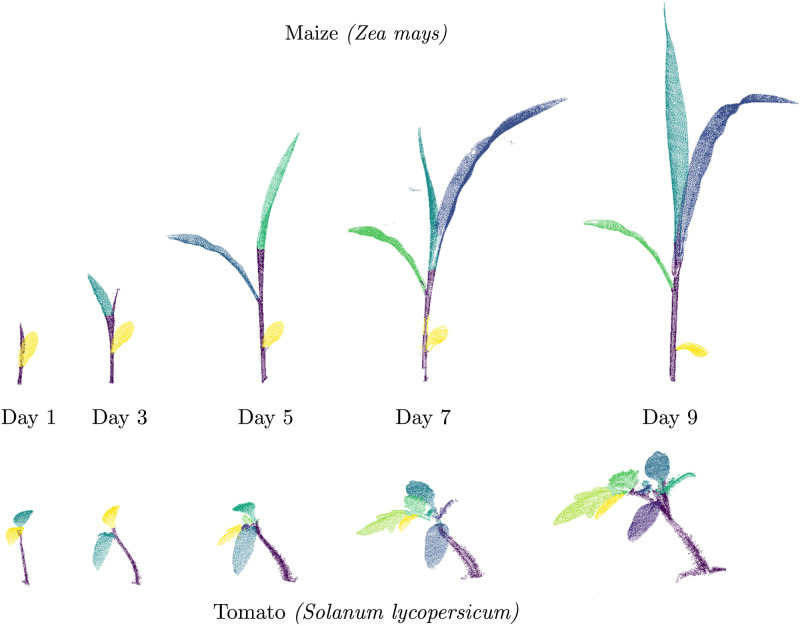
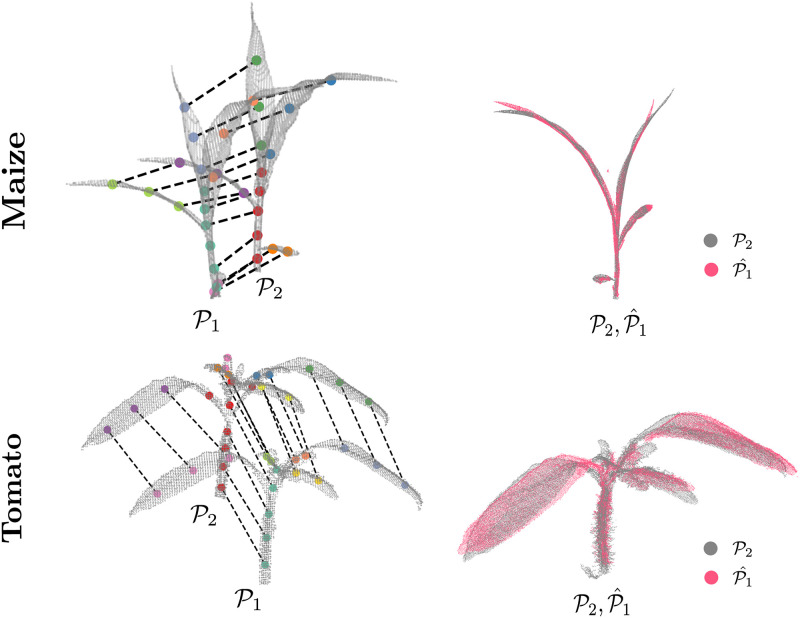
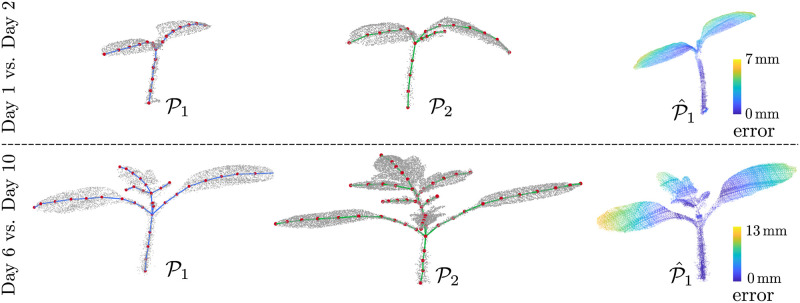
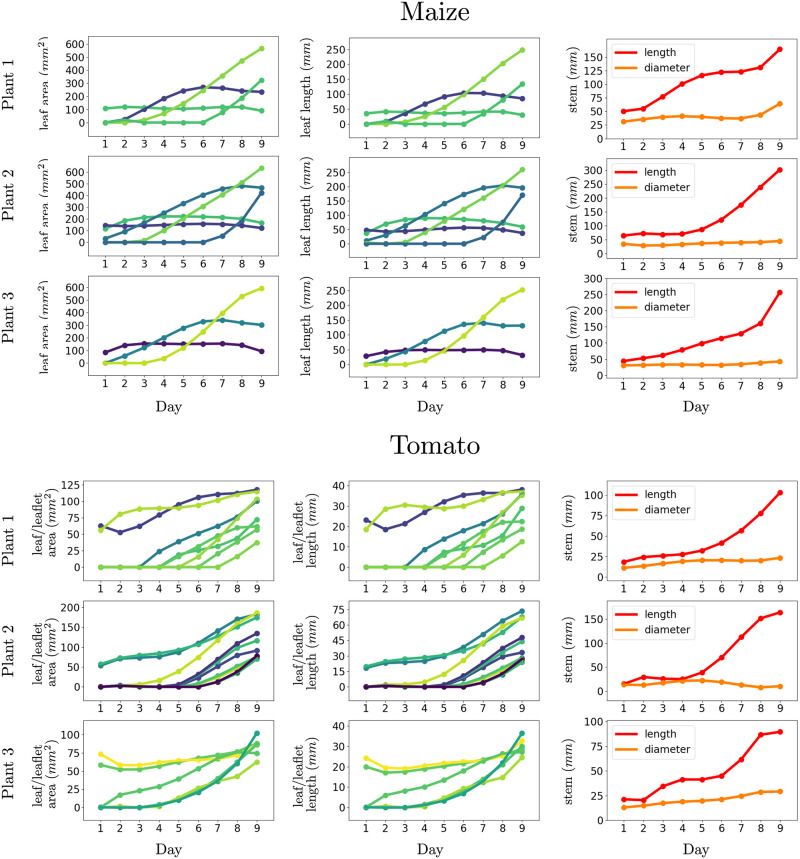
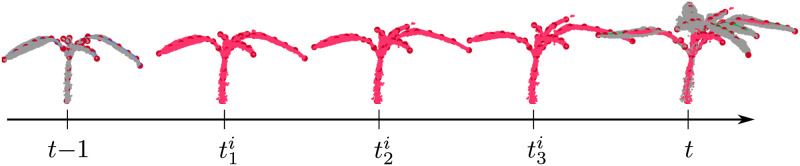
Plant phenotyping is a central task in crop science and plant breeding. It involves measuring plant traits to describe the anatomy and physiology of plants and is used for deriving traits and evaluating plant performance. Traditional methods for phenotyping are often time-consuming operations involving substantial manual labor. The availability of 3D sensor data of plants obtained from laser scanners or modern depth cameras offers the potential to automate several of these phenotyping tasks. This automation can scale up the phenotyping measurements and evaluations that have to be performed to a larger number of plant samples and at a finer spatial and temporal resolution. In this paper, we investigate the problem of registering 3D point clouds of the plants over time and space. This means that we determine correspondences between point clouds of plants taken at different points in time and register them using a new, non-rigid registration approach. This approach has the potential to form the backbone for phenotyping applications aimed at tracking the traits of plants over time. The registration task involves finding data associations between measurements taken at different times while the plants grow and change their appearance, allowing 3D models taken at different points in time to be compared with each other. Registering plants over time is challenging due to its anisotropic growth, changing topology, and non-rigid motion in between the time of the measurements. Thus, we propose a novel approach that first extracts a compact representation of the plant in the form of a skeleton that encodes both topology and semantic information, and then use this skeletal structure to determine correspondences over time and drive the registration process. Through this approach, we can tackle the data association problem for the time-series point cloud data of plants effectively. We tested our approach on different datasets acquired over time and successfully registered the 3D plant point clouds recorded with a laser scanner. We demonstrate that our method allows for developing systems for automated temporal plant-trait analysis by tracking plant traits at an organ level.
Conflict of interest statement
The authors have declared that no competing interests exist.
Figures
Similar articles
-
Pheno4D: A spatio-temporal dataset of maize and tomato plant point clouds for phenotyping and advanced plant analysis.PLoS One. 2021 Aug 18;16(8):e0256340. doi: 10.1371/journal.pone.0256340. eCollection 2021. PLoS One. 2021. PMID: 34407122 Free PMC article.
-
Surface feature based classification of plant organs from 3D laserscanned point clouds for plant phenotyping.BMC Bioinformatics. 2013 Jul 27;14:238. doi: 10.1186/1471-2105-14-238. BMC Bioinformatics. 2013. PMID: 23890277 Free PMC article.
-
An Accurate Skeleton Extraction Approach From 3D Point Clouds of Maize Plants.Front Plant Sci. 2019 Mar 7;10:248. doi: 10.3389/fpls.2019.00248. eCollection 2019. Front Plant Sci. 2019. PMID: 30899271 Free PMC article.
-
Measuring crops in 3D: using geometry for plant phenotyping.Plant Methods. 2019 Sep 3;15:103. doi: 10.1186/s13007-019-0490-0. eCollection 2019. Plant Methods. 2019. PMID: 31497064 Free PMC article. Review.
-
Cell to whole-plant phenotyping: the best is yet to come.Trends Plant Sci. 2013 Aug;18(8):428-39. doi: 10.1016/j.tplants.2013.04.008. Epub 2013 May 23. Trends Plant Sci. 2013. PMID: 23706697 Review.
Cited by
-
PhenoTrack3D: an automatic high-throughput phenotyping pipeline to track maize organs over time.Plant Methods. 2022 Dec 8;18(1):130. doi: 10.1186/s13007-022-00961-4. Plant Methods. 2022. PMID: 36482291 Free PMC article.
-
3D data-augmentation methods for semantic segmentation of tomato plant parts.Front Plant Sci. 2023 Jun 12;14:1045545. doi: 10.3389/fpls.2023.1045545. eCollection 2023. Front Plant Sci. 2023. PMID: 37377799 Free PMC article.
-
How to make sense of 3D representations for plant phenotyping: a compendium of processing and analysis techniques.Plant Methods. 2023 Jun 23;19(1):60. doi: 10.1186/s13007-023-01031-z. Plant Methods. 2023. PMID: 37353846 Free PMC article. Review.
-
Cotton morphological traits tracking through spatiotemporal registration of terrestrial laser scanning time-series data.Front Plant Sci. 2024 Aug 1;15:1436120. doi: 10.3389/fpls.2024.1436120. eCollection 2024. Front Plant Sci. 2024. PMID: 39148622 Free PMC article.
-
PSegNet: Simultaneous Semantic and Instance Segmentation for Point Clouds of Plants.Plant Phenomics. 2022 May 23;2022:9787643. doi: 10.34133/2022/9787643. eCollection 2022. Plant Phenomics. 2022. PMID: 35693119 Free PMC article.
References
-
- Paulus S, Schumann H, Kuhlmann H, Léon J. High-precision laser scanning system for capturing 3D plant architecture and analysing growth of cereal plants. Biosystems Engineering. 2014;121:1–11. 10.1016/j.biosystemseng.2014.01.010 - DOI
Publication types
MeSH terms
LinkOut - more resources
Full Text Sources
Other Literature Sources
