. 2021 Feb 25;16(2):e0247477.
doi: 10.1371/journal.pone.0247477. eCollection 2021.

Mathematical modelling of post-filter ionized calcium during citrate anticoagulated continuous renal replacement therapy

Affiliations

Mathematical modelling of post-filter ionized calcium during citrate anticoagulated continuous renal replacement therapy

Innas Forsal et al. PLoS One. .

Abstract

Background/aims: Post-filter ionized calcium (iCa) measured on a blood gas analyzer (BGA) during regional citrate anticoagulated continuous renal replacement therapy (CRRT) are needed to control the regime. This increases the workload and requires attention including interpretation of blood analyses. Two algorithms were developed to calculate the post-filter iCa instead. The first algorithm used measured systemic total calcium and the second used a selected set of values from an initial blood gas sample as input.

Methods: Calculated post-filter iCa values were compared to real blood gas analyses. 57 patients treated at the intensive care unit at Skåne University Hospital in Lund during 2010-2017 were included after applying inclusion and exclusion criteria. Clinical and machine parameters were collected from the electronic medical records. Non-quality checked data contained 1240 measurements and quality checked data contained 1034 measurements.

Results: The first algorithm using measured systemic total calcium resulted in slightly better precision and trueness with an average difference between the predicted and measured post-filter iCa concentration of 0.0185±0.0453 mmol/L for quality checked data, p<0.001. Neither algorithm could detect all instances requiring intervention.

Conclusion: The algorithms were able to estimate in range postfilter iCa values with great trueness and precision. However, they had some difficulties to estimate out-of-range postfilter iCa values. More work is needed to improve the algorithms especially in their citrate-modelling.


Conflict of interest statement

Forsal, Nilsson and Wieslander are employed by Baxter Healthcare Corporation. Bodelsson and Broman are employed by Skåne University Hospital. Baxter Healthcare Corporation provided salaries for the authors IF, AN, AW, but did not have any additional role in the study design, data collection and analysis or decision to publish. No further competing interests exist. No commercial affiliation will alter our adherence to PLOS ONE policies on sharing data and materials.

Figures

Fig 1
Fig 1. Flow diagram for inclusion and exclusion criteria for patient enrollment and measurement points analyzed.
Fig 2
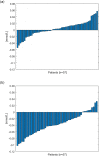
Fig 2. Average differences between measured post-filter iCa and calculated post-filter iCa for quality checked data for Algorithm 1 (2a) and Algorithm 2 (2b).
There are instances when the algorithms are returning values both higher and lower to the BGA. Algorithm 2 has a tendency to underestimate postfilter iCa, while Algorithm 1 does not seem to have the same tendency.
Fig 3
Fig 3
Regression plots for Algorithm 1 (3a) and Algorithm 2 (3b). r2 is the Pearson R-value squared, SSE is the sum of squared error. The equation for the regression line is also calculated and shown as a straight black line. The ideal equation would be y = x and shown as a dotted black line. The differences between the calculated value and the measured value are shown for algorithm 1 (3c) and algorithm 2 (3d), it can be discovered that the calculated value overestimate more the higher the measured postfilter value is. This could suggest a systemic confounding factor, most likely in the mathematics predicting the citrate concentration in the patient.
Fig 4
Fig 4. Measured versus calculated postfilter iCa values in a patient, with no obvious explanation on changes in measured BGA post-filter iCa values.
There were no machine setting changes or changes in systemic iCa or other parameters that could explain the decrease in the BGA post-filter iCa over time (starting at 37th hour into the treatment and continuing to the 68th hour). Of note, the treatment was stopped at the 37th hour and restarted at the 39th hour, at a high postfilter iCa value. Most probably the pause in the treatment has an impact. What can also be noted is that the calculated values follow the decline.

Similar articles

Cited by

References

    1. Kramer L, Bauer E, Joukhadar C, Strobl W, Gendo A, Madl C, et al.. Citrate pharmacokinetics and metabolism in cirrhotic and noncirrhotic critically ill patients. Crit Care Med. 2003; 31: 2450–2455. 10.1097/01.CCM.0000084871.76568.E6 - DOI - PubMed
    1. Sternby J, Nilsson A, Garred L. Diffusive-convective mass transfer rates for solutes present on both sides of a dilayzer membrane. ASAIO. 2005; 51: 246–251. 10.1097/01.mat.0000159382.33864.4d - DOI - PubMed
    1. Joannidis M, Oudemans-van Straaten H. Patency of the circuit in continuous renal replacement therapy. Crit Care. 2007; 11: 218. 10.1186/cc5937 - DOI - PMC - PubMed
    1. Pinnick R, V. Wiegmann T, Diederich D. Regional Citrate Anticoagulation for Hemodialysis in the Patient at High Risk for Bleeding. New Engl J Med. 1983; 308: 258–261. 10.1056/NEJM198302033080506 - DOI - PubMed
    1. Davenport A. What are the anticoagulation options for intermittent hemodialysis? Nat Rev Nephrol. 2011; 7: 499–508. 10.1038/nrneph.2011.88 - DOI - PubMed

LinkOut - more resources