. 2021 May 6;28(5):877-893.e9.
doi: 10.1016/j.stem.2021.01.016. Epub 2021 Feb 24.

Regional identity of human neural stem cells determines oncogenic responses to histone H3.3 mutants

Affiliations

Regional identity of human neural stem cells determines oncogenic responses to histone H3.3 mutants

Raul Bardini Bressan et al. Cell Stem Cell. .

Abstract

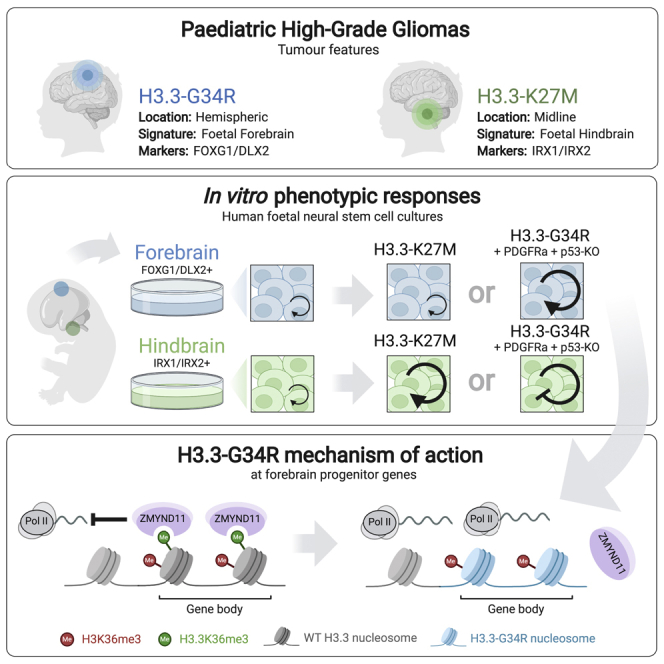
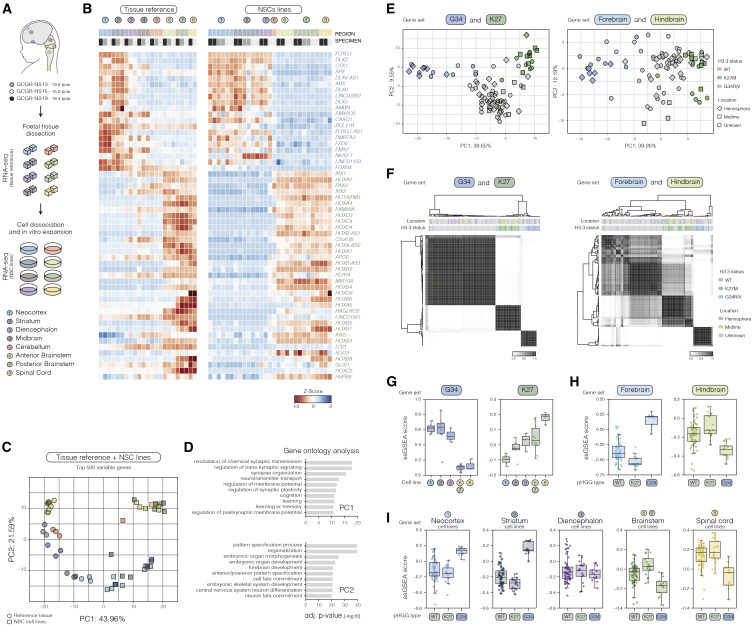
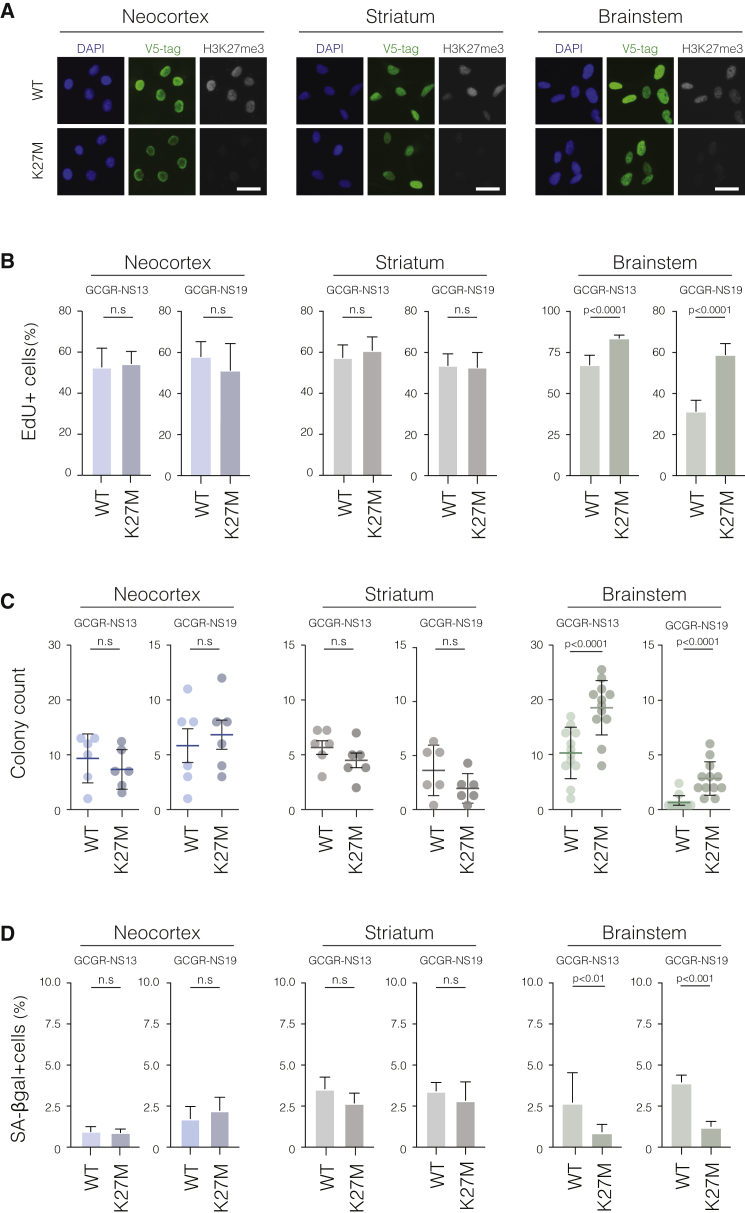
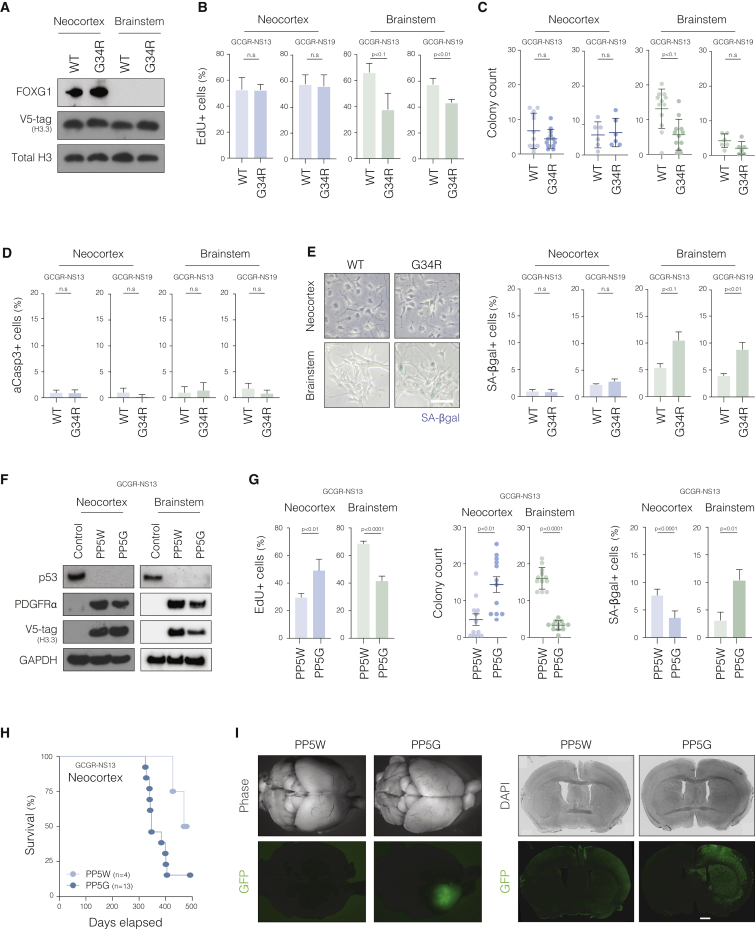
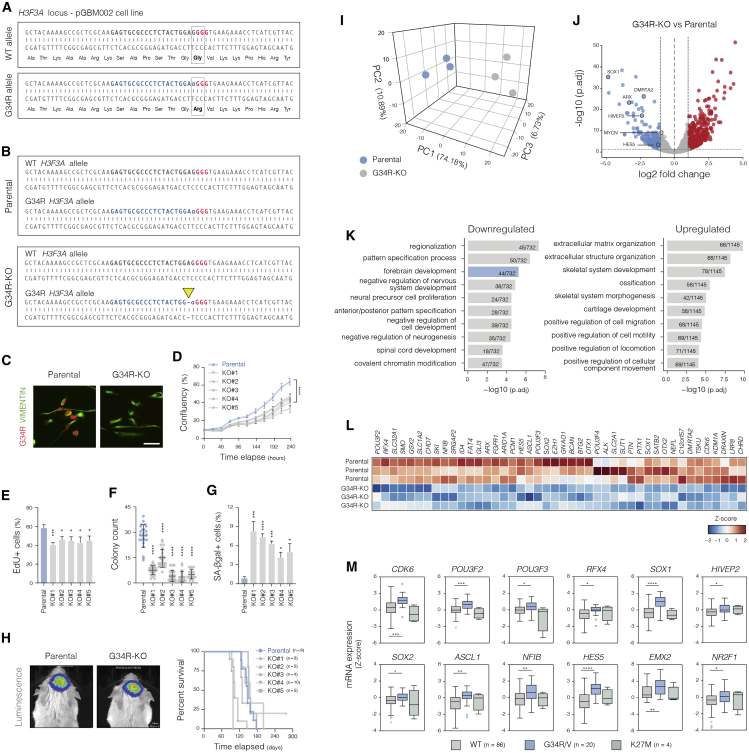
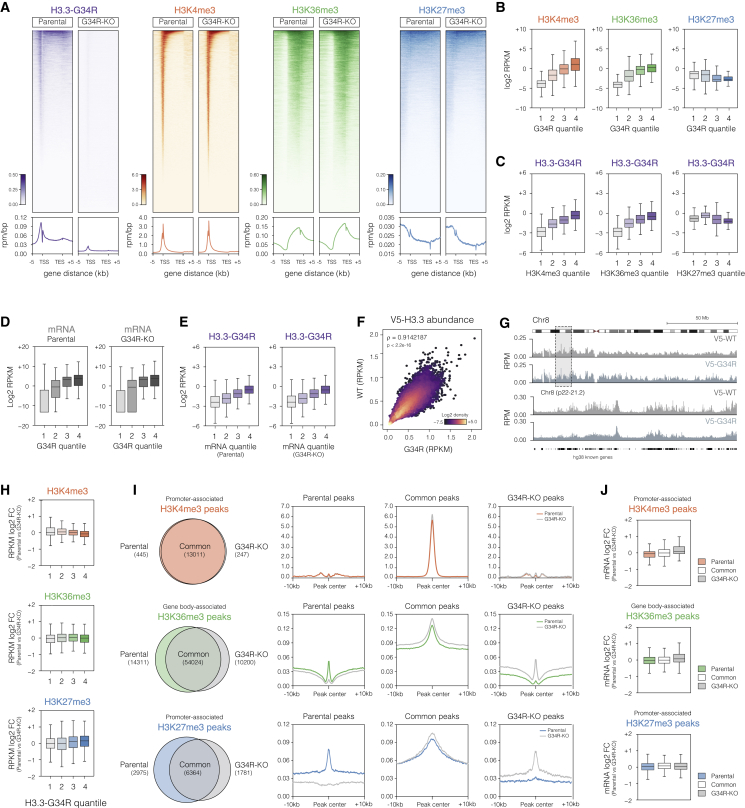
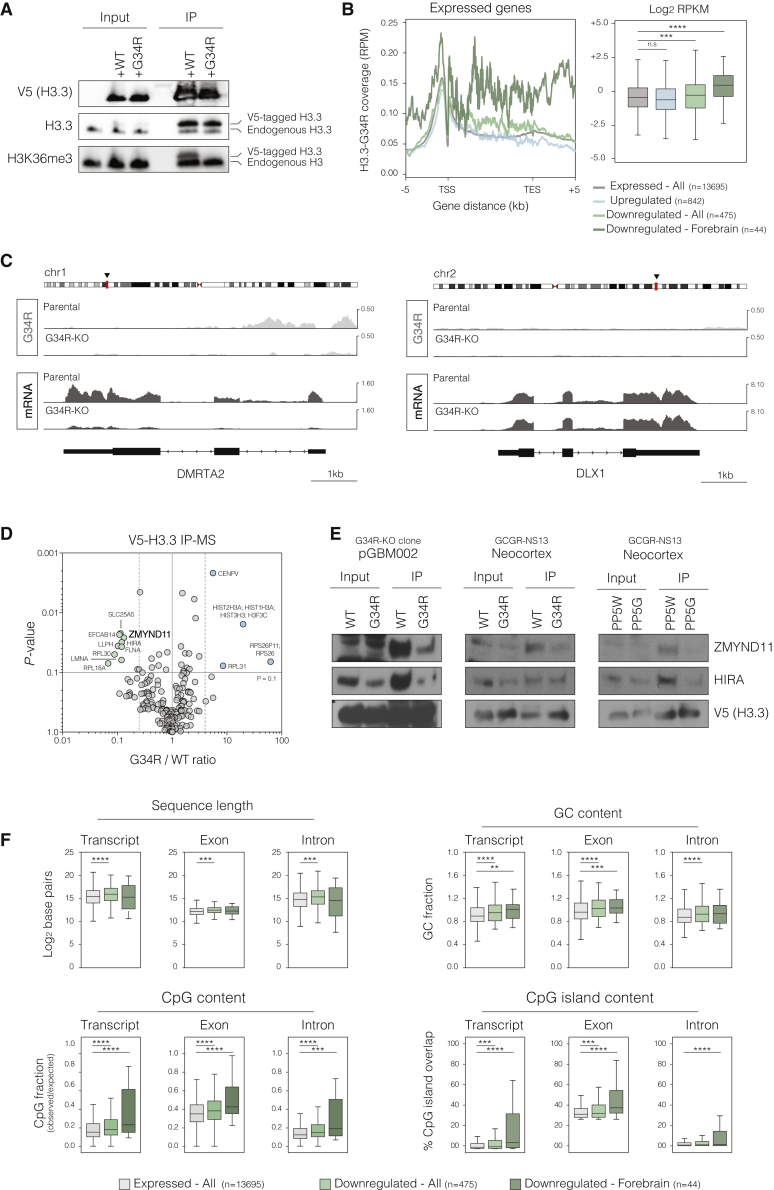
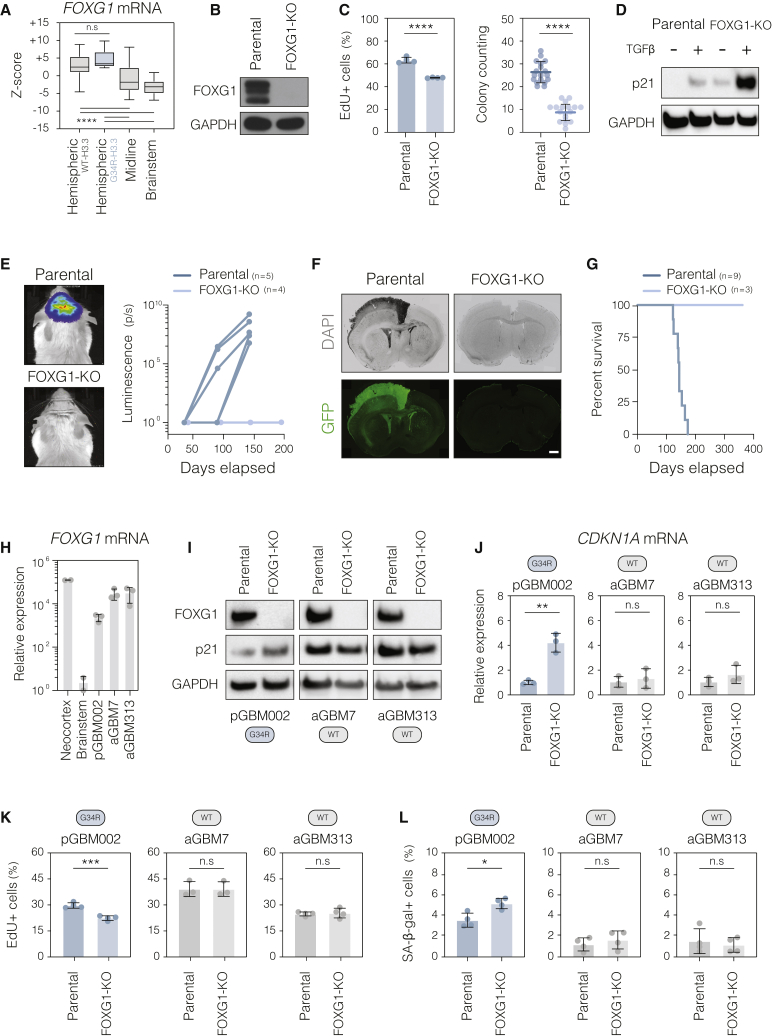
Point mutations within the histone H3.3 are frequent in aggressive childhood brain tumors known as pediatric high-grade gliomas (pHGGs). Intriguingly, distinct mutations arise in discrete anatomical regions: H3.3-G34R within the forebrain and H3.3-K27M preferentially within the hindbrain. The reasons for this contrasting etiology are unknown. By engineering human fetal neural stem cell cultures from distinct brain regions, we demonstrate here that cell-intrinsic regional identity provides differential responsiveness to each mutant that mirrors the origins of pHGGs. Focusing on H3.3-G34R, we find that the oncohistone supports proliferation of forebrain cells while inducing a cytostatic response in the hindbrain. Mechanistically, H3.3-G34R does not impose widespread transcriptional or epigenetic changes but instead impairs recruitment of ZMYND11, a transcriptional repressor of highly expressed genes. We therefore propose that H3.3-G34R promotes tumorigenesis by focally stabilizing the expression of key progenitor genes, thereby locking initiating forebrain cells into their pre-existing immature state.

Keywords: DIPG; ZMYND11; cancer; forebrain; glioblastoma; histone H3.3; neural stem cells; neurodevelopment; pediatric high-grade glioma.


Conflict of interest statement

Declaration of interests S.M.P. is a founder and shareholder of Cellinta Ltd., a biotechnology startup that is developing cancer therapeutics, including glioblastoma. S.M.P. is also an inventor on a University of Edinburgh patent related to NSC culture methods (WO2005121318A3). The other authors declare no competing interests.

Figures

None
Graphical abstract
Figure 1
Figure 1
Core transcriptional signatures of regional identity are captured in human primary fetal NSC cultures and define pHGG subtypes (A) Overview of the approach used for derivation of human fetal region-specific NSC cultures. Three fetal specimens aged 13.5, 15.0, and 19.3 weeks of gestational age (WGA) (GCGR-NS13, GCGR-NS15, and GCGR-NS19, respectively) were used. Total RNA collected from the freshly dissected tissue segments was used as a reference control. (B) Heatmap showing expression of forebrain- and hindbrain-specific genes in the freshly dissected tissue and matched NSC cultures. Forebrain- and hindbrain-specific gene symbols are shown in blue and green lettering, respectively. See STAR methods for details on generation of region-specific signatures. (C) Principal-component analysis (PCA) of primary fetal tissue samples and NSC lines on the basis of 500 genes with the highest variance across all samples. (D) Gene Ontology analysis of PCA loadings for principal component 1 (PC1) and principal component 2 (PC2). PC1, which segregates NSC lines from primary tissue samples, is enriched in neuronal differentiation terms. PC2 separates samples according to anatomical region of origin and is enriched in regionalization and anteroposterior specification terms. (E) PCA plots of patient pHGG tumor samples. Left panel: PCA based on tumor-derived G34- and K27-mutant signatures. Right panel: PCA based on forebrain- and hindbrain-specific gene sets as in (A). (F) Consensus clustering of patient pHGG tumor samples using G34/K27 (left) and forebrain/hindbrain (right) gene sets. Heatmaps are clustered using hierarchical clustering with Euclidean distance and average linkage criteria into three predominant groups corresponding to tumor H3.3 status. (G) Boxplots of ssGSEA enrichment scores for K27 and G34 signatures among the established region-specific fetal NSC lines. Cell line numbering corresponds to the anatomical regions in (A). Boxes show median and first and third quartiles, and whiskers extend to 1.5 × the interquartile range (IQR). (H) Boxplots of ssGSEA enrichment scores comparing forebrain and hindbrain signatures extracted from the primary fetal tissue datasets among pHGG H3.3 subtypes. (I) Boxplots of ssGSEA enrichment scores comparing the gene sets extracted from the established NSC lines from each position among pHGG H3.3 subtypes. See also Figure S2 and Table S1.
Figure 2
Figure 2
H3.3-K27M preferentially increases growth of brainstem NSCs (A) Immunocytochemistry analysis confirming comparable levels of V5-tagged WT and K27M H3.3 expression in the three regional NSC lines. Global loss of H3K27me3 is observed in H3.3-K27M-expressing cells. Representative images of the lines derived from specimen GCGR-NS13 are shown. Scale bar: 20 μm. (B–D) Quantification of EdU incorporation, colony formation activity, and SA-βgal reactivity in the regional NSC lines carrying H3.3-WT and H3.3-K27M constructs. Plots depict mean ± SD in the indicated cell lines. Student’s t test p values are shown. n.s, non-significant. n = 3 or 4 independent experiments performed with three technical replicas each.
Figure 3
Figure 3
H3.3-G34R triggers differential phenotypic responses in forebrain and brainstem NSCs (A) Immunoblot confirming comparable expression of V5-tagged H3.3 in the NSC lines carrying WT and G34R H3.3 constructs. Representative images from GCGR-NS13 lines are shown. Forebrain marker FOXG1 is used as a control. (B) Quantification of EdU incorporation in the regional NSC lines expressing H3.3-WT and H3.3-G34R. Plots depict mean ± SD in the indicated cell lines. Student’s t test p values are shown. n = 3 or 4 independent experiments performed with three technical replicas each. (C) Quantification of colony formation activity of regional NSC lines expressing H3.3-WT and H3.3-G34R. Individual dots represent the absolute colony counting per well. Horizontal lines represent mean ± SD. Student’s t test p values are shown. (D and E) Quantification of apoptotic (active caspase-3-positive) and senescent (SA-βgal-positive) cells in the regional NSC lines carrying H3.3-WT and H3.3-G34R constructs. Plots depict mean ± SD percentage of positive cells. p value by Student’s t test. n = 3 independent experiments performed with three or four technical replicas each. (F) Immunoblot confirming loss of P53 protein and ectopic expression of V5-tagged H3.3 and PDGFRa in the engineered GCGR-NS13 neocortex and brainstem PP5W and PP5G cells. Non-edited cells were used as controls. (G) Phenotypic in vitro characterization of GCGR-NS13 neocortex and brainstem PP5W and PP5G cells. Plots show quantification of EdU incorporation (n = 3), colony formation (n = 12), and SA-βgal assays (n = 3). (H) Kaplan-Meier curve showing survival data of immunocompromised mice transplanted with GCGR-NS13 neocortical PP5W and PP5G cells. (I) Analysis of brain tissue from mice transplanted with GFP-labeled neocortical PP5W and PP5G cells. Left panel shows microscopic views of freshly dissected tissue. Right panel shows immunohistochemistry images (coronal sections) of the corresponding specimens. Transplanted human cells are labeled by GFP. Scale bar: 1.5 mm. See also Figure S3.
Figure 4
Figure 4
Genetic ablation of mutant H3F3A allele in patient-derived NSC line reveals forebrain neuroprogenitor genes as downstream targets of H3.3-G34R (A) Schematics of the strategy used to inactivate the H3F3A G34R allele through CRISPR-Cas9 gene editing. The G-to-A nucleotide substitution causing the G34R mutation occurs 5′ adjacent to a GGG stretch (red) that serves as a protospacer adjacent motif (PAM) for Cas9 recognition. As mismatches within the PAM-proximal region preclude Cas9 cleavage, this allows the design of a sgRNA (blue sequence) that specifically cuts the G34R allele. Dashed rectangles show codons for residues Gly34 (WT) or Arg34 (G34R). (B) Genotyping result of the parental and a representative G34R-KO clone. WT allele remains intact, while G34R allele harbors a frameshifting 1 bp deletion at the predicted cut site (yellow arrow). (C) Immunocytochemistry confirms loss of H3.3-G34R protein expression in the G34R-KO cells. Parental line and representative G34R-KO clone are shown. Scale bar: 50 μm. (D) Confluence analysis indicates impaired in vitro growth of G34R-KO clones. ∗∗∗∗Adjusted p < 0.0001 by one-way ANOVA followed by Dunnett’s test (each G34R-KO clone versus parental cells at 240 h elapsed). Plot shows results of one representative experiment performed with four technical replicas. (E–G) Quantification of EdU incorporation, colony formation, and SA-βgal reactivity in parental and clonal G34R-KO pGBM002 cells. Plot depicts mean ± SD. p < 0.05, ∗∗∗p < 0.001, and ∗∗∗∗p < 0.0001 by one-way ANOVA followed by Dunnett’s multiple-comparisons test (mean of each clone versus parental). n = 4 independent experiments performed with three or four technical replicas each. (H) Results of xenotransplantation experiments with patient-derived pGBM002 cells. Left panel shows representative images of in vivo bioluminescence imaging of intracranial tumors formed by parental and a G34R-KO clonal line. Kaplan-Meier curve (right) shows survival data of mice transplanted with the parental cells (blue line) and G34R-KO clones (gray lines). (I) PCA plot confirming consistent transcriptional changes between parental pGBM002 (three independent passages) and three G34R-KO clonal lines (one passage each). The 500 genes with highest variance across samples were used for the PCA. (J) Volcano plot showing differentially expressed genes between parental and G34R-KO clonal lines. Upregulated and downregulated genes in the G34R-KO clones are shown in red and blue, respectively. Vertical dotted lines mark absolute log2 fold change > 1. Horizontal lines, false discovery rate (FDR) < 0.05. (K) Gene Ontology (GO) analysis of downregulated and upregulated genes (FDR < 0.05) in G34R-KO clones. (L) Heatmap showing expression of genes within the “Forebrain Development” GO term found to be downregulated in G34R-KO clones. (M) Boxplot showing expression levels of the indicated forebrain progenitor-related genes in hemispheric pHGG patient tumor samples. Data were retrieved from the pediatric cBioPortal (see STAR methods). Only specimens whose hemispheric location could be ascertained were included. p < 0.05, ∗∗p < 0.01, ∗∗∗p < 0.001, and ∗∗∗∗p < 0.0001 by Student’s t test (WT versus G34R/V groups). See also Figure S4.
Figure 5
Figure 5
Genome-wide profiling of H3.3 and associated histone H3 marks in isogenic patient-derived H3.3-G34R pHGG cells (A) Heatmaps and metagene plots showing H3.3-G34R, H3K4me3, H3K36me3, and H3K27me3 ChIP-seq signal at all annotated human genes (hg38 knownGene) in parental and G34R-KO pGBM002 cells. Genes within each heatmap are ranked by abundance of the H3.3-G34R or indicated histone mark in the parental cells. (B) Boxplots depicting abundance of the indicated histone H3 modifications (log2 reads per kilobase of transcript per million mapped reads [RPKM]) at genes grouped into quantiles of G34R abundance. Quantiles 1 and 4 include, respectively, genes with the lowest and highest H3.3-G34R coverage levels. Boxes show median and first and third quartiles, and whiskers extend to 1.5 × the IQR (n = 2 replicates for each histone mark). (C) Boxplots depicting abundance of H3.3-G34R (log2 RPKM) at genes grouped into coverage quantiles of the indicated histone mark. Quantiles 1 and 4 include genes with the lowest and highest levels of each mark, respectively (n = 2). (D) Boxplots depicting total mRNA expression levels (log2 RPKM) per H3.3-G34R quantile in parental and G34R-KO cells (n = 3). (E) Boxplot depicting H3.3-G34R coverage (log2 RPKM) in parental cells per mRNA expression quantiles defined in parental (left) and G34R-KO (right) cells. Quantiles 1 and 4 include, respectively, genes with the lowest and highest absolute mRNA expression levels (n = 2). (F) Scatterplot showing V5-H3.3 coverage per 50 kb genomic bins in G34R-KO cells rescued with V5-tagged H3.3-WT and H3.3-G34R construct. Density reported as log2 density. SCC = 0.91, p < 0.001. (G) Tracks of V5-WT and V5-G34R H3.3 normalized coverage (RPM) over chromosome 8 (upper) and selected region (lower, Chr8 p22-21.2). (H) Log2 fold change (parental versus G34R-KO cells) in H3K4me3, H3K36me3, and H3K27me3 coverage (RPKM) within each H3.3-G34R quartile. (I) Venn diagrams and metagene plots of common and exclusive peaks in pGBM002 parental and G34R-KO lines. Peaks were selected as promoter specific (±2 kb from transcription start site [TSS]) for H3K4me3 and H3K27me3 histone marks, and gene body associated (between TSS and transcription end site [TES]) for H3K36me3. (J) RNA-seq mRNA log2 fold change (parental vs. G34R-KO) of genes associated with peaks defined in (I). See also Figures S5 and S6.
Figure 6
Figure 6
G34R mutation precludes binding to the transcriptional repressor ZMYND11 (A) Immunoblotting of immunoprecipitated H3.3-WT and H3.3-G34R ectopically expressed in G34R-KO pGBM002 cells. Endogenous (lower band) and V5-tagged ectopic H3.3 (upper band) are indicated. Loss of K36me3 is specific to ectopic H3.3-G34R. Non-transfected G34R-KO cells were used as controls (first and fourth lanes). (B) Metagene plot (left) and boxplot (right) showing H3.3-G34R coverage for expressed, upregulated, downregulated – all, and downregulated – forebrain associated genes. Expressed genes were defined as those with mean RPKM > 1 within pGBM002 parental samples (see STAR methods). All other gene sets were defined on the basis of differential expression between G34R-KO and parental cells (Figures 4I–4L). ∗∗∗p < 0.005 and ∗∗∗∗p < 0.0001 for pairwise comparisons against the “all expressed” group. See STAR methods for details on the statistical test. (C) Genomic track showing H3.3-G34R enrichment and mRNA expression at DMRTA2 (left) and DLX1 (right) loci. DMRTA2 and DLX2 are shown, respectively, as representative downregulated and unchanged forebrain-related genes. (D) Volcano plot showing differentially bound partners of ectopically expressed WT and G34R H3.3 identified through IP-MS. x axis shows the fold-change value (G34R/WT) and y axis shows p value (−log10 scale) for statistical significance. Absolute 3-fold change and a p value of 0.1 (vertical and horizontal dashed lines, respectively) were used as the threshold cutoffs. Blue and green dots depict partners with increased and decreased binding to H3.3-G34R, respectively. (E) Immunoblotting analysis for ZMYND11 and HIRA co-immunoprecipitated with ectopic V5-H3.3 (WT and G34R) in G34R-KO pGBM002 cells and engineered neocortex NSC models (H3.3 overexpression alone or in the PP5W/PP5G lines). (F) Boxplots showing quantification of sequence features for full transcript and exonic and intronic ranges in the defined gene sets. ∗∗p < 0.05, ∗∗∗p < 0.005, and ∗∗∗∗p < 0.0001 for pairwise comparisons against the “all expressed” group. See STAR methods for details on the statistical test. See also Table S2.
Figure 7
Figure 7
Genetic disruption of FOXG1 impairs tumorigenesis of patient-derived G34R mutant cells (A) Expression levels of FOXG1 mRNA in patient pHGG primary tumors. Data were retrieved from the integrated pHGG transcriptomic dataset available on the pediatric cBioPortal (see STAR methods). ∗∗∗∗p < 0.0001 by one-way ANOVA followed Tukey’s multiple-comparisons test. (B) Immunoblot analysis confirming loss of FOXG1 protein in the pGBM002-knockout clonal line. (C) Quantification of EdU incorporation (24 h pulse) and colony formation activity in parental and FOXG1-knockout pGBM002 cells. Plot depicts mean ± SD. ∗∗∗∗p < 0.0001 by Student’s t test. n = 4 independent experiments performed with three or four technical replicas each. (D) Immunoblot analysis showing increased p21 expression in the FOXG1-knockout clonal line. TGFβ treatment was used to stabilize p21 protein expression as previously described (Seoane et al., 2004). (E) In vivo bioluminescence imaging of mice transplanted with parental and FOXG1-knockout pGBM002 cells. Plot depicts absolute luminescence values (photons per second) per mouse at the indicated time points. Representative images were collected at 150 days following transplantation. (F and G) Representative immunohistochemistry images of the brain tissue and Kaplan-Meier survival curve of immunocompromised mice transplanted with parental and FOXG1-knockout pGBM002 cells. Mice in the FOXG1-KO group were sacrificed after 400 days, and no signs of tumor formation were observed. Scale bar: 1.5 mm. (H) qRT-PCR quantification of FOXG1 expression in H3.3-G34R-mutant pGBM002 and H3.3-WT adult HGG (aGBM7 and aGBM313) lines. Primary fetal neocortex and brainstem NSC lines (specimen GCGR-NS19) were used for comparison. n = 2 or 3 independent passages of each cell line. (I) Western blotting showing protein expression of FOXG1 and p21 in parental and respective FOXG-KO lines. H3.3 status of each line is shown in the round rectangles below the panel. (J) qRT-PCR quantification CDKN1A expression in FOXG1-KO cells. Parental cells were used as normalizer for each pairwise comparison. ∗∗p < 0.01 by Student’s t test. n = 3 independent passages of each cell line. (K and L) Quantification of EdU incorporation (2 h pulse) and SA-βgal reactivity in FOXG1-KO and respective parental lines. Plots depict mean ± SD. p < 0.05 and ∗∗∗p < 0.001 by Student’s t test. n = 3 or 4 technical replicates. See also Figure S7.

Comment in

References

    1. Abbas T., Dutta A. p21 in cancer: intricate networks and multiple activities. Nat. Rev. Cancer. 2009;9:400–414. - PMC - PubMed
    1. Ahmad K., Henikoff S. The histone variant H3.3 marks active chromatin by replication-independent nucleosome assembly. Mol. Cell. 2002;9:1191–1200. - PubMed
    1. Barbie D.A., Tamayo P., Boehm J.S., Kim S.Y., Moody S.E., Dunn I.F., Schinzel A.C., Sandy P., Meylan E., Scholl C. Systematic RNA interference reveals that oncogenic KRAS-driven cancers require TBK1. Nature. 2009;462:108–112. - PMC - PubMed
    1. Bertacchi M., Romano A.L., Loubat A., Tran Mau-Them F., Willems M., Faivre L., Khau van Kien P., Perrin L., Devillard F., Sorlin A. NR2F1 regulates regional progenitor dynamics in the mouse neocortex and cortical gyrification in BBSOAS patients. EMBO J. 2020;39:e104163. - PMC - PubMed
    1. Bjerke L., Mackay A., Nandhabalan M., Burford A., Jury A., Popov S., Bax D.A., Carvalho D., Taylor K.R., Vinci M. Histone H3.3. mutations drive pediatric glioblastoma through upregulation of MYCN. Cancer Discov. 2013;3:512–519. - PMC - PubMed

Publication types