. 2021 May 6;28(5):894-905.e7.
doi: 10.1016/j.stem.2021.02.003. Epub 2021 Feb 24.

Dissecting the impact of regional identity and the oncogenic role of human-specific NOTCH2NL in an hESC model of H3.3G34R-mutant glioma

Affiliations

Dissecting the impact of regional identity and the oncogenic role of human-specific NOTCH2NL in an hESC model of H3.3G34R-mutant glioma

Kosuke Funato et al. Cell Stem Cell. .

Abstract

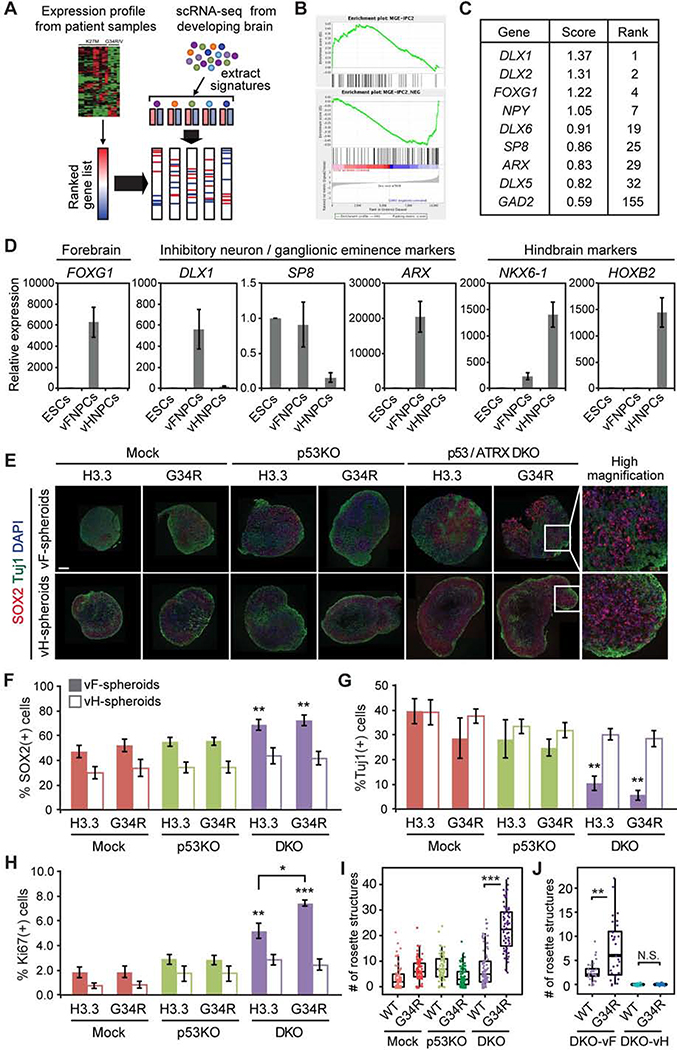
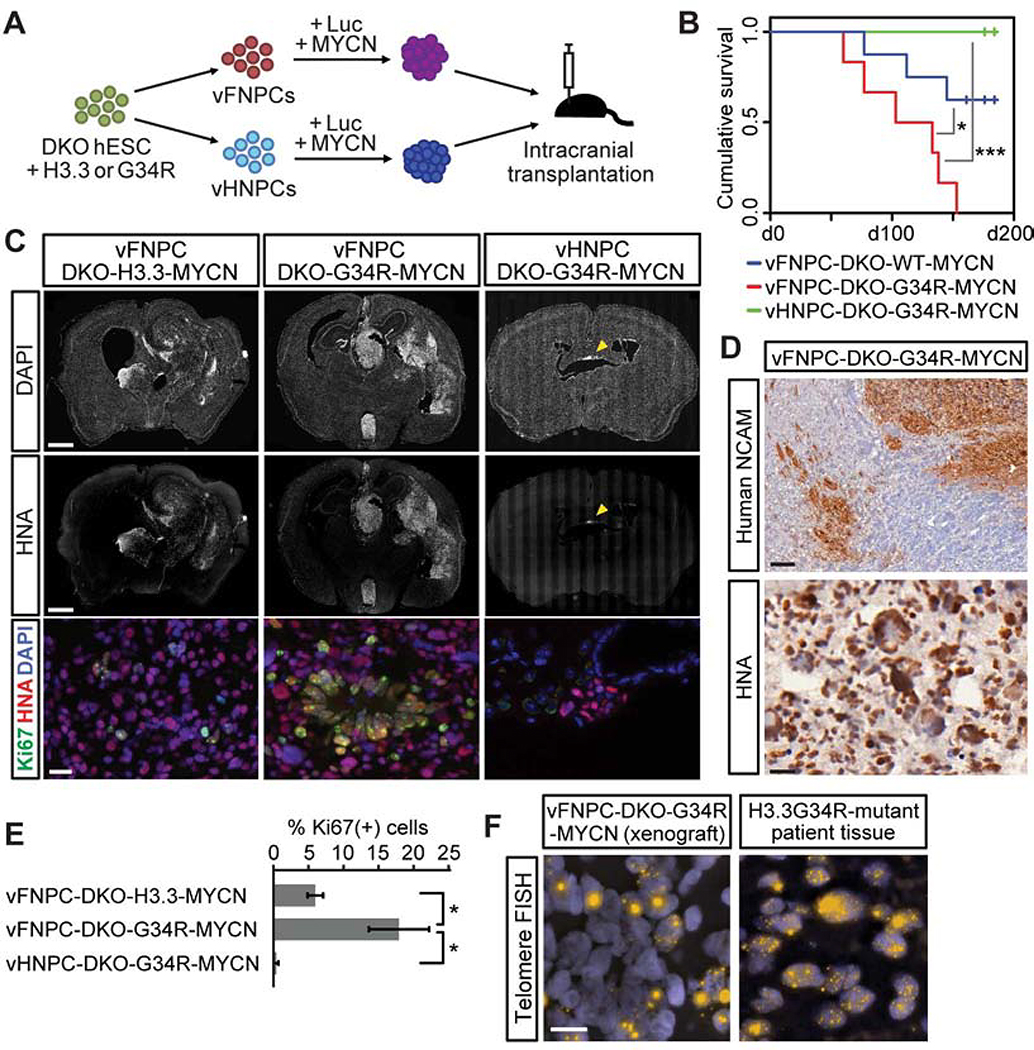
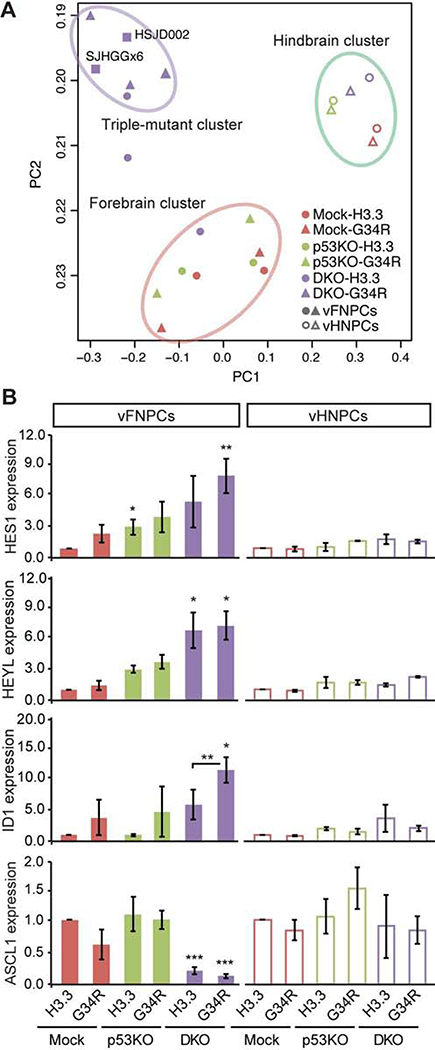
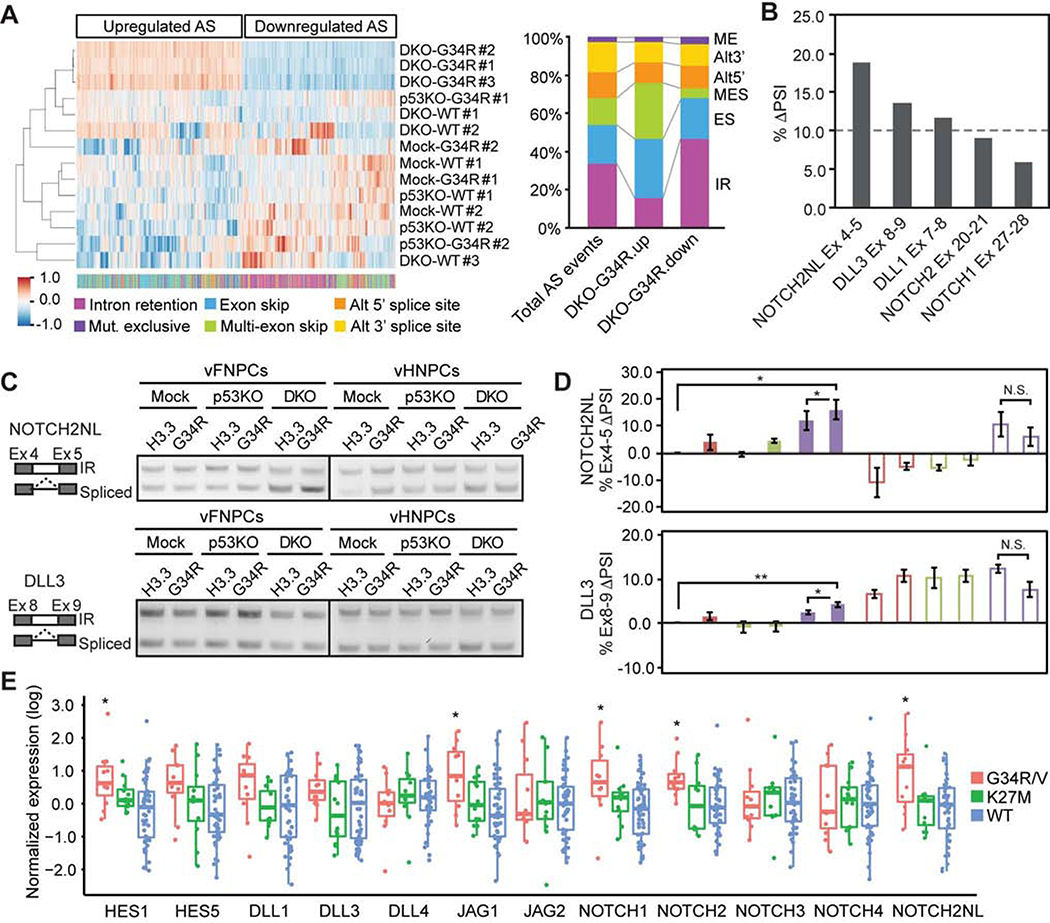
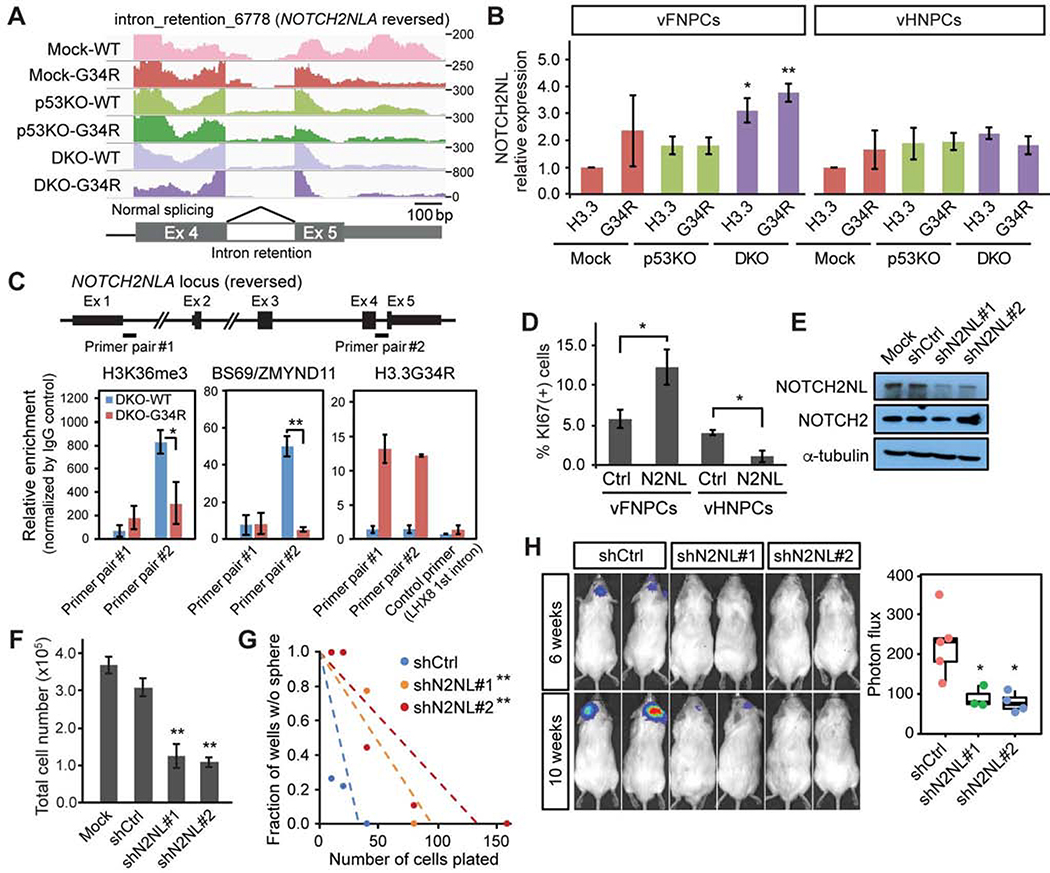
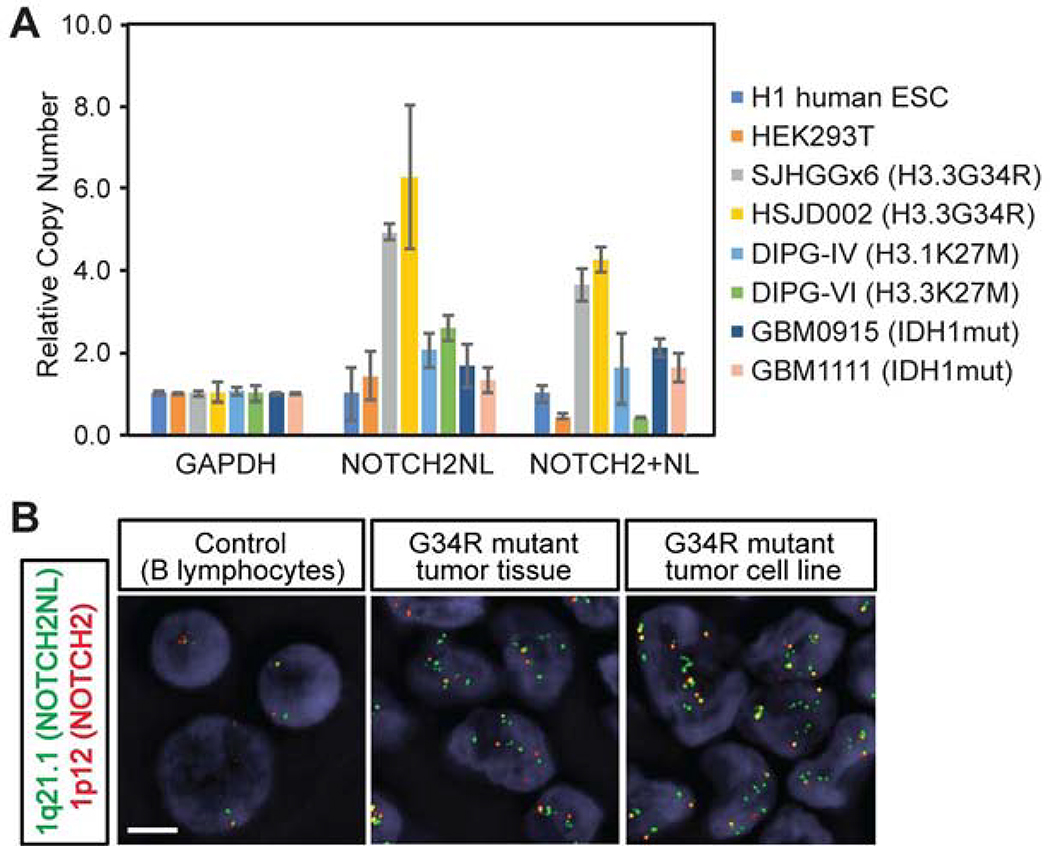
H3.3G34R-mutant gliomas are lethal tumors of the cerebral hemispheres with unknown mechanisms of regional specificity and tumorigenicity. We developed a human embryonic stem cell (hESC)-based model of H3.3G34R-mutant glioma that recapitulates the key features of the tumors with cell-type specificity to forebrain interneuronal progenitors but not hindbrain precursors. We show that H3.3G34R, ATRX, and TP53 mutations cooperatively impact alternative RNA splicing events, particularly suppression of intron retention. This leads to increased expression of components of the Notch pathway, notably NOTCH2NL, a human-specific gene family. We also uncover a parallel mechanism of enhanced NOTCH2NL expression via genomic amplification of its locus in some H3.3G34R-mutant tumors. These findings demonstrate a novel mechanism whereby evolutionary pathways that lead to larger brain size in humans are co-opted to drive tumor growth.

Keywords: ATRX; H3.3G34R; NOTCH2NL; Pluripotent stem cells; TP53; cancer models; high-grade glioma; hindbrain progenitors; histone-mutant glioma; interneuron progenitors; ventral forebrain.


Conflict of interest statement

Declaration of interests The authors declare no competing interests.

Figures

Figure 1.
Figure 1.. Development of hESC-based model of H3.3G34R-mutant HGG
(A) Schematic illustration of expression profile analysis. (B) Representative GSEA plots show enrichment of interneuronal expression signature in H3.3G34R mutant tumors compared to H3K27M mutant tumors. MGE-IPC2: Medial Ganglionic Eminence - Intermediate Progenitor Cell - Cluster 2 (see methods). (C) Table shows a list of genes specifically expressed in H3.3G34R/V-mutant HGG. (D) Lineage-specific expression of marker genes in ventral forebrain neural progenitor cells (vFNPCs) and in ventral hindbrain neural progenitor cells (vHNPCs) was validated by RT-qPCR. Values are normalized to those of H1 embryonic stem cells (ESCs). Bars indicate mean ± S.E.M. (n = 3–4). (E) Composite immunohistochemistry images of frozen sections of neural spheroids from each condition show an incremental increase of SOX2-positive NPCs and decrease of ßIII-tubulin (TUJl)-positive neurons by the combination of mutations. Scale bar, 20 μm. (F-H) Intracellular flow cytometry shows an increase of SOX2-positive NPCs (F), a decrease of TUJl-positive neurons (G), and an increase in the Ki-67 proliferation index (H) by the combination of mutations, in ventral forebrain cultures but not in ventral hindbrain cultures. Bars indicate mean ± S.E.M. (n = 3–6). (I) Box plot shows the number of rosette structures per spheroid in ventral forebrain cultures. More than 50 spheroids were analyzed for each condition. (J) Combination of mutations increased the number of rosette structures per spheroid in DKO ventral forebrain (vF) cultures, but not in DKO ventral hindbrain (vH) cultures. (n = 28–32) P values were calculated by two-sided Welch’s t-test (F-H) or Wilcoxon rank-sum test (I and J). *P < 0.05, **P < 0.01, ***P < 0.001, NS, Not Significant.
Figure 2.
Figure 2.. The H3.3G34R mutation enhances tumorigenicity in a mouse xenograft model.
(A) Schematic illustration of in vivo tumorigenicity assay. (B) Kaplan-Meier survival curve shows quadruple-mutant vFNPCs (vFNPC-DKO-G34R-MYCN) exhibited worse survival than histone-wildtype cells (vFNPC-DKO-H3.3-MYCN) and quadruple-mutant vHNPCs (n = 6–8). (C) Immunofluorescence images of representative sections labeled for human-specific nuclear antigen (HNA) and Ki67 (bottom panel), and counter-stained with DAPI. Hindbrain cells formed non-proliferating small cell clusters (right panel, arrowhead). (D) Immunohistochemistry for human NCAM or human nuclear antigen (HNA) shows infiltration of vFNPC-derived tumor cells into brain parenchyma (top), nuclear pleomorphism and rosette-like structures (bottom). (E) Quantification of proliferating cells in xenografts. Bars indicate mean ± S.E.M. (n = 3–5). (F) Fluorescence in situ hybridization (FISH) for telomeres demonstrates alternative lengthening of telomeres (ALT) in the transplanted cells and in patient tumor cells. Scale bars, 1 mm (C, top and middle); 20 μm (C, bottom); 100 μm (D, top); 20 μm (D, bottom); 10 μm (F). P values were calculated by the log-rank test (B) or two-sided Welch’s t-test (E). *P < 0.05, ***P < 0.001.
Figure 3.
Figure 3.. H3.3G34R and co-occurring mutations alter gene expression profile.
(A) Principal component analysis of RNA-seq data shows a distinct expression profile of DKO-G34R cells, which are clustered together with H3.3G34R-mutant patient-derived cell lines (SJHGGx6 and HSJD002) (upper left). Hindbrain cells form a separate cluster regardless of mutation status (upper right). (B) RT-qPCR confirms the altered expression of the indicated genes by the combination of mutations in vFNPCs, but not in vHNPCs (n = 3–5). P values were calculated by two-sided Welch’s t test. *P < 0.05, **P < 0.01, ***P < 0.001.
Figure 4.
Figure 4.. H3.3G34R and co-occurring mutations alter alternative RNA splicing pattern.
(A) Hierarchical clustering of alternative splicing (AS) events upregulated (924 events) or downregulated (853 events) in triple-mutant vFNPCs (DKO-G34R). Color bar at the bottom indicates the types of AS events. The bar chart shows suppression of intron retention (IR) and enrichment in multi-exon skipping (MES) in DKO-G34R cells. AS events upregulated in DKO-G34R cells show opposite trends compared to downregulated AS events. (B) Intron retention of Notch component genes was impacted in DKO-G34R cells. (C) RT-PCR shows the changes of intron retention in NOTCH2NL and DLL3. (D) Quantitative real-time RT-PCR confirms the changes in intron retention. Difference in Percentage Spliced In (ΔPSI) values are shown. PSI for each gene is calculated as the proportion of properly spliced transcripts to all transcripts containing any of the relevant exons. Bars indicate mean ± S.E.M. (n = 4–6). (E) Box plot shows the expression of the indicated genes in each tumor type, based on published tumor datasets (see methods) P values were calculated by two-sided paired t-test (D) or two-sided Welch’s t test (E). *P < 0.05, **P < 0.01, NS, Not Significant.
Figure 5.
Figure 5.. Upregulation of NOTCH2NL genes contributes to tumorigenicity in H3.3G34R-mutant tumors.
(A) RNA-seq read mapping at the last exons of NOTCH2NL gene shows decreased intron retention in triple-mutant vFNPCs (DKO-G34R). (B) Expression of NOTCH2NL is increased by the mutations in vFNPCs, but not in vHNPCs. Bars indicate mean ± S.E.M. (n = 3–5). (C) ChIP-PCR shows decreased H3K36me3 and BS69/ZMYND11 binding at the intron retention site of NOTCH2NL (primer pair #2), but not at the first intron (primer pair #1). Occupancy by H3.3G34R is confirmed by a specific antibody. A primer for the first intron of LHX8 was used as a control. Bars indicate mean ± S.E.M. (n = 3–4). (D) Overexpression of NOTCH2NL (N2NL) enhances proliferation in p53KO vFNPCs, but not in p53KO vHNPCs. Bars indicate mean ± S.E.M. (n = 3–6). (E) Western blotting confirms specific knockdown of NOTCH2NL by two independent small hairpin RNAs (shRNAs). (F) Knockdown of NOTCH2NL in H3.3G34R-mutant patient-derived cell line (HSJD002) significantly reduces the total cell number. Bars indicate mean ± S.D. (n = 4). (G) Limiting dilution assay shows a decrease in sphere-forming capacity by NOTCH2NL knockdown. (H) Bioluminescence imaging shows suppressed in vivo growth of H3.3G34R-mutant cell line by NOTCH2NL knockdown (n = 4–5). P values were calculated by two-sided Welch’s t test (B, C, D, F, H) or the likelihood-ratio test (G). *P < 0.05, **P < 0.01.
Figure 6.
Figure 6.. NOTCH2NL locus is amplified in H3.3G34R-mutant tumors.
(A) Genomic copy number of the NOTCH2NL locus in different cell lines was quantified by genomic real-time PCR. Bars indicate mean ± S.E.M. (n = 3). (B) FISH assay targeting the NOTCH2NL (green) and the NOTCH2 (red) loci shows an increase in NOTCH2NL copy number in H3.3G34R-mutant patient-derived tumor tissue and in an H3.3G34R-mutant patient-derived cell line. Scale bar, 5 μm.

Comment in

References

    1. Afgan E, Baker D, Batut B, Van Den Beek M, Bouvier D, Ech M, Chilton J, Clements D, Coraor N, Grüning BA, et al. (2018). The Galaxy platform for accessible, reproducible and collaborative biomedical analyses: 2018 update. Nucleic Acids Res. 46, W537–W544. - PMC - PubMed
    1. Bae S, Park J, and Kim JS (2014). Cas-OFFinder: A fast and versatile algorithm that searches for potential off-target sites of Cas9 RNA-guided endonucleases. Bioinformatics 30, 1473–1475. - PMC - PubMed
    1. Baudis M, and Cleary ML (2001). Progenetix.net: an online repository for molecular cytogenetic aberration data. Bioinformatics 17, 1228–1229. - PubMed
    1. Behjati S, Tarpey PS, Presneau N, Scheipl S, Pillay N, Van Loo P, Wedge DC, Cooke SL, Gundem G, Davies H, et al. (2013). Distinct H3F3A and H3F3B driver mutations define chondroblastoma and giant cell tumor of bone. Nat. Genet 45, 1479–1482. - PMC - PubMed
    1. Bjerke L, Mackay A, Nandhabalan M, Burford A, Jury A, Popov S, Bax D. a, Carvalho D, Taylor KR, Vinci M, et al. (2013). Histone H3.3 Mutations Drive Pediatric Glioblastoma through Upregulation of MYCN. Cancer Discov 3, 512–519. - PMC - PubMed

Publication types