. 2021 Mar 9;16(3):437-445.
doi: 10.1016/j.stemcr.2021.02.005. Epub 2021 Feb 12.

Revealing Tissue-Specific SARS-CoV-2 Infection and Host Responses using Human Stem Cell-Derived Lung and Cerebral Organoids

Affiliations

Revealing Tissue-Specific SARS-CoV-2 Infection and Host Responses using Human Stem Cell-Derived Lung and Cerebral Organoids

Shashi Kant Tiwari et al. Stem Cell Reports. .

Abstract

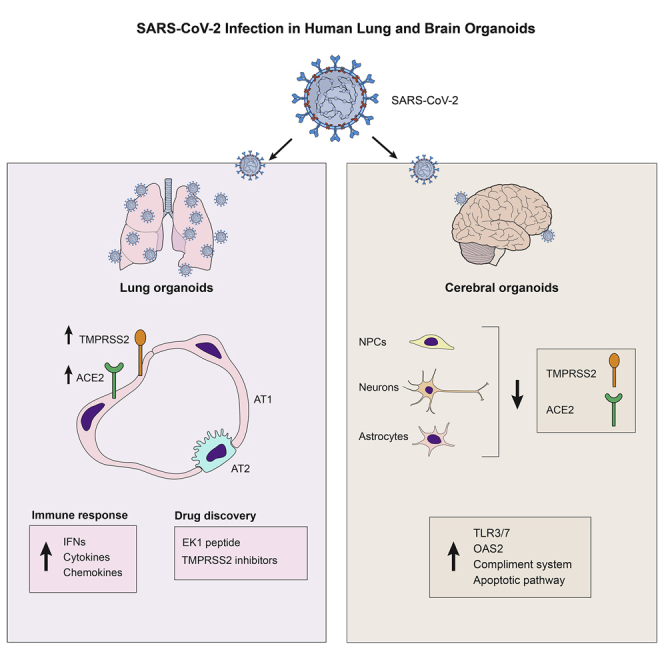
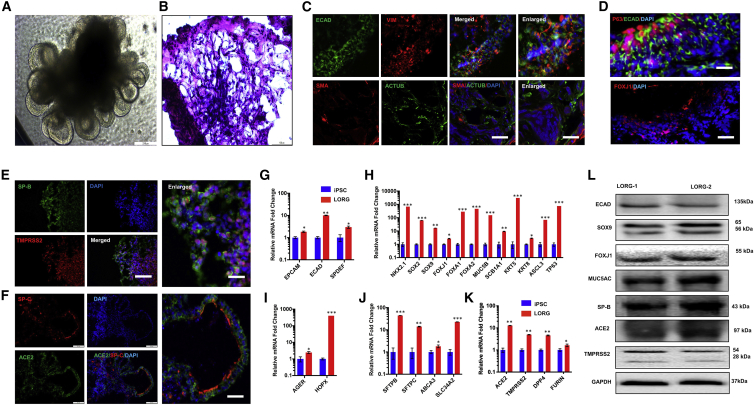
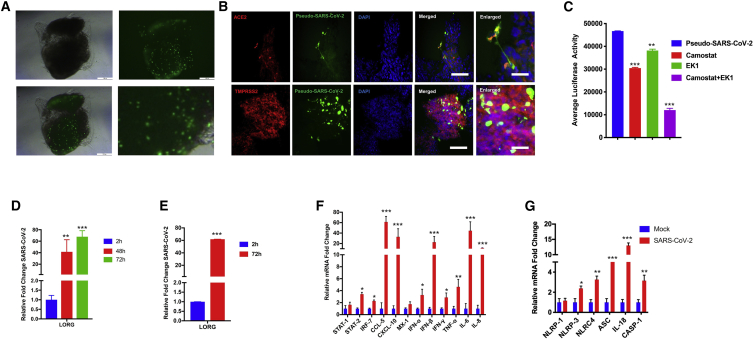
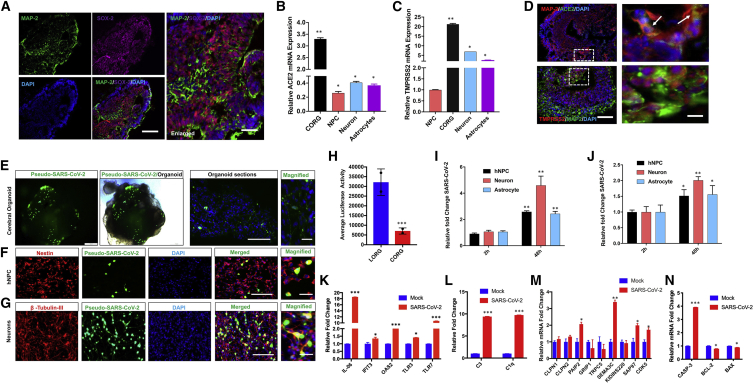
COVID-19 is a transmissible respiratory disease caused by a novel coronavirus, SARS-CoV-2, and has become a global health emergency. There is an urgent need for robust and practical in vitro model systems to investigate viral pathogenesis. Here, we generated human induced pluripotent stem cell (iPSC)-derived lung organoids (LORGs), cerebral organoids (CORGs), neural progenitor cells (NPCs), neurons, and astrocytes. LORGs containing epithelial cells, alveolar types 1 and 2, highly express ACE2 and TMPRSS2 and are permissive to SARS-CoV-2 infection. SARS-CoV-2 infection induces interferons, cytokines, and chemokines and activates critical inflammasome pathway genes. Spike protein inhibitor, EK1 peptide, and TMPRSS2 inhibitors (camostat/nafamostat) block viral entry in LORGs. Conversely, CORGs, NPCs, astrocytes, and neurons express low levels of ACE2 and TMPRSS2 and correspondingly are not highly permissive to SARS-CoV-2 infection. Infection in neuronal cells activates TLR3/7, OAS2, complement system, and apoptotic genes. These findings will aid in understanding COVID-19 pathogenesis and facilitate drug discovery.

Keywords: ACE2; SARS-CoV-2; TMPRSS2; cerebral organoids; host-pathogen interactions; iPSCs; lungs organoids.


Conflict of interest statement

T.M.R. is a founder of ViRx Pharmaceuticals and has an equity interest in the company. The terms of this arrangement have been reviewed and approved by the University of California, San Diego in accordance with its conflict of interest policies.

Figures

None
Graphical abstract
Figure 1
Figure 1
Human iPSC differentiation into 3D lung organoids for modeling SARS-CoV-2 infection (A) Representative phase-contrast image of lung organoids (LORGs) at 60 days (60D). Scale bar, 200 μm. (B) H&E staining of 60D LORG showing alveolar-like morphology. Scale bars, 100 μm. (C) Confocal images showing labeling for cells surrounding epithelial structures (ECAD, green) co-labeled with mesenchymal-cell-type marker vimentin (VIM, red). LORGs also show mesenchymal cells by immunolabeling with smooth muscle marker, smooth muscle actin (SMA, red), and acetylated tubulin (ACTUB, green). Scale bars, 100 μm; for enlarged images, 50 μm. (D) Epithelial structures (ECAD, green) showing basal-like cells (P63, red) on basolateral surface and ciliated cells (FOXJ1, red) on the luminal side of the epithelium. Scale bars, 100 μm. (E and F) Representative confocal images showing labeling for alveolar type 2 cells (SP-B, green and SP-C, red) co-labeled with TMPRSS2 (E, red) or SARS-CoV-2 receptor ACE2 (F, green). Scale bars, 100 μm; for enlarged images, 50 μm. (G) LORGs express lung epithelial cell markers EPCAM, ECAD, and SPDEF. Mean ± SEM of n = 3 organoids cultured in different wells. p < 0.05, ∗∗p < 0.01 by Student's t test. (H) Expression analysis of proximal lung epithelial cell markers (SOX9, FOXJ1, FOXA1, FOXA2, SCB1A1, MUC5B, KRT5, KRT8, ASCL3, and TP63) and progenitor cell genes (NKX2.1 and SOX2) expressed in developing lungs. Mean ± SEM of n = 3 organoids cultured in different wells. p < 0.05, ∗∗p < 0.01, ∗∗∗p < 0.001 by Student's t test. (I) Analysis of lung alveolar type 1 cell genes AGER and HOPX. Mean ± SEM of n = 3 organoids cultured in different wells. p < 0.05, ∗∗∗p < 0.001. (J) Expression analysis of expression of lung alveolar type 2 cell genes SFTPB, SFTPC, ABCA3, and SLC34A2. Mean ± SEM of n = 3 organoids cultured in different wells. p < 0.05, ∗∗p < 0.01, ∗∗∗p < 0.001. (K) qRT-PCR analysis of 60D LORG shows expression of ACE2, TMPRSS2, DPP4, and Furin. Data presented as mean ± SEM of n = 3 organoids cultured in different wells. p < 0.05, ∗∗p < 0.01. (L) Western blot analysis of 60D organoid showing protein levels for ECAD, SOX9, FOXJ1, MUC5AC, and alveolar type 2 cells (surfactant protein B [SP-B]), SARS-CoV-2 receptor (ACE2), and protease (TMPRSS2). n = 2 organoids. See also Figure S1 and Table S1.
Figure 2
Figure 2
SARS-CoV-2 robustly replicates in human LORGs and induces expression of genes involved in innate immunity and inflammation (A) Phase-contrast and fluorescence imaging shows infection of SARS-CoV-2-GFP pseudovirus at 24 h post infection and MOI = 2. Scale bars, 200 μm. (B) Fluorescence image showing that SARS-CoV-2 GFP pseudovirus infects ACE2 and TMPRSS2+ cells of the LORG. Scale bars, 100 μm; for enlarged images, 50 μm. (C) Pseudo-SARS-CoV-2-luciferase pseudovirus infection is blocked by viral entry inhibitors. Bar graph shows the luciferase activity in the presence and absence of TMPRSS2 inhibitor (camostat mesylate) and a fusion inhibitor EK1 peptide to LORG infected with SARS-CoV-2 pseudovirus. Mean ± SEM of n = 3 organoids cultured in different wells. ∗∗∗p < 0.001 by Student’s t test. (D and E) Lung organoids were infected with SARS-CoV-2 USA-WA1/2020 virus at MOI = 2, and viral RNAs from supernatant (D) and cellular (E) fractions were quantified at indicated times of infection. Mean ± SEM of n = 2 organoids cultured and infected in different wells. ∗∗p < 0.01, ∗∗∗p < 0.001 by Student's t test. (F and G) LORGs were infected as above in (E), and gene expression of indicated genes was quantified by qRT-PCR at 72 h post infection. Bar graph shows expression of immune response genes and cytokines (F) and inflammasome markers (G). Mean ± SEM of n = 2 organoids cultured and infected in different wells. p < 0.05, ∗∗p < 0.01, ∗∗∗p < 0.001 by Student's t test. See also Figure S1 and Table S1.
Figure 3
Figure 3
SARS-CoV-2 infects human cerebral organoids and activates expression of innate immunity and neurodegeneration genes in neurons (A) Representative immunofluorescence image of an 80-day-old organoid shows various cell types including neurons (MAP-2, green), neuronal progenitor (SOX-2, magenta), and nuclear stain (DAPI, blue); merged images are also shown. Scale bars, 100 μm. (B and C) qRT-PCR analysis shows expression of ACE2 (B) and TMPRSS2 (C) in CORGs, NPCs, neurons, and astrocytes. Mean ± SEM of n = 3 independent organoids and n = 3 independent experiments from NPCs, neurons, and astrocytes. p < 0.05, ∗∗p < 0.01 by Student's t test. (D) Confocal imaging of CORGs showing immunostaining of neuronal marker (MAP-2, red) co-labeled with SARS-CoV-2 receptor (ACE2, green) or TMPRSS2 (red) co-labeled with MAP-2 (green). White boxes were enlarged (right), and arrows show co-labeling of MAP-2/ACE2 and MAP-2/TMPRSS2 in magnified images. Scale bars, 100 μm; for enlarged images, 25 μm. (E–G) Organoids, NPCs, and neurons were infected with pseudo-SARS-CoV-2-GFP virus at MOI = 2 and analyzed after 24 h of infection. (E) Immunofluorescence and phase-contrast images of an organoid showing SARS-CoV-2 (green). Scale bars, 200 μm. (F) Immunofluorescence confocal images of NPCs stained with antibody against Nestin (red), SARS-CoV-2 (green), and nuclear stain DAPI (blue). Scale bars, 100 μm (merged) and 25 μm (magnified). (G) Immunofluorescence confocal images of NPC differentiated neurons stained with antibody against β-tubulin-III (red), SARS-CoV-2 (green), and nuclear stain DAPI (blue). Scale bars, 100 μm (merged) and 25 μm (magnified). (H) Organoids were infected with pseudo-SARS-CoV-2-luciferase virus at MOI = 2, and luciferase activities were measured after 24 h of infection. Mean ± SEM of n = 3 independent organoids. ∗∗∗p < 0.001 by Student's t test. (I and J) NPCs, neurons, and astrocytes were infected with SARS-CoV-2 USA-WA1/2020 virus at MOI = 2, and viral RNAs from supernatant (I) and cellular (J) fractions were quantified at indicated times of infection. Mean ± SEM of n = 3 independent organoids. ∗∗∗p < 0.001, ∗∗p < 0.001, p < 0.05 by Student's t test. (K–N) Neurons were infected as above in (I) and (J), and gene expression of indicated genes was quantified by qRT-PCR at 48 h post infection. Bar graph shows expression of innate immune response genes (K), C3 and C1q complement genes (L), synaptic function of neurons (M), and apoptotic pathway genes (N). Mean ± SEM of n = 3 independent organoids. p < 0.05, ∗∗p < 0.01, ∗∗∗p < 0.001 by Student's t test. See also Figure S2.

References

    1. Barkauskas C.E., Chung M.I., Fioret B., Gao X., Katsura H., Hogan B.L. Lung organoids: current uses and future promise. Development. 2017;144:986–997. - PMC - PubMed
    1. Benito-Kwiecinski S., Lancaster M.A. Brain organoids: human neurodevelopment in a dish. Cold Spring Harb. Perspect. Biol. 2019;12:a035709. - PMC - PubMed
    1. Blanco-Melo D., Nilsson-Payant B.E., Liu W.C., Uhl S., Hoagland D., Moller R., Jordan T.X., Oishi K., Panis M., Sachs D. Imbalanced host response to SARS-CoV-2 drives development of COVID-19. Cell. 2020;181:1036–1045 e1039. - PMC - PubMed
    1. Daamen A.R., Bachali P., Owen K.A., Kingsmore K.M., Hubbard E.L., Labonte A.C., Robl R., Shrotri S., Grammer A.C., Lipsky P.E. Comprehensive transcriptomic analysis of COVID-19 blood, lung, and airway. bioRxiv. 2020 doi: 10.1101/2020.05.28.121889. - DOI - PMC - PubMed
    1. Dang J., Tiwari S.K., Agrawal K., Hui H., Qin Y., Rana T.M. Glial cell diversity and methamphetamine-induced neuroinflammation in human cerebral organoids. Mol. Psychiatry. 2020 doi: 10.1038/s41380-020-0676-x. - DOI - PMC - PubMed

Publication types

MeSH terms

Substances