. 2021 Feb 25;185(1):240-255.
doi: 10.1093/plphys/kiaa022.

Arabidopsis natural variation in insect egg-induced cell death reveals a role for LECTIN RECEPTOR KINASE-I.1

Affiliations

Arabidopsis natural variation in insect egg-induced cell death reveals a role for LECTIN RECEPTOR KINASE-I.1

Raphaël Groux et al. Plant Physiol. .

Abstract

In Arabidopsis (Arabidopsis thaliana), a hypersensitive-like response (HR-like response) is triggered underneath the eggs of the large white butterfly Pieris brassicae (P. brassicae), and this response is dependent on salicylic acid (SA) accumulation and signaling. Previous reports indicate that the clade I L-type LECTIN RECEPTOR KINASE-I.8 (LecRK-I.8) is involved in early steps of egg recognition. A genome-wide association study was used to better characterize the genetic structure of the HR-like response and discover loci that contribute to this response. We report here the identification of LecRK-I.1, a close homolog of LecRK-I.8, and show that two main haplotypes that explain part of the variation in HR-like response segregate among natural Arabidopsis accessions. Besides, signatures of balancing selection at this locus suggest that it may be ecologically important. Disruption of LecRK-I.1 results in decreased HR-like response and SA signaling, indicating that this protein is important for the observed responses. Furthermore, we provide evidence that LecRK-I.1 functions in the same signaling pathway as LecRK-I.8. Altogether, our results show that the response to eggs of P. brassicae is controlled by multiple LecRKs.


Figures

Figure 1
Figure 1
Insect egg-induced HR-like response varies among natural Arabidopsis accessions. (A) Representative picture of accessions (two leaves per accession) displaying varying phenotypes after treatment with P. brassicae EE. (B) Representative pictures of symptoms used for scoring in experiments. (C) Proportion of each symptom class developed by some accessions shown in panel A as visualized from the adaxial side. An amount of 5–20 treated leaves of each ecotype were used for scoring. (D) Variation in HR-like response triggered after natural OVI by P. brassicae butterflies. In all experiments shown here, duration of treatment was 5 d as this corresponds to the hatching time of naturally oviposited P. brassicae eggs. The dashed circles indicate the site of treatment on the abaxial side of the leaf. Leaves were digitally extracted for comparison.
Figure 2
Figure 2
Genome-wide mapping of insect egg-induced HR-like symptoms. (A) Manhattan plot of the GWAS for symptom score after 5 d of P. brassicae EE treatment using a linear mixed model. Full imputed genotypes (1′769′548 SNPs) for all 295 accessions were used for mapping. Chromosomes are displayed in different colors and the dashed line indicates a significance level of 0.05 after Bonferroni correction for multiple testing. (B) Local association plot of a 50-kb region surrounding the most significant marker. The x-axis represents the genomic position on chromosome 3 and color boxes indicate genes. LD to the most significant SNP (SNP3) is indicated by a color scale.
Figure 3
Figure 3
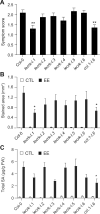
LecRK-I.1 plays a role in the induction of HR-like symptoms following EE treatment. (A) Average symptom scores as visualized from the adaxial side after 5 d of treatment with EE. Means ± se from three independent experiments are shown (n = 12–23 for each experiment). Stars indicate significant differences with Col-0 (Kruskal–Wallis followed by Dunn’s test). (B) Cell death as quantified by TB staining after 3 d of EE treatment. Untreated leaves were used as controls (CTL). Means ± se from 8 to 20 leaves are shown. This experiment was repeated once with similar results. Stars indicate significant differences with Col-0 (ANOVA followed by Dunnett’s test). (C) Total SA + SA glucoside) after 3 d of EE treatment. Measurements were done using a bacterial biosensor, and untreated plants were used as controls. Means ± se of two independent experiments are shown (n = 4 for each experiment). Stars indicate significant differences with Col-0 [linear mixed model {LMM} followed by Dunnet’s test]. *P <0.05; **P <0.01.
Figure 4
Figure 4
LecRK-I.1 plays a role in the induction of HR-like symptoms following P. brassicae OVI. (A) Average symptom scores as visualized from the adaxial side. Means ± se from three independent experiments are shown (n = 7–20 for each experiment). (B) Cell death as quantified by TB staining. Means ± se from three independent experiments are shown (n = 5 for each experiment). (C) Total SA + SAG measurement using a bacterial biosensor. Means ± se of three independent experiments are shown (n = 4 for each experiment). Analyses were done 4.5 d after OVI. Untreated plants were used as controls (CTL). Letters indicate significant differences at P <0.05 (LMM followed by Tukey’s honestly significant difference test).
Figure 5
Figure 5
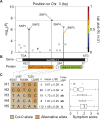
Local association and haplotype analysis of the LecRK-I.1 locus. (A) Local association plot of the LecRK-I.1 locus. The x-axis represents the genomic position on chromosome 3. LD of markers (−log10P >4) to the most significant SNP (SNP3) is indicated by a color scale. The dashed line indicates the Bonferroni corrected significance threshold at α = 0.05. (B) Gene and protein domain organization according to UNIPROT. (C) Haplotype analysis using the five most significant SNPs in the LecRK-I.1 gene. Mean symptom score ± se is shown and n indicates the number of accessions carrying each haplotype. Different letters indicate significant difference at P <0.05 (ANOVA, followed by Tukey’s HSD for multiple comparison). The coordinates on chromosome 3 of SNP1–5 displayed in panel A are the following: SNP1: 16632685; SNP2: 16632698; SNP3: 16633422; SNP4: 16633802; SNP5: 16633802.
Figure 6
Figure 6
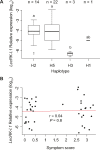
Natural LecRK-I.1 haplotypes are expressed similarly upon EE treatment and expression does not correlate with symptom score. (A) LecRK-I.1 expression in 40 different accessions with low and high symptoms after 72 h of EE treatment. Transcript levels were plotted according to haplotypes defined in Figure 4. Different letters indicate significant difference at P <0.05 (ANOVA, followed by Tukey’s HSD for multiple comparison). Thick line indicates the median, box edges represent first and third quartile respectively, whiskers cover 1.5 times the interquartile space, and dots represent extreme values. (B) LecRK-I.1 expression in accessions with low or high symptoms does not correlate with symptom scores of the respective accessions. Gene expression was monitored by RT-qPCR and target gene transcript level was normalized to the reference gene SAND. Means of three technical replicates are shown. Expression data were corrected by adding half the smallest nonzero value in order to avoid zero values, and log10-transformed prior to analysis. NS, not significant (ANOVA, P >0.05). Pearson correlation coefficient (r) and corresponding P-value (P) between LecRK-I.1 transcript level and symptom score are shown.
Figure 7
Figure 7
Signatures of selection at the LecRK-I.1 locus. (A) Frequency of the different haplotypes in the accession panel used for GWAS mapping. (B) Cladogram constructed from a genome-wide kinship matrix of the 295 accessions used for GWAS. The outermost circle indicates the haplotype carried by a given accession. (C) Sliding window analysis of Tajima’s D, and Fu and Li’s D and F-statistics along the LecRK-I.1 coding region using a window size of 200 variant sites and a step size of 25 sites. A subset of 125 accessions with available full genome sequences was used for this analysis. The red dashed line indicates significance threshold at P < 0.05. The gene structure of LecRK-I.1 is shown below.
Figure 8
Figure 8
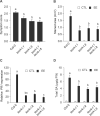
LecRK-I.1 genetically interacts with LecRK-I.8. (A) Col-0, single and double lecrk mutants were treated with EE. Average symptom score was visualized from the adaxial side after 5 d of EE treatment. Mean ± se from three independent experiment is shown (n = 12–23 for each experiment). Different letters indicate significant difference at P < 0.05 (Kruskal–Wallis followed by Dunn’s test). (B) Cell death as quantified by TB staining after 3 d of EE treatment. Untreated leaves were used as controls. Means ± se from 8 to 20 leaves are shown. This experiment was repeated once with similar results. Different letters indicate significant difference at P < 0.05 (ANOVA followed by Tukey’s HSD test). (C) Expression of the marker gene PR1 after 3 d of EE treatment. Transcript levels were monitored by RT-qPCR and normalized to the reference gene SAND. Means ± se of three technical replicates are shown. This experiment was repeated twice with similar results. Different letters indicate significant difference at P < 0.05 (ANOVA followed by Tukey’s HSD test). (D) Total SA + SAG after 3 d of EE treatment. Measurements were done using a bacterial biosensor; untreated plants were used as control. Means ± se of three independent experiments are shown (n = 4 for each experiment). Different letters indicate significant difference at P < 0.05 (LMM followed by Tukey’s HSD test).

Similar articles

Cited by

References

    1. Ariga H, Katori T, Tsuchimatsu T, Hirase T, Tajima Y, Parker JE, Alcázar R, Koornneef M, Hoekenga O, Lipka AE, et al. (2017) NLR locus-mediated trade-off between abiotic and biotic stress adaptation in Arabidopsis. Nat Plants 3: 17072. - PubMed
    1. Bakker EG, Toomajian C, Kreitman M, Bergelson J (2006) A genome-wide survey of R gene polymorphisms in Arabidopsis. Plant Cell 18: 1803–1818 - PMC - PubMed
    1. Bellande K, Bono JJ, Savelli B, Jame E, Canut H (2017) Plant lectins and lectin receptor-like kinases: How do they sense the outside? Int J Mol Sci 18: 1164 - PMC - PubMed
    1. Bittner N, Trauer-Kizilelma U, Hilker M (2017) Early plant defence against insect attack: involvement of reactive oxygen species in plant responses to insect egg deposition. Planta 245: 993–1007 - PubMed
    1. Blenn B, Bandoly M, Küffner A, Otte T, Geiselhardt S, Fatouros NE, Hilker M (2012) Insect egg deposition induces indirect defense and epicuticular wax changes in Arabidopsis thaliana. J Chem Ecol 38: 882–892 - PubMed

Publication types

Substances

LinkOut - more resources