. 2021 Feb 25;185(1):108-119.
doi: 10.1093/plphys/kiaa026.

Co-overproducing Rubisco and Rubisco activase enhances photosynthesis in the optimal temperature range in rice

Affiliations

Co-overproducing Rubisco and Rubisco activase enhances photosynthesis in the optimal temperature range in rice

Mao Suganami et al. Plant Physiol. .

Abstract

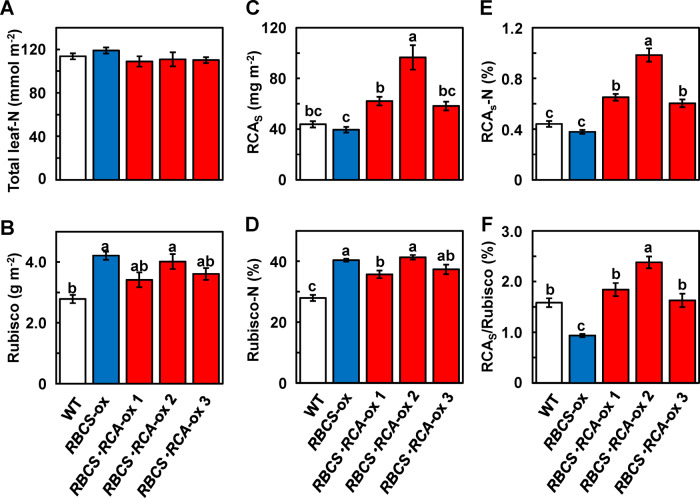
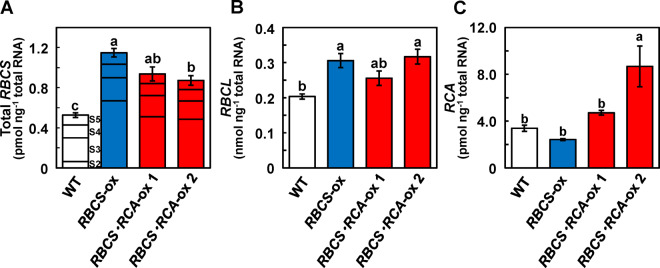
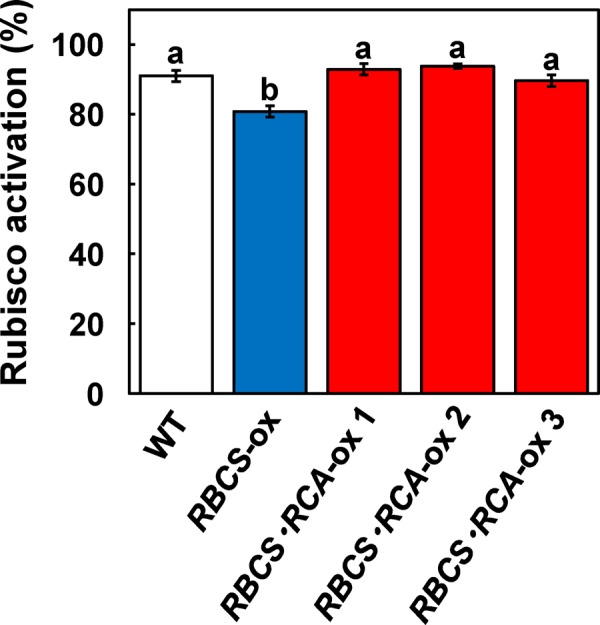
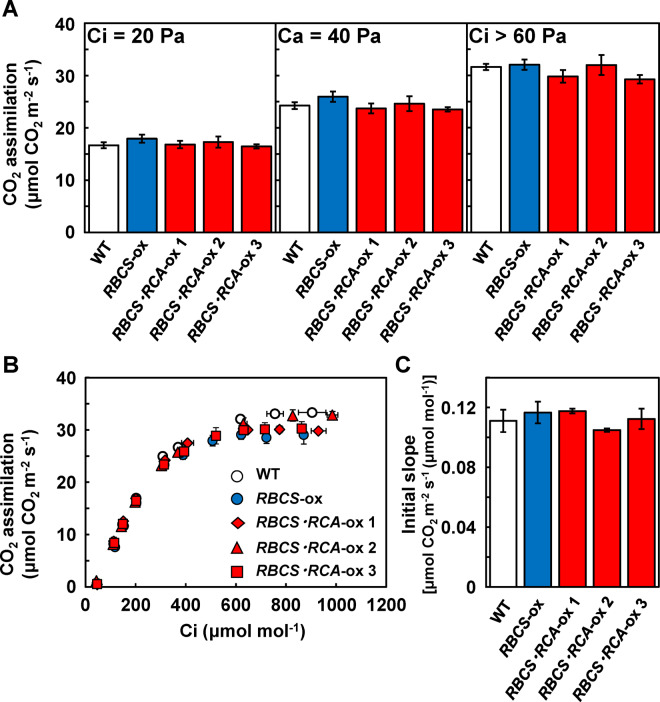
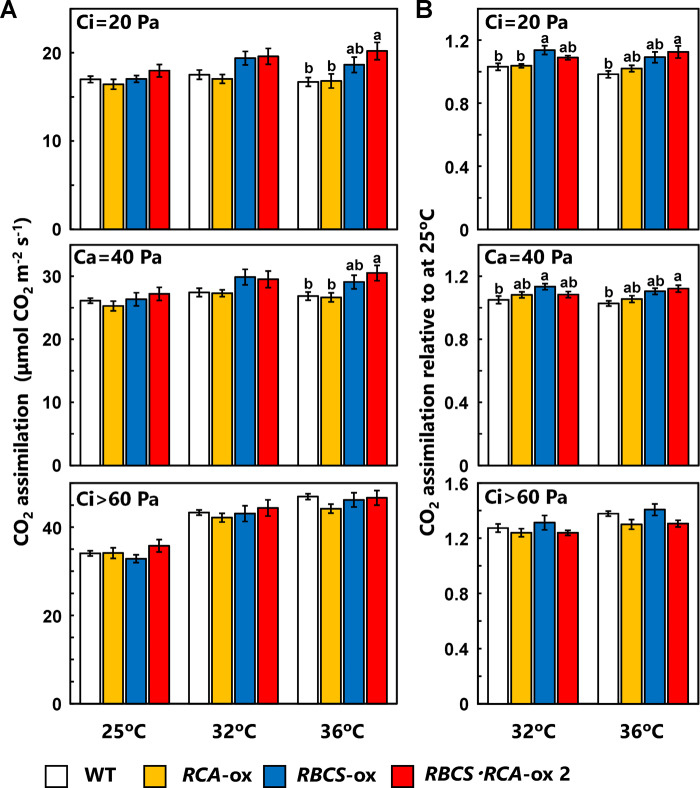
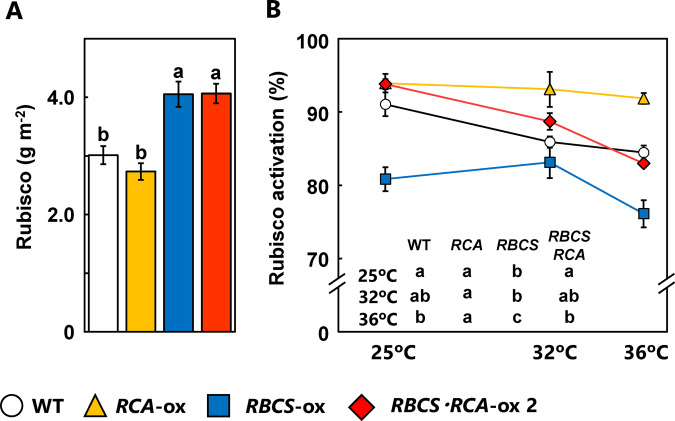
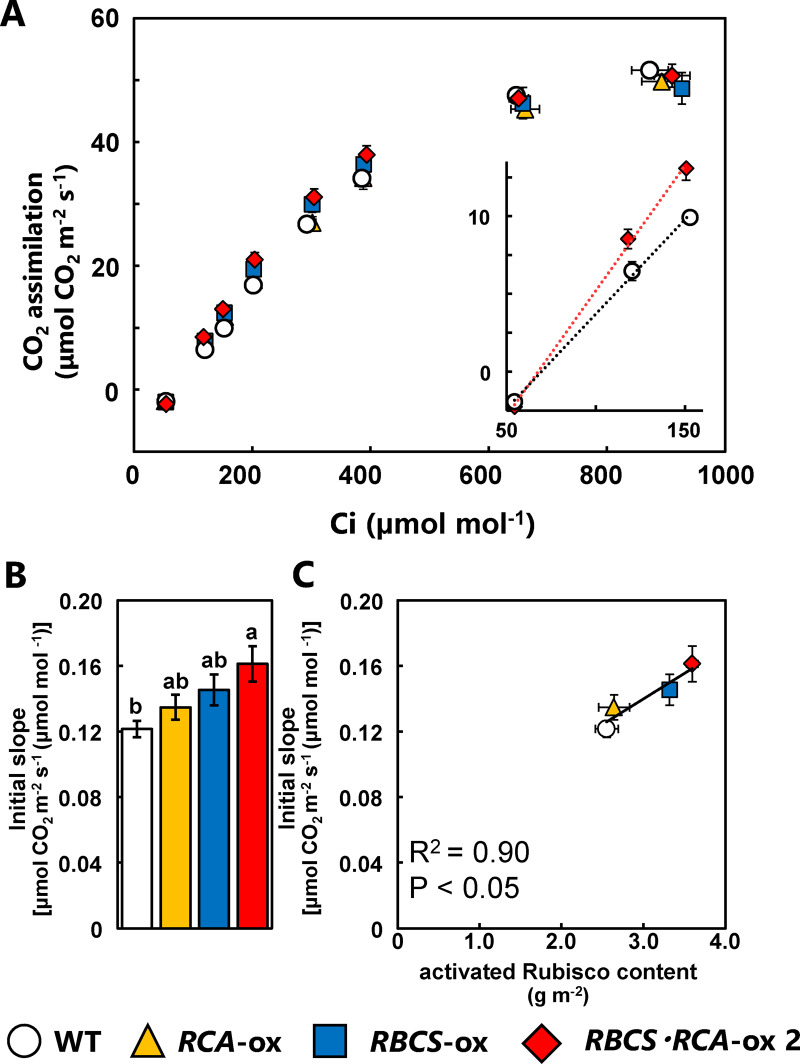
Rubisco limits C3 photosynthesis under some conditions and is therefore a potential target for improving photosynthetic efficiency. The overproduction of Rubisco is often accompanied by a decline in Rubisco activation, and the protein ratio of Rubisco activase (RCA) to Rubisco (RCA/Rubisco) greatly decreases in Rubisco-overproducing plants (RBCS-ox). Here, we produced transgenic rice (Oryza sativa) plants co-overproducing both Rubisco and RCA (RBCS-RCA-ox). Rubisco content in RBCS-RCA-ox plants increased by 23%-44%, and RCA/Rubisco levels were similar or higher than those of wild-type plants. However, although the activation state of Rubisco in RBCS-RCA-ox plants was enhanced, the rates of CO2 assimilation at 25°C in RBCS-RCA-ox plants did not differ from that of wild-type plants. Alternatively, at a moderately high temperature (optimal range of 32°C-36°C), the rates of CO2 assimilation in RBCS-ox and RBCS-RCA-ox plants were higher than in wild-type plants under conditions equal to or lower than current atmospheric CO2 levels. The activation state of Rubisco in RBCS-RCA-ox remained higher than that of RBCS-ox plants, and activated Rubisco content in RCA overproducing, RBCS-ox, RBCS-RCA-ox, and wild-type plants was highly correlated with the initial slope of CO2 assimilation against intercellular CO2 pressures (A:Ci) at 36°C. Thus, a simultaneous increase in Rubisco and RCA contents leads to enhanced photosynthesis within the optimal temperature range.


Figures

Figure 1
Figure 1
Rubisco, RCA and leaf-N contents in transgenic plants. (A) Total leaf-N; (B) Rubisco; (C) RCA small form (RCAS) contents per unit of leaf area; (D) N allocation to Rubisco (Rubisco-N); (E) N allocation to RCAS (RCAS-N) and (F) the protein ratio of RCAS to Rubisco (RCAS/Rubisco) in the uppermost, fully expanded leaves. The white, blue, and red bars indicate WT, RBCS-ox, and RBCS-RCA-ox plants, respectively. Data are presented as means ± se (n = 4–6). Statistical analysis was conducted using ANOVA with a post hoc Tukey–Kramer HSD test. Different letters indicate statistical differences among the genotypes (P <0.05).
Figure 2
Figure 2
The mRNA levels of total RBCS, RBCL, and RCA in transgenic plants. The mRNA levels of: (A) total RBCS; (B) RBCL in expanding leaves; and (C) RCA in fully expanded leaves on a total RNA basis. In total RBCS, each bar was divided into four parts, which indicate the mRNA levels of four genes of the RBCS multigene family, RBCS2, 3, 4, and 5, respectively, from the bottom to the top. The mRNA level of RBCS1 was negligible (Suzuki et al., 2007). The white, blue, and red bars indicate WT, RBCS-ox, and RBCS-RCA-ox plants, respectively. Data are presented as means ± se (n = 3–4). Statistical analysis was conducted using ANOVA with a post hoc Tukey–Kramer HSD test. Different letters indicate statistical differences among the genotypes (P <0.05).
Figure 3
Figure 3
Rubisco activation at 25°C in transgenic plants. The activation state of Rubisco was measured in the uppermost, fully expanded leaves at a leaf temperature of 25°C, an irradiance of 1,500-μmol quanta m−2 s−1, and an atmospheric CO2 partial pressure (Ca) of 40 Pa. The white, blue, and red bars indicate WT, RBCS-ox, and RBCS-RCA-ox plants, respectively. Data are presented as means ± se (n = 3–6). Statistical analysis was conducted using ANOVA with a post hoc Tukey–Kramer HSD test. Different letters indicate statistical differences among the genotypes (P <0.05).
Figure 4
Figure 4
Rates of CO2 assimilation at 25°C in transgenic plants. (A) The rate of CO2 assimilation per unit of leaf area in the uppermost, fully expanded leaves measured with an LI-6400XT at a leaf temperature of 25°C, an irradiance of 1,500-μmol quanta m−2 s−1, and different CO2 partial pressures (intercellular CO2 partial pressure, Ci, of 20 Pa (Ci = 20 Pa), Ca = 40 Pa, and Ci > 60 Pa). The white, blue, and red bars indicate WT, RBCS-ox, and RBCS-RCA-ox plants, respectively. Data are presented as means ± se (n = 4–6). (B) The rates of CO2 assimilation as a function of Ci (A:Ci curve). The white circles, blue circles, red diamonds, red triangles, and red squares indicate WT, RBCS-ox, RBCS-RCA-ox 1, 2, and 3 plants, respectively. Data are presented as means ± se (n = 3–4). C, Initial slope of CO2 assimilation against Ci. The slope was calculated from the data of (B). In (A) and (C), statistical analysis was conducted using ANOVA with a post hoc Tukey–Kramer HSD test. Different letters indicate statistical differences among the genotypes (P <0.05).
Figure 5
Figure 5
Rates of CO2 assimilation at 25°C, 32°C, and 36°C in transgenic plants. (A) The rate of CO2 assimilation per unit of leaf area in the uppermost, fully expanded leaves measured with an LI-6800 at an irradiance of 1,500-μmol quanta m−2 s−1, different CO2 partial pressures (Ci = 20 Pa, Ca = 40 Pa, and Ci >60 Pa) and different leaf temperatures (25, 32, and 36°C). (B) The rate of CO2 assimilation at 32°C and 36°C relative to that at 25°C. The white, orange, blue, and red bars indicate WT, RCA-ox, RBCS-ox, and RBCS-RCA-ox 2 plants, respectively. Data are presented as means ± se (n = 6–7). Statistical analysis was conducted using ANOVA with a post hoc Tukey–Kramer HSD test. Different letters indicate statistical differences among the genotypes (P <0.05).
Figure 6
Figure 6
Rubisco content and Rubisco activation at 25, 32, and 36°C in transgenic plants. (A) Rubisco content per unit of leaf area in the uppermost, fully expanded leaves. Data are presented as means ± se (n = 6–7). (B) The activation state of Rubisco was measured in the uppermost, fully expanded leaves at an irradiance of 1,500-μmol quanta m−2 s−1, an ambient CO2 partial pressure (Ca = 40 Pa) and different leaf temperatures (25, 32, and 36°C). Data are presented as means ± se (n = 3–6). The white circles, orange triangles, blue squares, and red diamonds indicate WT, RCA-ox, RBCS-ox, and RBCS-RCA-ox 2 plants, respectively. Statistical analysis was conducted using ANOVA with a post hoc Tukey–Kramer HSD test. Different letters indicate statistical differences among the genotypes (P <0.05).
Figure 7
Figure 7
Rates of CO2 assimilation at 36°C as a function of Ci in transgenic plants. (A) A:Ci curve in the uppermost, fully expanded leaves measured with an LI-6800 at a leaf temperature of 36°C and an irradiance of 1,500-μmol quanta m−2 s−1. The white circles, orange triangles, blue squares, and red diamonds indicate WT, RCA-ox, RBCS-ox, and RBCS-RCA-ox 2 plants, respectively. Insert panel (A) shows the initial slope of A:Ci curve in WT and RBCS-RCA-ox 2 plants. (B) Initial slope of A:Ci curves. The slope was calculated from the data of (A). (C) Relationship between the initial slope of A:Ci curve and activated Rubisco content. The activated Rubisco content was calculated by multiplying the Rubisco content by the activation state of Rubisco (Figure 6). The linear regression line was calculated using the Pearson’s coefficient of correlation. Data are presented as means ± se (n = 4). Statistical analysis was conducted using ANOVA with a post hoc Tukey–Kramer HSD test. Different letters indicate statistical differences among the genotypes (P <0.05).

Similar articles

Cited by

References

    1. Bracher A, Whitney SM, Hartl FU, Hayer-Hartl M (2017) Biogenesis and metabolic maintenance of Rubisco. Annu Rev of Plant Biol 68: 29–60 - PubMed
    1. Busch FA, Sage RF (2017) The sensitivity of photosynthesis to O2 and CO2 concentration identifies strong Rubisco control above the thermal optimum. New Phytol 213: 1036–1051 - PubMed
    1. Carmo-Silva AE, Salvucci ME (2013) The regulatory properties of Rubisco activase differ among species and affect photosynthetic induction during light transitions. Plant Physiol 161: 1645–1655 - PMC - PubMed
    1. Carmo-Silva AE, Scales JC, Madgwick PJ, Parry MA (2015) Optimizing Rubisco and its regulation for greater resource use efficiency. Plant Cell Environ 38: 1817–1832 - PubMed
    1. Crafts-Brandner SJ, Salvucci ME (2000) Rubisco activase constrains the photosynthetic potential of leaves at high temperature and CO2. Proc Natl Acad Sci USA 97: 13430–13435 - PMC - PubMed

Publication types

MeSH terms

LinkOut - more resources