. 2021 Apr 7;32(4):977-988.
doi: 10.1021/jasms.0c00473. Epub 2021 Feb 25.

Highly Multiplexed Immunohistochemical MALDI-MS Imaging of Biomarkers in Tissues

Affiliations

Highly Multiplexed Immunohistochemical MALDI-MS Imaging of Biomarkers in Tissues

Gargey Yagnik et al. J Am Soc Mass Spectrom. .

Abstract

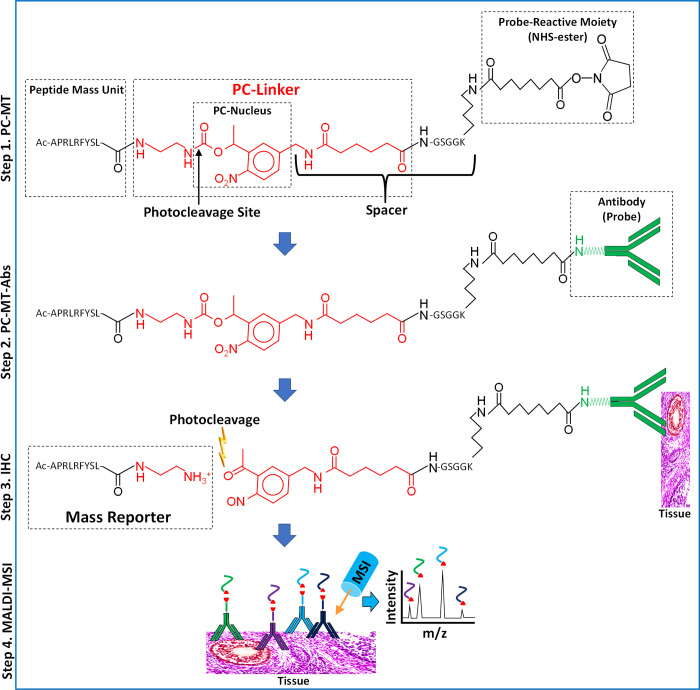
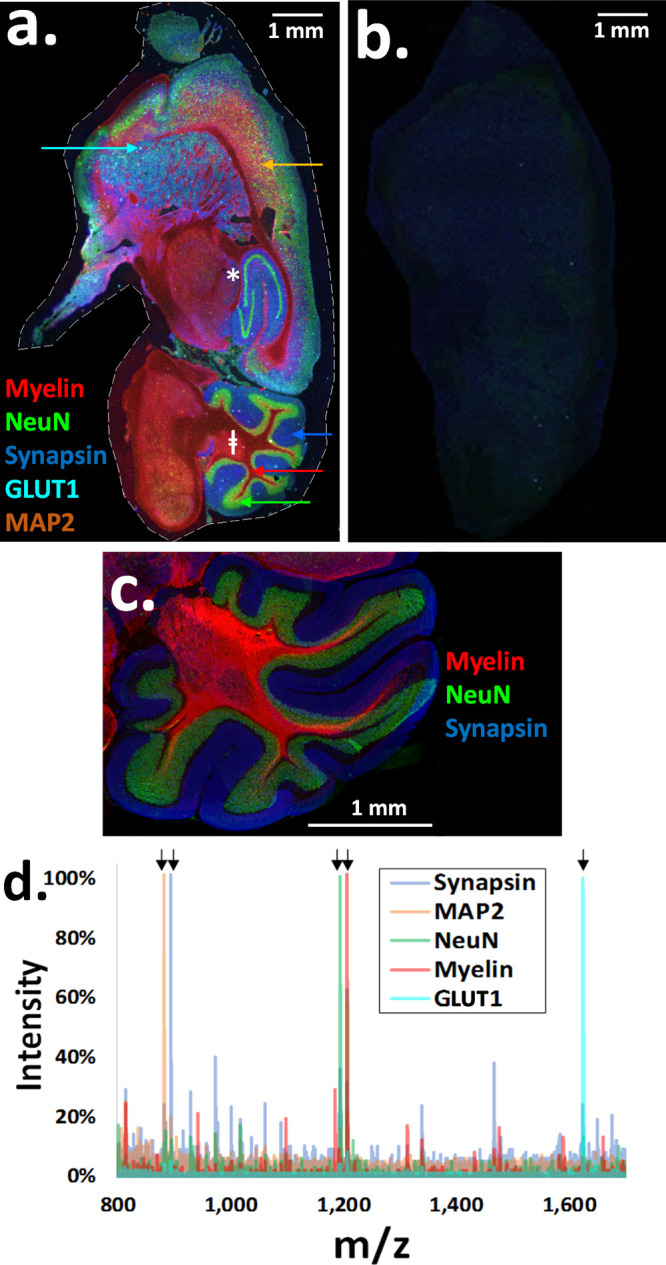
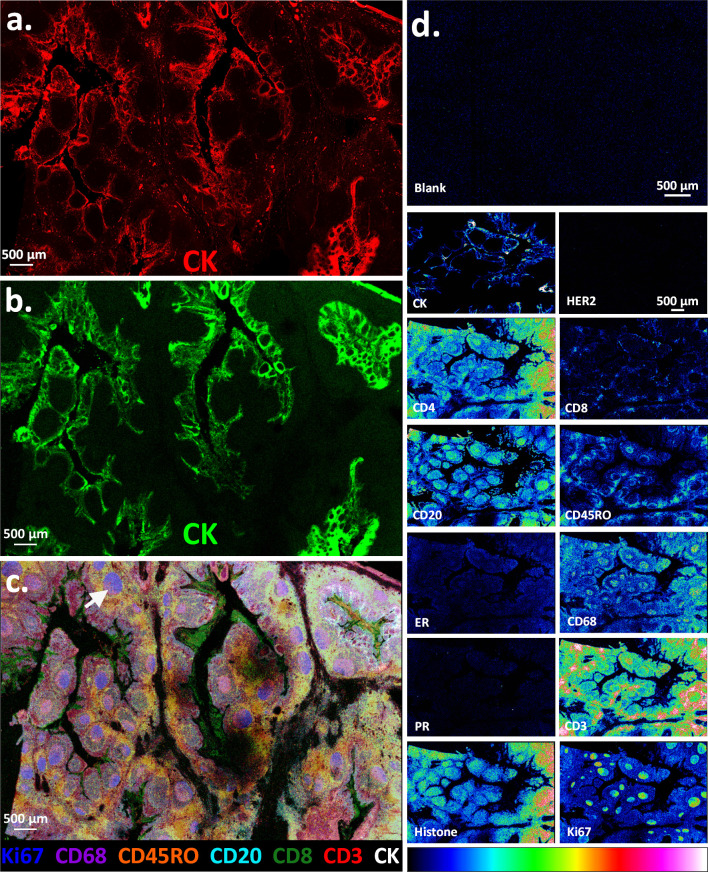
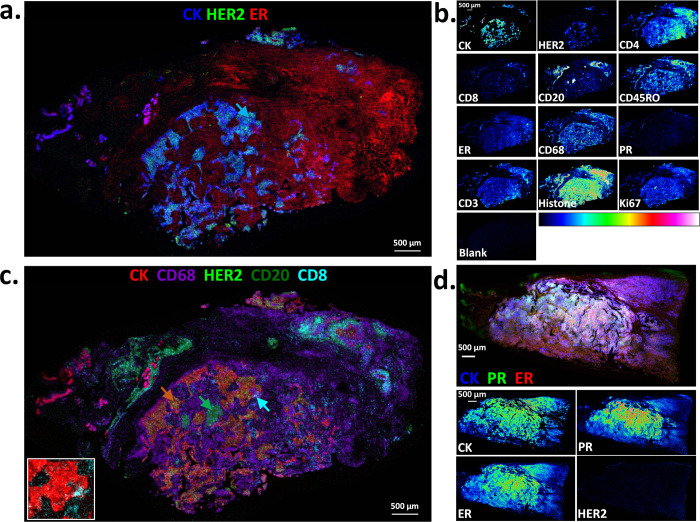
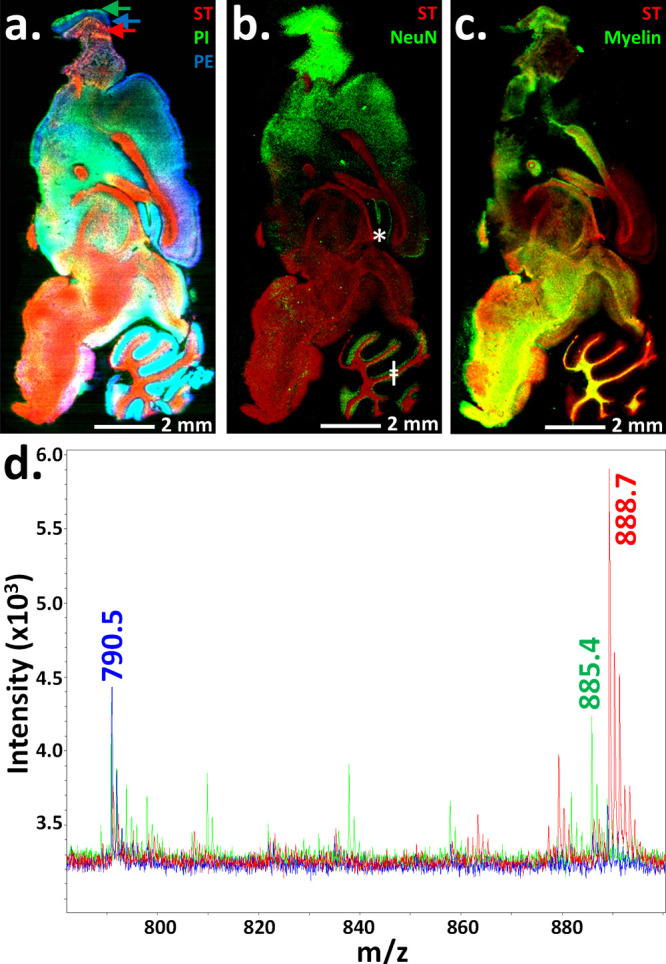
Immunohistochemistry (IHC) combined with fluorescence microscopy provides an important and widely used tool for researchers and pathologists to image multiple biomarkers in tissue specimens. However, multiplex IHC using standard fluorescence microscopy is generally limited to 3-5 different biomarkers, with hyperspectral or multispectral methods limited to 8. We report the development of a new technology based on novel photocleavable mass-tags (PC-MTs) for facile antibody labeling, which enables highly multiplexed IHC based on MALDI mass spectrometric imaging (MALDI-IHC). This approach significantly exceeds the multiplexity of both fluorescence- and previous cleavable mass-tag-based methods. Up to 12-plex MALDI-IHC was demonstrated on mouse brain, human tonsil, and breast cancer tissues specimens, reflecting the known molecular composition, anatomy, and pathology of the targeted biomarkers. Novel dual-labeled fluorescent PC-MT antibodies and label-free small-molecule mass spectrometric imaging greatly extend the capability of this new approach. MALDI-IHC shows promise for use in the fields of tissue pathology, tissue diagnostics, therapeutics, and precision medicine.

Keywords: bead-arrays; immunofluorescence; immunohistochemistry; in situ hybridization; mass spectrometric imaging; mass spectrometry; mass-tags; matrix-assisted laser desorption/ionization; multiplexing; pathology; photocleavable; tissue diagnostics.


Conflict of interest statement

The authors declare the following competing financial interest(s): G.Y., Z.L., K.J.R., and M.J.L. are current employees of AmberGen, Inc., 313 Pleasant Street, Watertown, MA 02472, USA. AmberGen, Inc. has filed patent applications on aspects of this work.

Figures

Figure 1
Figure 1
Structure and use of PC-MTs and PC-MT antibodies (PC-MT-antibodies). (Step 1, PC-MT) The structure of a PC-MT is shown. To produce the PC-MTs, an amine-terminal Fmoc-protected version of the photocleavable linker (PC-Linker; red) is incorporated during conventional Fmoc-based solid-phase peptide synthesis (SPPS) along with the other amino acids. The example PC-MT shown is oriented with the N-terminal on the left and the C-terminal on the right. “APRLRFYSL” is an example amino acid sequence of the peptide mass unit (see Supplementary Table S1 for all mass units used in this work). The PC-MTs contain a spacer that connects the 1-(2-nitrophenyl)-ethyl-based photocleavable nucleus (PC-Nucleus) to the probe-reactive moiety. This spacer is comprised of a portion of the PC-Linker plus the GSGGK amino acid sequence. The probe-reactive moiety (an NHS-ester leaving group) is generated during SPPS on the ε-amine of the lysine (K) included in the spacer. N-Terminal acetylation (“Ac”) of the α-amine is used to prevent the self-reaction and polymerization of the PC-MT. (Step 2, PC-MT-antibodies) The NHS-ester probe-reactive moiety of the PC-MTs is then reacted in one step with native primary amines in the antibody probes to form the PC-MT antibodies (PC-MT-antibodies). (Step 3, IHC) Immunohistochemistry (IHC) is performed by binding the PC-MT-antibodies to targets in thin tissue sections mounted on conductive microscope slides, followed by photocleavage under dry conditions to liberate the mass reporters. Note that a small residual portion of the PC-Linker (red) remains as part of the photocleaved mass reporters. (Step 4, MALDI-MSI) Finally, MALDI mass spectrometric imaging (MSI) is performed following the application of a matrix compound (matrix not shown). The inverted Y-shaped structures are antibodies, and the curved colored lines correspond to the mass units from different PC-MTs. The red shapes correspond to the photocleaved PC-Linker.
Figure 2
Figure 2
Multiplex MALDI mass spectrometry-based immunohistochemistry (MALDI-IHC) on five biomarkers in mouse-brain FFPE sagittal tissue sections. FFPE tissue sections were stained simultaneously with PC-MT-antibodies against five different biomarkers, then subjected to MALDI-MSI (in the positive ion reflector mode). Standard immunofluorescence staining was also performed on adjacent tissue sections. (a) Colorized five-plex MALDI-MS image corresponding to the monoisotopic mass reporter m/z values for the following PC-MT-antibodies (color coding is also noted on the image): myelin (red), NeuN (green), synapsin (blue), GLUT1 (cyan), and MAP2 (orange). The display scale (arbitrary peak intensity units), is as follows (minimum intensity/full intensity threshold): 0/27 (myelin), 0/12 (NeuN), 0/7 (synapsin), 0/8 (GLUT1), and 0/21 (MAP2). The hippocampus (∗) and cerebellum (⧧) were observed among other brain structures (all MALDI-MS images have a 20 μm spatial resolution). (b) MALDI-MS image from an adjacent tissue section stained with a rabbit IgG isotype control. The rabbit IgG was labeled with the same PC-MT as the rabbit polyclonal GLUT1 antibody (a mouse IgG isotype control labeled with the same PC-MT as the mouse monoclonal anti-MAP2 antibody was also tested with the same results, not shown). (c) Colorized immunofluorescence overlay of the cerebellum for synapsin (blue), NeuN (green), and myelin basic protein (red). Immunofluorescence was performed in the “single-plex” mode on adjacent tissue sections, and images were colorized and overlaid. (d) Color-coded overlaid MALDI-MS spectra are shown for selected pixels from the five-plex MALDI-MS image (the pixels are denoted with color-coded arrows in panel a). Black arrows in the spectra denote the mass reporter peaks as follows: myelin, 1206.72 m/z (red); NeuN, 1194.67 m/z (green); synapsin, 894.52 m/z (blue); GLUT1, 1624.80 m/z (cyan); and MAP2, 882.46 m/z (orange). Note that while natural isotopes of the mass reporters separated by 1 Da are easily resolved by the MALDI-MS, they are not discernible in the spectra provided due to the compact x-axis scaling.
Figure 3
Figure 3
Multiplex MALDI mass spectrometry-based immunohistochemistry (MALDI-IHC) on 12 biomarkers in human tonsil FFPE tissue sections. MALDI-IHC was performed as in Figure 2 except 12 different biomarkers were used (see Supplementary Table S1 for PC-MT assignments for each antibody). Furthermore, the pan-cytokeratin antibody (CK) was labeled with both a PC-MT and fluorophore. (a) CK immunofluorescence image of the whole tonsil tissue section taken at a 5 μm resolution using a GenePix 4200A fluorescence microarray scanner. (b) MALDI-MS image of the same tissue section showing an intensity map of the monoisotopic m/z value for the PC-MT from the CK antibody (all MALDI-MS images have a 10 μm spatial resolution). The display scale (arbitrary peak intensity units) is as follows (minimum intensity/full intensity threshold): 5/50 (CK). (c) Multicolor MALDI-MS image overlay of selected biomarkers from the whole-tissue section, which show differential structural patterns. The display scale (arbitrary peak intensity units), is as follows (minimum intensity/full intensity threshold): 3/25 (Ki67), 3/40 (CD68), 3/7 (CD45RO), 2/20 (CD20), 2/5 (CD8), 3/7 (CD3), and 5/50 (CK). Color coding is indicated in the key underneath the image. (d) Individual MALDI-MS images of all 12 biomarkers shown as a color gradient for a representative subregion of the tissue section (biomarker identities are indicated by the labels). The “blank” is also shown, which is an adjacent tissue section stained with an isotype-control IgG bearing a PC-MT (same PC-MT as CD3). The gradient color scale is shown at the bottom. For comparison, the display scale of all biomarkers is set to a full-intensity threshold of 25 (arbitrary peak intensity units) and a minimum display intensity of 2.5 except for CK, CD20, and Ki67, which produced exceptionally strong signals and were therefore set to 50 and 5, respectively.
Figure 4
Figure 4
Multiplex MALDI mass spectrometry-based immunohistochemistry (MALDI-IHC) on 12 biomarkers in human breast cancer FFPE tissue sections. 12-Plex MALDI-IHC was performed as in Figure 3. The color coding of the multicolor images is indicated in the key for each, and the display scales listed below are in arbitrary peak intensity units (as the minimum intensity/full intensity threshold). (a) Multicolor MALDI-MS image overlay of a breast cancer tissue section showing an intensity map of the monoisotopic m/z values for the PC-MTs from CK, HER2, and ER (all MALDI-MS images have a 10 μm spatial resolution). The display scale is as follows: 1/35 (CK), 2/20 (HER2), and 2/8 (ER). According to traditional IHC, this tissue is PR–/ER–/HER2+ (see the main text for more detail). The blue arrow indicates an example tumor region. (b) Individual MALDI-MS images of all 12 biomarkers shown as a color gradient for the entire tissue section. The “blank” is also shown, which is an adjacent tissue section stained with an isotype-control IgG bearing a PC-MT (same PC-MT as CD3). The gradient color scale is also shown. For comparison, the display scale of all biomarkers is 2/20 except for CK, CD3, CD4, CD68, and Ki67, which produced exceptionally strong signals and are therefore set to 5/50. (c.) Multicolor MALDI-MS image overlay of the same breast cancer tissue section showing the selected biomarkers, which highlight tumor-infiltrating immune cells. The display scale is as follows: 1/30 (CK), 3/20 (CD68), 1/10 (HER2), 2/12 (CD20), and 2/7 (CD8). The orange, green, and cyan arrows indicate the tumor (colocalized CK and HER2), CD20+ B-cells, and CD8+ cytotoxic T-cells, respectively. The inset image on the lower left is a magnification of the region indicated by the cyan arrow, showing only CK and CD8. (d.) Multicolor MALDI-MS image overlay (top panel) and individual gradient-scale MALDI-MS images (bottom panels) of selected biomarkers on a different breast cancer tissue section. In this case, this tissue is PR+/ER+/HER2– according to traditional IHC (see the main text for more detail). The display scale for the multicolor image is as follows: 6/55 (CK), 2/20 (PR), and 2/15 (ER). For comparison, the display scale of the gradient color images is 2/20 except for CK, which produced an exceptionally strong signal and is therefore set to 10/100.
Figure 5
Figure 5
Untargeted small-molecule MALDI-MSI and targeted MALDI-IHC on the same tissue section. (a) Direct untargeted MALDI-MSI was first performed on an unfixed fresh-frozen mouse brain sagittal tissue section (all MALDI-MS images have a 20 μm spatial resolution). Three well-known lipid species (sulfatide (ST), m/z 888.7; phosphatidylinositol (PI), m/z 885.4; and phosphatidylethanolamine (PE), m/z 790.5) are shown in the colorized MALDI-MS image (red, green, and blue, respectively). The display scale (arbitrary peak intensity units) is as follows (minimum intensity/full intensity threshold): 5/14 (ST), 6/8 (PI), and 7/10 (PE). (b and c) The same tissue section was then processed for a second round of MALDI-MSI. To do so, the matrix was washed away, the tissue was fixed, and MALDI-IHC was performed to detect macromolecular antigens using PC-MT-antibodies. For demonstration purposes, images of selected biomolecules from the first and second rounds of MALDI-MSI were overlaid. (b) Sulfatide (red) from the first round of MALDI-MSI (direct small-molecule detection) is overlaid with the image of NeuN (green) from the second round of MALDI-MSI (MALDI-IHC). The display scale (arbitrary peak intensity units) is as follows (minimum intensity/full intensity threshold): 8/20 (ST) and 1/5 (NeuN). (c) Sulfatide (red) from the first round of MALDI-MSI (direct small-molecule detection) is overlaid with the image of myelin basic protein (green) from the second round of MALDI-MSI (MALDI-IHC). The display scale (arbitrary peak intensity units) is as follows (minimum intensity/full intensity threshold): 8/20 (ST) and 2/20 (myelin). (d) Example overlaid spectra from the first round of MALDI-MSI (direct small-molecule detection) are shown, which were color-coded to match the image in panel a. (the three lipid masses are indicated). The color-coded arrows in panel a indicate the regions from which the MALDI-MS spectra were derived.

Similar articles

Cited by

References

    1. Howat W.; Warford A. Advancing the boundaries of molecular cellular pathology. Methods 2014, 70, 1–2. 10.1016/j.ymeth.2014.09.007. - DOI - PubMed
    1. Stack E. C.; Wang C.; Roman K. A.; Hoyt C. C. Multiplexed immunohistochemistry, imaging, and quantitation: a review, with an assessment of Tyramide signal amplification, multispectral imaging and multiplex analysis. Methods 2014, 70, 46–58. 10.1016/j.ymeth.2014.08.016. - DOI - PubMed
    1. Katikireddy K. R.; O’Sullivan F. Immunohistochemical and immunofluorescence procedures for protein analysis. Methods Mol. Biol. 2011, 784, 155–167. 10.1007/978-1-61779-289-2_11. - DOI - PubMed
    1. Dugger B. N.; Dickson D. W. Pathology of Neurodegenerative Diseases. Cold Spring Harbor Perspect. Biol. 2017, 9, a028035.10.1101/cshperspect.a028035. - DOI - PMC - PubMed
    1. Deng H. X.; Bigio E. H.; Siddique T. Detection of protein aggregation in neurodegenerative diseases. Methods Mol. Biol. 2011, 793, 259–272. 10.1007/978-1-61779-328-8_17. - DOI - PubMed