

The relationship between seasonality, latitude and tuberculosis notifications in Pakistan
- PMID: 33632152
- PMCID: PMC7905850
- DOI: 10.1186/s12879-021-05899-x
The relationship between seasonality, latitude and tuberculosis notifications in Pakistan
Abstract
Background: Pakistan ranks amongst the top 20 highest burden tuberculosis (TB) countries in the world. Approximately 369,548 cases of TB (all forms) were notified in 2018, with an estimated incidence of 265 per 100,000 people per year. In other settings, TB has been shown to demonstrate seasonal variation, with higher incidence in the spring/summer months and lower incidence in the autumn/winter; the amplitude of seasonal variation has also been reported to be higher with increasing distance from the equator.
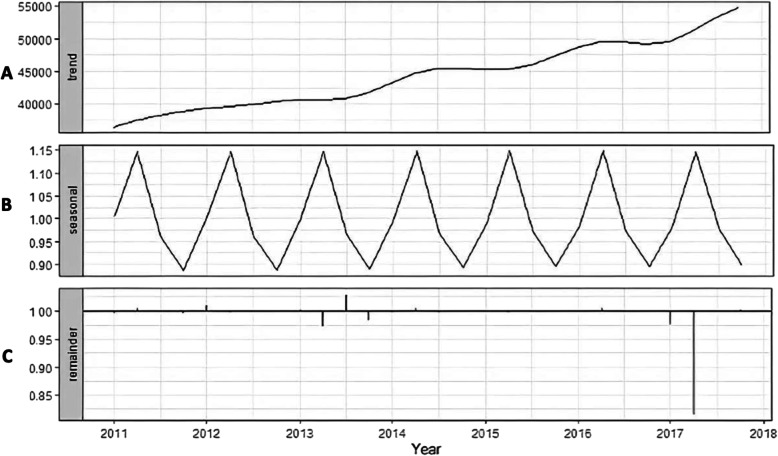
Methods: Notifications of newly-diagnosed pulmonary and extrapulmonary TB cases were obtained for 139 districts in Pakistan from 2011 to 2017. Data were provided by the Pakistan National TB Control Programme, Islamabad, Pakistan. Statistical analyses were performed to determine whether there was seasonal variation in TB notifications in Pakistan; whether the amplitude of seasonal variation in TB notifications varied according to latitude; whether the amplitude of seasonal variation of TB in Pakistan differed between extrapulmonary TB vs. pulmonary TB. To assess the quarterly seasonality of TB, we used the X-13-ARIMA-SEATS seasonal adjustment programme from the United States Census Bureau. The mean difference and corresponding 95% confidence intervals of seasonal amplitudes between different latitudes and clinical phenotype of TB were estimated using linear regression.
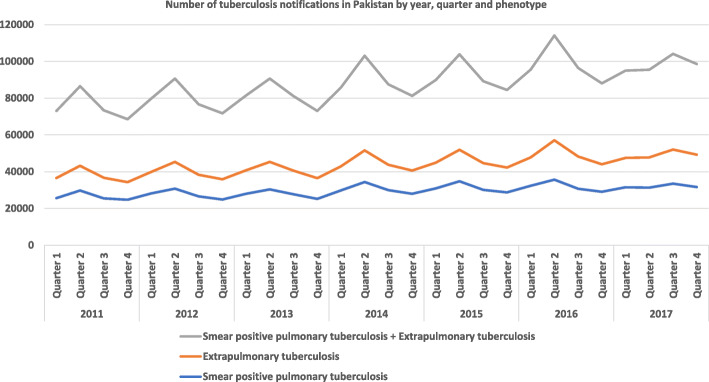
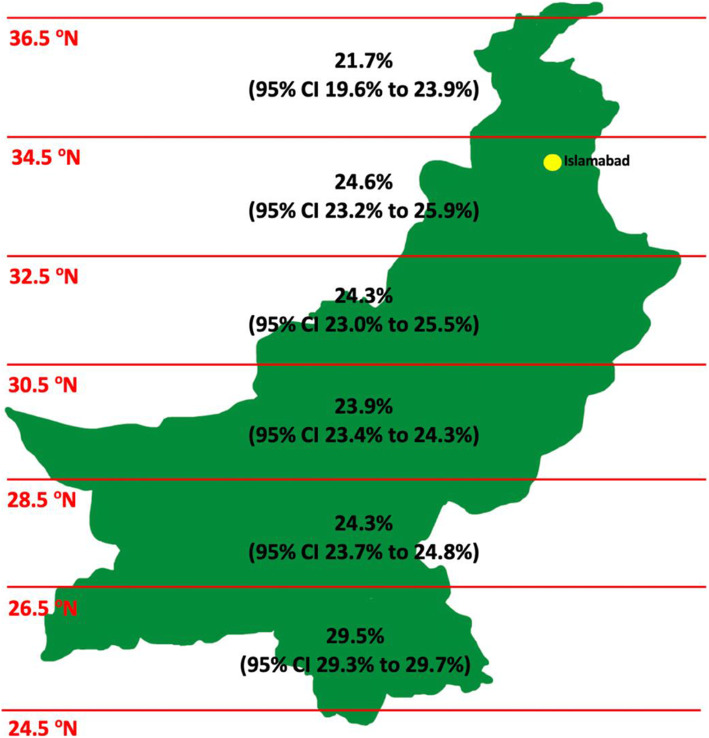
Results: TB notifications were highest in quarter 2, and lowest in quarter 4. The mean amplitude of seasonal variation was 25.5% (95% CI 25.0 to 25.9%). The mean seasonal amplitude of TB notifications from latitude 24.5°N- < 26.5°N was 29.5% (95% CI 29.3 to 29.7%) whilst the mean seasonal amplitude of TB notifications from latitude 34.5°N - < 36.5°N was 21.7% (95% CI 19.6 to 23.9%). The mean seasonal amplitude of TB notifications across Pakistan between latitudes 24.5°N to 36.5°N reached statistically significant difference (p < 0.001). The amplitude of seasonal variation was greater for extrapulmonary TB (mean seasonal amplitude: 32.6, 95% CI 21.4 to 21.8%) vs. smear positive pulmonary TB mean seasonal amplitude: 21.6, 95% CI 32.1 to 33.1%), p < 0.001.
Conclusion: TB notifications in Pakistan exhibit seasonal variation with a peak in quarter 2 (April-June) and trough in quarter 4 (October-December). The amplitude of seasonality decreases with increasing latitude, and is more pronounced for extrapulmonary than for pulmonary TB.
Keywords: Public health; Pulmonary; Respiration disorders; Tuberculosis.
Conflict of interest statement
Not applicable.
Figures
Similar articles
-
Tuberculosis seasonality in the Netherlands differs between natives and non-natives: a role for vitamin D deficiency?Int J Tuberc Lung Dis. 2012 May;16(5):639-44. doi: 10.5588/ijtld.11.0680. Epub 2012 Mar 9. Int J Tuberc Lung Dis. 2012. PMID: 22410705
-
Seasonality and trend analysis of tuberculosis in Lahore, Pakistan from 2006 to 2013.J Epidemiol Glob Health. 2015 Dec;5(4):397-403. doi: 10.1016/j.jegh.2015.07.007. Epub 2015 Aug 28. J Epidemiol Glob Health. 2015. PMID: 26318884 Free PMC article.
-
Seasonal variation of newly notified pulmonary tuberculosis cases from 2004 to 2013 in Wuhan, China.PLoS One. 2014 Oct 10;9(10):e108369. doi: 10.1371/journal.pone.0108369. eCollection 2014. PLoS One. 2014. PMID: 25303675 Free PMC article.
-
Drivers of Seasonal Variation in Tuberculosis Incidence: Insights from a Systematic Review and Mathematical Model.Epidemiology. 2018 Nov;29(6):857-866. doi: 10.1097/EDE.0000000000000877. Epidemiology. 2018. PMID: 29870427 Free PMC article.
-
The growing burden of tuberculosis: global trends and interactions with the HIV epidemic.Arch Intern Med. 2003 May 12;163(9):1009-21. doi: 10.1001/archinte.163.9.1009. Arch Intern Med. 2003. PMID: 12742798 Review.
Cited by
-
Estimating the Effects of the COVID-19 Outbreak on the Reductions in Tuberculosis Cases and the Epidemiological Trends in China: A Causal Impact Analysis.Infect Drug Resist. 2021 Nov 6;14:4641-4655. doi: 10.2147/IDR.S337473. eCollection 2021. Infect Drug Resist. 2021. PMID: 34785913 Free PMC article.
-
Tension hydrothorax in a patient with SARS-CoV-2 pneumonitis and pleural Mycobacterium tuberculosis.BMJ Case Rep. 2021 Jul 26;14(7):e243760. doi: 10.1136/bcr-2021-243760. BMJ Case Rep. 2021. PMID: 34312137 Free PMC article.
-
Tuberculosis epidemiological trend in Sousse, Tunisia during twenty years (2000-2019).Libyan J Med. 2022 Dec;17(1):2003968. doi: 10.1080/19932820.2021.2003968. Libyan J Med. 2022. PMID: 34802395 Free PMC article.
-
Spatiotemporal analysis and seasonality of tuberculosis in Pudong New Area of Shanghai, China, 2014-2023.BMC Infect Dis. 2024 Jul 31;24(1):761. doi: 10.1186/s12879-024-09645-x. BMC Infect Dis. 2024. PMID: 39085765 Free PMC article.
-
Rasmussen aneurysm: A hidden hazard.Respir Med Case Rep. 2024 Nov 13;52:102137. doi: 10.1016/j.rmcr.2024.102137. eCollection 2024. Respir Med Case Rep. 2024. PMID: 39620100 Free PMC article.
References
-
- WHO . WHO | global tuberculosis report 2019: World Health Organization. 2020.
-
- Luquero FJ, Sanchez-Padilla E, Simon-Soria F, Eiros JM, Golub JE. Trend and seasonality of tuberculosis in Spain, 1996-2004. Int J Tuberc Lung Dis. 2008;12(2):221–224. - PubMed
MeSH terms
Grants and funding
LinkOut - more resources
Full Text Sources
Other Literature Sources
Medical
Miscellaneous
