

Identification of key genes involved in tumor immune cell infiltration and cetuximab resistance in colorectal cancer
- PMID: 33632198
- PMCID: PMC7905896
- DOI: 10.1186/s12935-021-01829-8
Identification of key genes involved in tumor immune cell infiltration and cetuximab resistance in colorectal cancer
Abstract
Background: The anti-epidermal growth factor receptor (EGFR) antibody introduces adaptable variations to the transcriptome and triggers tumor immune infiltration, resulting in colorectal cancer (CRC) treatment resistance. We intended to identify genes that play essential roles in cetuximab resistance and tumor immune cell infiltration.
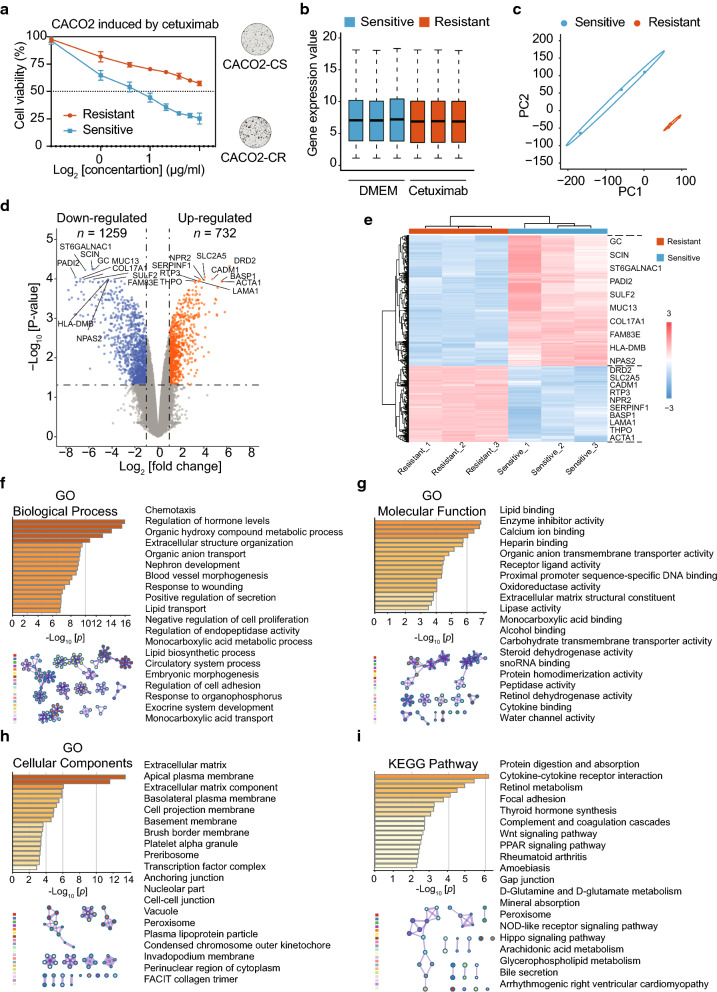
Methods: A cetuximab-resistant CACO2 cellular model was established, and its transcriptome variations were detected by microarray. Meanwhile, public data from the Gene Expression Omnibus and The Cancer Genome Atlas (TCGA) database were downloaded. Integrated bioinformatics analysis was applied to detect differentially expressed genes (DEGs) between the cetuximab-resistant and the cetuximab-sensitive groups. Then, we investigated correlations between DEGs and immune cell infiltration. The DEGs from bioinformatics analysis were further validated in vitro and in clinical samples.
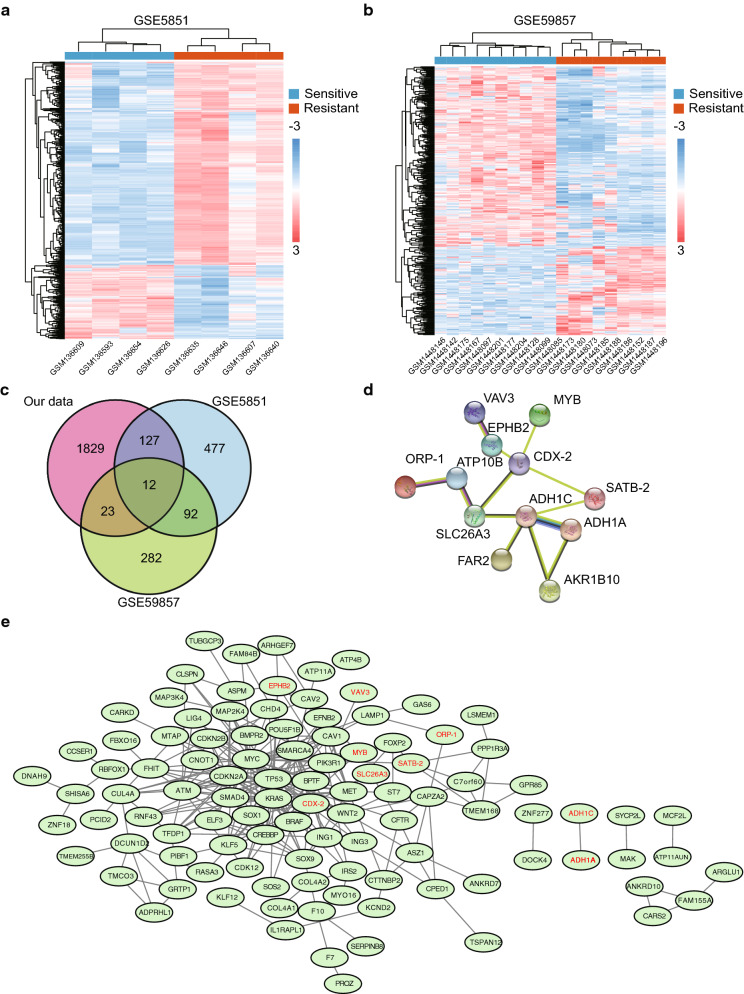
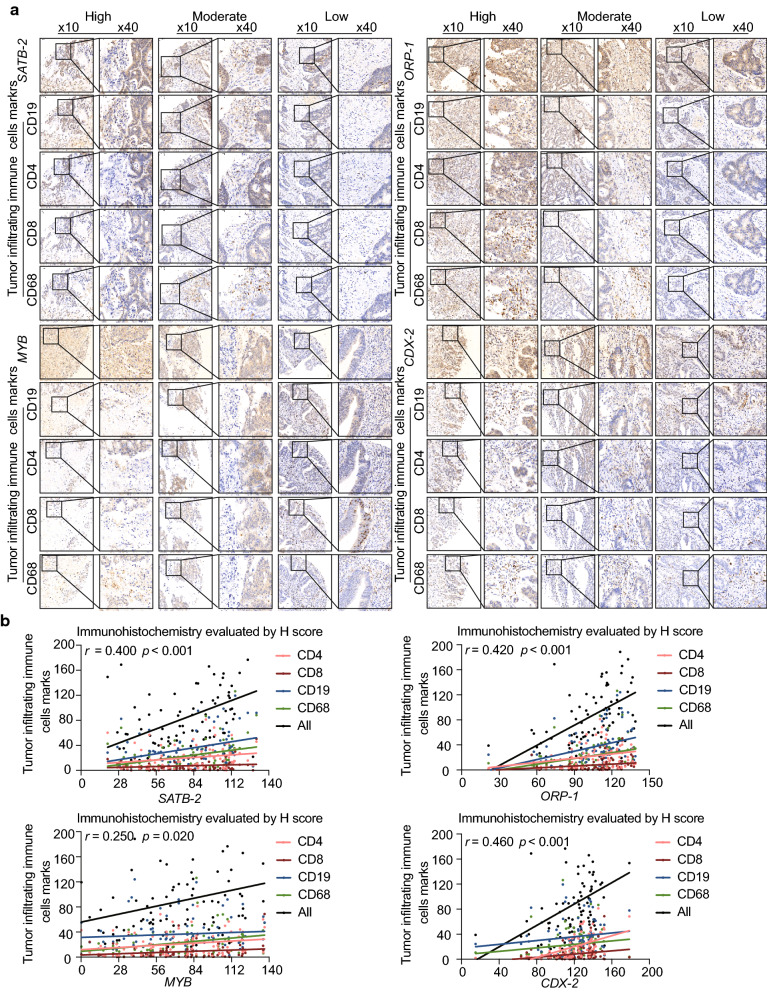
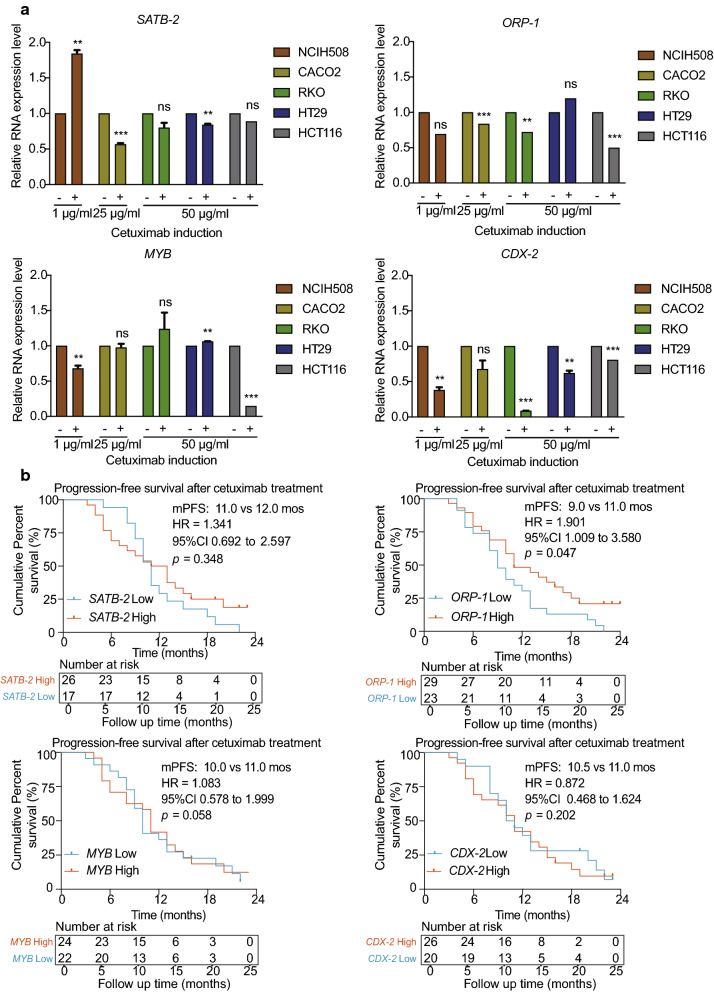
Results: We identified 732 upregulated and 1259 downregulated DEGs in the induced cellular model. Gene Ontology and Kyoto Encyclopedia of Genes and Genomes pathway enrichment analyses, along with Gene Set Enrichment Analysis and Gene Set Variation Analysis, indicated the functions of the DEGs. Together with GSE59857 and GSE5841, 12 common DEGs (SATB-2, AKR1B10, ADH1A, ADH1C, MYB, ATP10B, CDX-2, FAR2, EPHB2, SLC26A3, ORP-1, VAV3) were identified and their predictive values of cetuximab treatment were validated in GSE56386. In online Genomics of Drug Sensitivity in Cancer (GDSC) database, nine of twelve DEGs were recognized in the protein-protein (PPI) network. Based on the transcriptome profiles of CRC samples in TCGA and using Tumor Immune Estimation Resource Version 2.0, we bioinformatically determined that SATB-2, ORP-1, MYB, and CDX-2 expressions were associated with intensive infiltration of B cell, CD4+ T cell, CD8+ T cell and macrophage, which was then validated the correlation in clinical samples by immunohistochemistry. We found that SATB-2, ORP-1, MYB, and CDX-2 were downregulated in vitro with cetuximab treatment. Clinically, patients with advanced CRC and high ORP-1 expression exhibited a longer progression-free survival time when they were treated with anti-EGFR therapy than those with low ORP-1 expression.
Conclusions: SATB-2, ORP-1, MYB, and CDX-2 were related to cetuximab sensitivity as well as enhanced tumor immune cell infiltration in patients with CRC.
Keywords: Anti‐epidermal growth factor receptor therapy; Colorectal cancer; Drug resistance; Transcriptional alterations; Tumor immune cell infiltration.
Conflict of interest statement
The authors declare that they have no competing interests.
Figures


Similar articles
-
Prediction of Target Genes and Pathways Associated With Cetuximab Insensitivity in Colorectal Cancer.Technol Cancer Res Treat. 2018 Jan 1;17:1533033818806905. doi: 10.1177/1533033818806905. Technol Cancer Res Treat. 2018. PMID: 30336768 Free PMC article.
-
Identification of key genes for predicting colorectal cancer prognosis by integrated bioinformatics analysis.Oncol Lett. 2020 Jan;19(1):388-398. doi: 10.3892/ol.2019.11068. Epub 2019 Nov 7. Oncol Lett. 2020. PMID: 31897151 Free PMC article.
-
Identifying the key genes and microRNAs in colorectal cancer liver metastasis by bioinformatics analysis and in vitro experiments.Oncol Rep. 2019 Jan;41(1):279-291. doi: 10.3892/or.2018.6840. Epub 2018 Nov 1. Oncol Rep. 2019. PMID: 30542696 Free PMC article.
-
Delineating the underlying molecular mechanisms and key genes involved in metastasis of colorectal cancer via bioinformatics analysis.Oncol Rep. 2018 May;39(5):2297-2305. doi: 10.3892/or.2018.6303. Epub 2018 Mar 8. Oncol Rep. 2018. PMID: 29517105
-
The Roles of RAC1 and RAC1B in Colorectal Cancer and Their Potential Contribution to Cetuximab Resistance.Cancers (Basel). 2024 Jul 6;16(13):2472. doi: 10.3390/cancers16132472. Cancers (Basel). 2024. PMID: 39001533 Free PMC article. Review.
Cited by
-
ADH1C inhibits progression of colorectal cancer through the ADH1C/PHGDH /PSAT1/serine metabolic pathway.Acta Pharmacol Sin. 2022 Oct;43(10):2709-2722. doi: 10.1038/s41401-022-00894-7. Epub 2022 Mar 30. Acta Pharmacol Sin. 2022. PMID: 35354963 Free PMC article.
-
The Expression of Ferroptosis-Related Genes in Hepatocellular Carcinoma and Their Relationships With Prognosis.J Hepatocell Carcinoma. 2025 Mar 20;12:629-648. doi: 10.2147/JHC.S500394. eCollection 2025. J Hepatocell Carcinoma. 2025. PMID: 40130081 Free PMC article.
-
Targeting isoforms of RON kinase (MST1R) drives antitumor efficacy.Cell Death Differ. 2023 Dec;30(12):2491-2507. doi: 10.1038/s41418-023-01235-9. Epub 2023 Nov 6. Cell Death Differ. 2023. PMID: 37926711 Free PMC article.
-
Emerging role of MYB transcription factors in cancer drug resistance.Cancer Drug Resist. 2024 Apr 30;7:15. doi: 10.20517/cdr.2023.158. eCollection 2024. Cancer Drug Resist. 2024. PMID: 38835346 Free PMC article. Review.
-
Construction of a Two-Gene Immunogenomic-Related Prognostic Signature in Lung Squamous Cell Carcinoma.Front Mol Biosci. 2022 Apr 8;9:867494. doi: 10.3389/fmolb.2022.867494. eCollection 2022. Front Mol Biosci. 2022. PMID: 35463955 Free PMC article.
References
-
- Heinemann V, von Weikersthal LF, Decker T, Kiani A, Vehling-Kaiser U, Al-Batran SE, Heintges T, Lerchenmuller C, Kahl C, Seipelt G, et al. FOLFIRI plus cetuximab versus FOLFIRI plus bevacizumab as first-line treatment for patients with metastatic colorectal cancer (FIRE-3): a randomised, open-label, phase 3 trial. Lancet Oncol. 2014;15(10):1065–75. doi: 10.1016/S1470-2045(14)70330-4. - DOI - PubMed
-
- Primrose J, Falk S, Finch-Jones M, Valle J, O’Reilly D, Siriwardena A, Hornbuckle J, Peterson M, Rees M, Iveson T, et al. Systemic chemotherapy with or without cetuximab in patients with resectable colorectal liver metastasis: the New EPOC randomised controlled trial. Lancet Oncol. 2014;15(6):601–11. doi: 10.1016/S1470-2045(14)70105-6. - DOI - PubMed
Grants and funding
LinkOut - more resources
Full Text Sources
Other Literature Sources
Research Materials
Miscellaneous
