. 2021 Feb 25;13(1):33.
doi: 10.1186/s13073-021-00852-8.

Clinical-grade whole-genome sequencing and 3' transcriptome analysis of colorectal cancer patients

Affiliations

Clinical-grade whole-genome sequencing and 3' transcriptome analysis of colorectal cancer patients

Agata Stodolna et al. Genome Med. .

Abstract

Background: Clinical-grade whole-genome sequencing (cWGS) has the potential to become the standard of care within the clinic because of its breadth of coverage and lack of bias towards certain regions of the genome. Colorectal cancer presents a difficult treatment paradigm, with over 40% of patients presenting at diagnosis with metastatic disease. We hypothesised that cWGS coupled with 3' transcriptome analysis would give new insights into colorectal cancer.

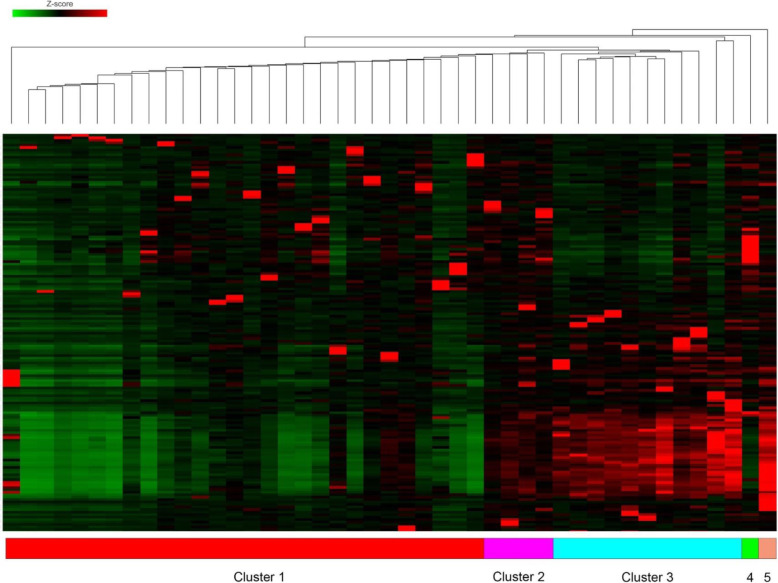
Methods: Patients underwent PCR-free whole-genome sequencing and alignment and variant calling using a standardised pipeline to output SNVs, indels, SVs and CNAs. Additional insights into the mutational signatures and tumour biology were gained by the use of 3' RNA-seq.

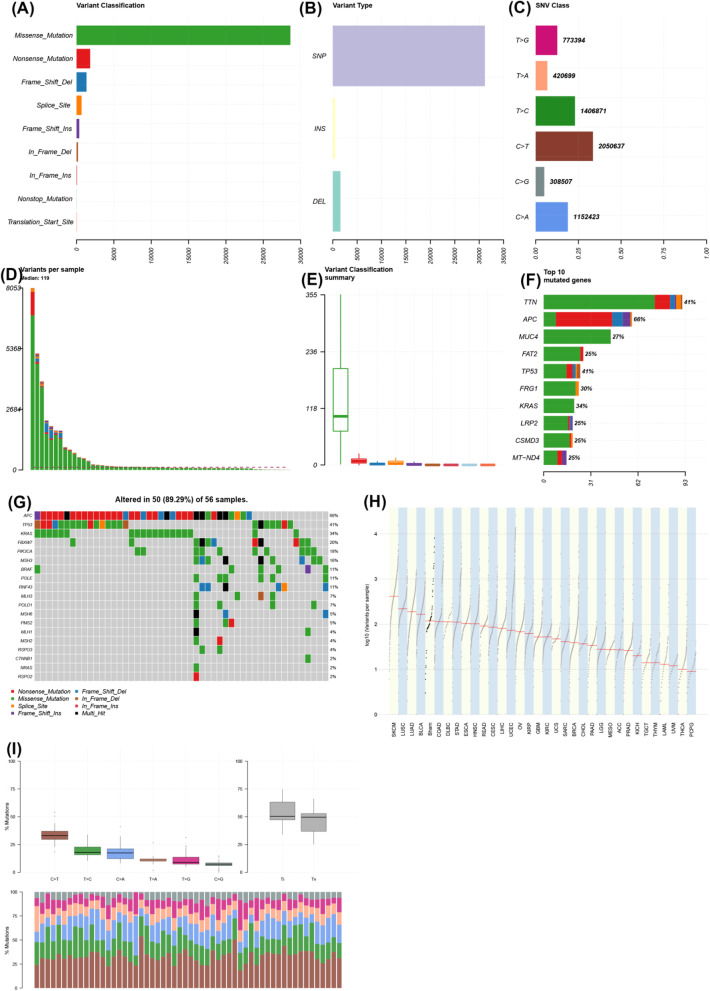
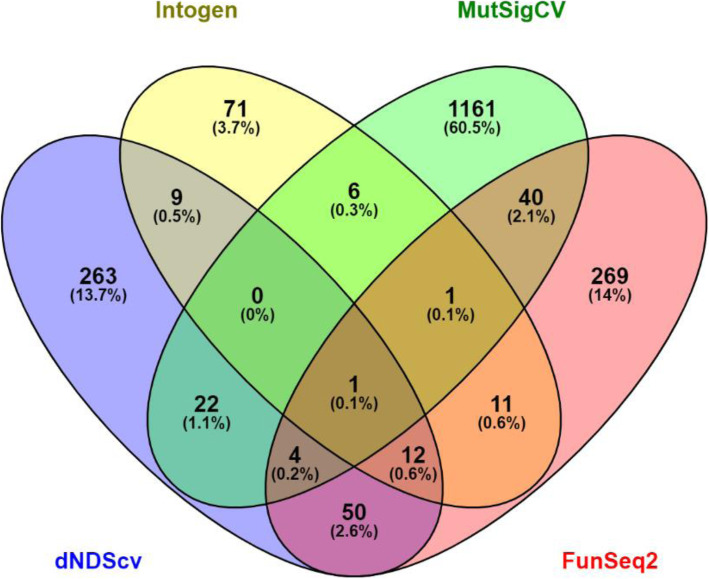
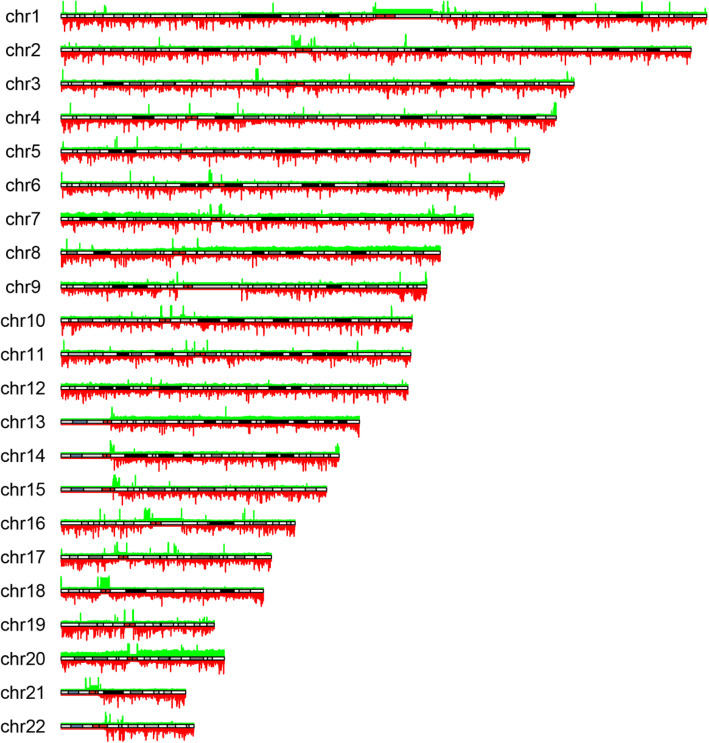
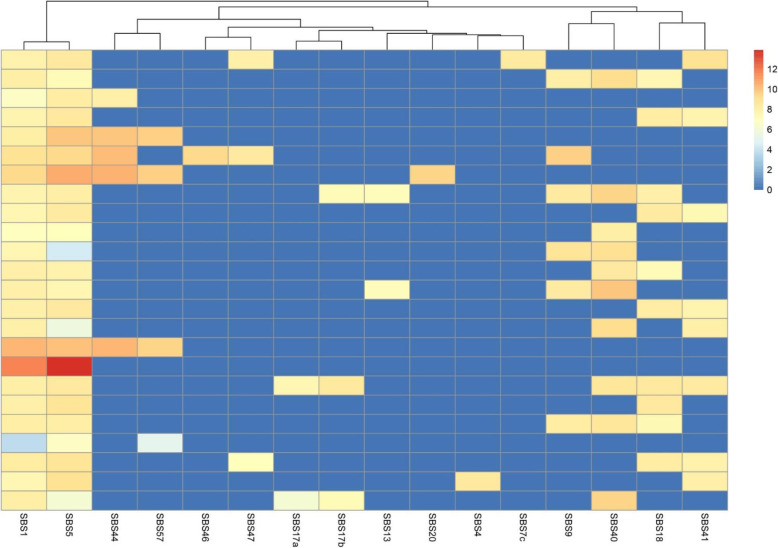
Results: Fifty-four patients were studied in total. Driver analysis identified the Wnt pathway gene APC as the only consistently mutated driver in colorectal cancer. Alterations in the PI3K/mTOR pathways were seen as previously observed in CRC. Multiple private CNAs, SVs and gene fusions were unique to individual tumours. Approximately 30% of patients had a tumour mutational burden of > 10 mutations/Mb of DNA, suggesting suitability for immunotherapy.

Conclusions: Clinical whole-genome sequencing offers a potential avenue for the identification of private genomic variation that may confer sensitivity to targeted agents and offer patients new options for targeted therapies.

Keywords: Chemoradiotherapy; Genomics; Pathological complete response; Rectal cancer.


Conflict of interest statement

AB has received travel costs and honoraria from Illumina Inc., Oxford Nanopore, Ono Pharm and Bristol Myers Squibb. MH, MV, ZK, JB and MR are employees of Illumina, a public company that develops and markets systems for genetic analysis. The remaining authors declare that they have no competing interests.

Figures

Fig. 1
Fig. 1
Integrated plot of the characteristics of the whole-genome sequencing dataset of colorectal cancer. a Variant classification by type (y-axis), frequency of variant (x-axis). b Variant type (y-axis). SNP, single nucleotide polymorphism; INS, insertion; DEL, deletion; frequency (x-axis). c Single nucleotide variant (SNV) class plot—y-axis demonstrates nucleotide changes; the x-axis demonstrates the proportions of variants in the cohort; numbers on the end of bars demonstrate the total numbers of each variant. d Bar chart showing variants per sample—variants (y-axis); samples on the x-axis. e Variant classification summary showing the range of variants per sample (y-axis); the x-axis shows missense (green), nonsense (red), frameshift deletion (blue), splice site (yellow), frameshift insertion (purple), in-frame deletion (brown), in-frame insertion (dark red), non-stop mutation (light blue) and transcription start site mutation (orange). f Top ten mutated genes by frequency—genes on the y-axis, numbers of mutations on the x-axis; colours are the same as in e. g Oncoprint of colorectal driver genes (left y-axis) by sample (x-axis) with the variant type shown in the key. Percentages across the whole cohort are seen in percentages down the right y-axis. h TCGA style log [10] variants per sample plot (y-axis) with TCGA cohorts (x-axis); Bham, Birmingham cohort (fifth from left). I Mutational type plot: top left panel—% mutation changes in the cohort; top right panel—% transition vs. transversion mutations across the cohort; bottom panel—bar chart showing the proportion of mutations with the percentage on the y-axis and the type of mutations shown by different coloured bars
Fig. 2
Fig. 2
Overlapping genes from each significant variant caller (Intogen, MutSigCV, dnDScv and FunSeq2) shown as numbers of genes mutated (percentage in brackets)
Fig. 3
Fig. 3
Genome-wide copy plot of all samples across cohort (green, gain; red, loss); h[[eight of the bar is proportional to the number of samples with copy number variation
Fig. 4
Fig. 4
Most frequent single base substitution mutational signatures shown in hierarchical cluster plot (samples with identical signature combinations were collapsed); single-based substitution signatures on the x-axis, samples on the y-axis. Colour heat map correlates to the strength of association with SBS signature (red = strong, blue = weak)
Fig. 5
Fig. 5
Hierarchical clustering plot of 100 most variably expressed genes in RNA-seq data, demonstrating five separate clusters. Red = over-expressed, green = under-expressed within cohort by Z-score
Fig. 6
Fig. 6
Graph of CMS calls (left) and CRIS calls (right) for the dataset

References

    1. Atkin W, Wooldrage K, Brenner A, Martin J, Shah U, Perera S, et al. Adenoma surveillance and colorectal cancer incidence: a retrospective, multicentre, cohort study. Lancet Oncol. 2017;18(6):823–834. doi: 10.1016/S1470-2045(17)30187-0. - DOI - PMC - PubMed
    1. Morin PJ, Sparks AB, Korinek V, Barker N, Clevers H, Vogelstein B, et al. Activation of beta-catenin-Tcf signaling in colon cancer by mutations in beta-catenin or APC. Science. 1997;275(5307):1787–1790. doi: 10.1126/science.275.5307.1787. - DOI - PubMed
    1. Leedham SJ, Chetty R. Wnt disruption in colorectal polyps - the traditional serrated adenoma enters the fray. J Pathol. 2016;239(4):387–390. doi: 10.1002/path.4741. - DOI - PubMed
    1. Seeber A, Gastl G. Targeted therapy of colorectal cancer. Oncol Res Treat. 2016;39(12):796–802. doi: 10.1159/000453027. - DOI - PubMed
    1. Cancer Genome Atlas N. Comprehensive molecular characterization of human colon and rectal cancer. Nature. 2012;487(7407):330–337. doi: 10.1038/nature11252. - DOI - PMC - PubMed

Publication types

MeSH terms

Substances