

DNA methylation and cancer incidence: lymphatic-hematopoietic versus solid cancers in the Strong Heart Study
- PMID: 33632303
- PMCID: PMC7908806
- DOI: 10.1186/s13148-021-01030-8
DNA methylation and cancer incidence: lymphatic-hematopoietic versus solid cancers in the Strong Heart Study
Abstract
Background: Epigenetic alterations may contribute to early detection of cancer. We evaluated the association of blood DNA methylation with lymphatic-hematopoietic cancers and, for comparison, with solid cancers. We also evaluated the predictive ability of DNA methylation for lymphatic-hematopoietic cancers.
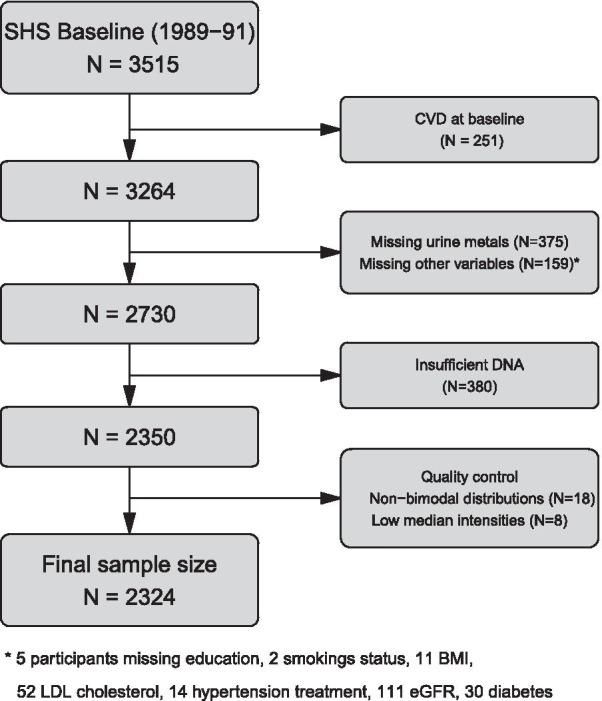
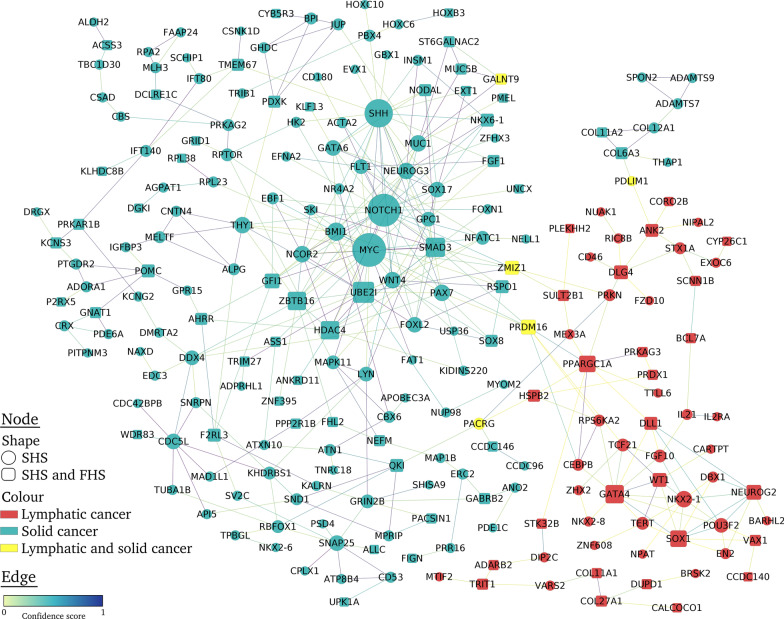
Methods: Blood DNA methylation was measured using the Illumina Infinium methylationEPIC array in 2324 Strong Heart Study participants (41.4% men, mean age 56 years). 788,368 CpG sites were available for differential DNA methylation analysis for lymphatic-hematopoietic, solid and overall cancers using elastic-net and Cox regression models. We conducted replication in an independent population: the Framingham Heart Study. We also analyzed differential variability and conducted bioinformatic analyses to assess for potential biological mechanisms.
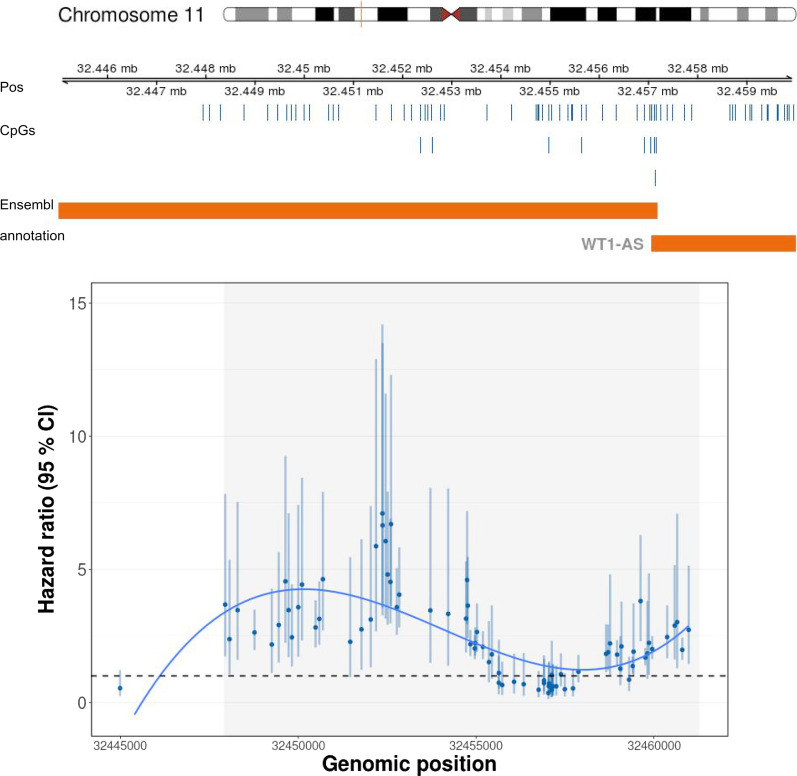
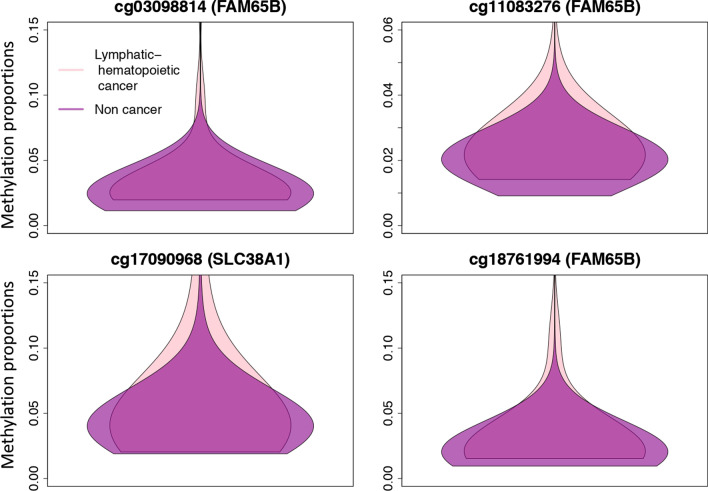
Results: Over a follow-up of up to 28 years (mean 15), we identified 41 lymphatic-hematopoietic and 394 solid cancer cases. A total of 126 CpGs for lymphatic-hematopoietic cancers, 396 for solid cancers, and 414 for overall cancers were selected as predictors by the elastic-net model. For lymphatic-hematopoietic cancers, the predictive ability (C index) increased from 0.58 to 0.87 when adding these 126 CpGs to the risk factor model in the discovery set. The association was replicated with hazard ratios in the same direction in 28 CpGs in the Framingham Heart Study. When considering the association of variability, rather than mean differences, we found 432 differentially variable regions for lymphatic-hematopoietic cancers.
Conclusions: This study suggests that differential methylation and differential variability in blood DNA methylation are associated with lymphatic-hematopoietic cancer risk. DNA methylation data may contribute to early detection of lymphatic-hematopoietic cancers.
Keywords: American Indians; DNA methylation; Epigenetics; Hematopoietic cancers; Lymphatic cancers.
Conflict of interest statement
The authors declare that they have no competing interests.
Figures
Similar articles
-
Blood DNA Methylation and Incident Coronary Heart Disease: Evidence From the Strong Heart Study.JAMA Cardiol. 2021 Nov 1;6(11):1237-1246. doi: 10.1001/jamacardio.2021.2704. JAMA Cardiol. 2021. PMID: 34347013 Free PMC article.
-
An epigenome-wide study of DNA methylation profiles and lung function among American Indians in the Strong Heart Study.Clin Epigenetics. 2022 Jun 9;14(1):75. doi: 10.1186/s13148-022-01294-8. Clin Epigenetics. 2022. PMID: 35681244 Free PMC article.
-
Blood DNA methylation and liver cancer in American Indians: evidence from the Strong Heart Study.Cancer Causes Control. 2024 Apr;35(4):661-669. doi: 10.1007/s10552-023-01822-8. Epub 2023 Nov 27. Cancer Causes Control. 2024. PMID: 38010586 Free PMC article.
-
DNA Methylation and Age-Independent Cardiovascular Risk, an Epigenome-Wide Approach: The REGICOR Study (REgistre GIroní del COR).Arterioscler Thromb Vasc Biol. 2018 Mar;38(3):645-652. doi: 10.1161/ATVBAHA.117.310340. Epub 2018 Jan 11. Arterioscler Thromb Vasc Biol. 2018. PMID: 29326313 Free PMC article.
-
Genome-wide analysis of DNA methylation and risk of cardiovascular disease in a Chinese population.BMC Cardiovasc Disord. 2021 May 12;21(1):240. doi: 10.1186/s12872-021-02001-w. BMC Cardiovasc Disord. 2021. PMID: 33980183 Free PMC article.
Cited by
-
The methylation signature of hepatocellular carcinoma trajectory based on pseudotime and chronological time for predicting precancerous patients.Oncologist. 2025 Aug 4;30(8):oyae292. doi: 10.1093/oncolo/oyae292. Oncologist. 2025. PMID: 39589232 Free PMC article.
-
Epigenetic Biomarkers of Lead Exposure and Cardiovascular Disease: Prospective Evidence in the Strong Heart Study.J Am Heart Assoc. 2022 Dec 6;11(23):e026934. doi: 10.1161/JAHA.122.026934. Epub 2022 Nov 16. J Am Heart Assoc. 2022. PMID: 36382957 Free PMC article.
-
Crosstalk Between Inflammatory Signaling and Methylation in Cancer.Front Cell Dev Biol. 2021 Nov 24;9:756458. doi: 10.3389/fcell.2021.756458. eCollection 2021. Front Cell Dev Biol. 2021. PMID: 34901003 Free PMC article. Review.
-
Multi-Omics Integration in a Twin Cohort and Predictive Modeling of Blood Pressure Values.OMICS. 2022 Mar;26(3):130-141. doi: 10.1089/omi.2021.0201. OMICS. 2022. PMID: 35259029 Free PMC article.
-
An epigenome-wide study of selenium status and DNA methylation in the Strong Heart Study.Environ Int. 2024 Sep;191:108955. doi: 10.1016/j.envint.2024.108955. Epub 2024 Aug 14. Environ Int. 2024. PMID: 39154409 Free PMC article.
References
Publication types
MeSH terms
Grants and funding
- 75N92019D00028/HL/NHLBI NIH HHS/United States
- R01 ES021367/ES/NIEHS NIH HHS/United States
- P42 ES010349/ES/NIEHS NIH HHS/United States
- R01 ES025216/ES/NIEHS NIH HHS/United States
- R01 HL109282/HL/NHLBI NIH HHS/United States
- R01 HL109315/HL/NHLBI NIH HHS/United States
- R01 HL109284/HL/NHLBI NIH HHS/United States
- 75N92019D00030/HL/NHLBI NIH HHS/United States
- R01 HL090863/HL/NHLBI NIH HHS/United States
- 75N92019D00027/HL/NHLBI NIH HHS/United States
- R01 HL109301/HL/NHLBI NIH HHS/United States
- P30 ES009089/ES/NIEHS NIH HHS/United States
- R01 HL109319/HL/NHLBI NIH HHS/United States
- 75N92019D00029/HL/NHLBI NIH HHS/United States
LinkOut - more resources
Full Text Sources
Other Literature Sources
Medical
