. 2021 Feb 25;12(1):150.
doi: 10.1186/s13287-021-02224-w.

Melatonin promotes bone marrow mesenchymal stem cell osteogenic differentiation and prevents osteoporosis development through modulating circ_0003865 that sponges miR-3653-3p

Affiliations

Melatonin promotes bone marrow mesenchymal stem cell osteogenic differentiation and prevents osteoporosis development through modulating circ_0003865 that sponges miR-3653-3p

Xudong Wang et al. Stem Cell Res Ther. .

Abstract

Background: Little is known about the implications of circRNAs in the effects of melatonin (MEL) on bone marrow mesenchymal stem cell (BMSC) osteogenic differentiation and osteoporosis (OP) progression. The aim of our study was to investigate circRNAs in MEL-regulated BMSC differentiation and OP progression.

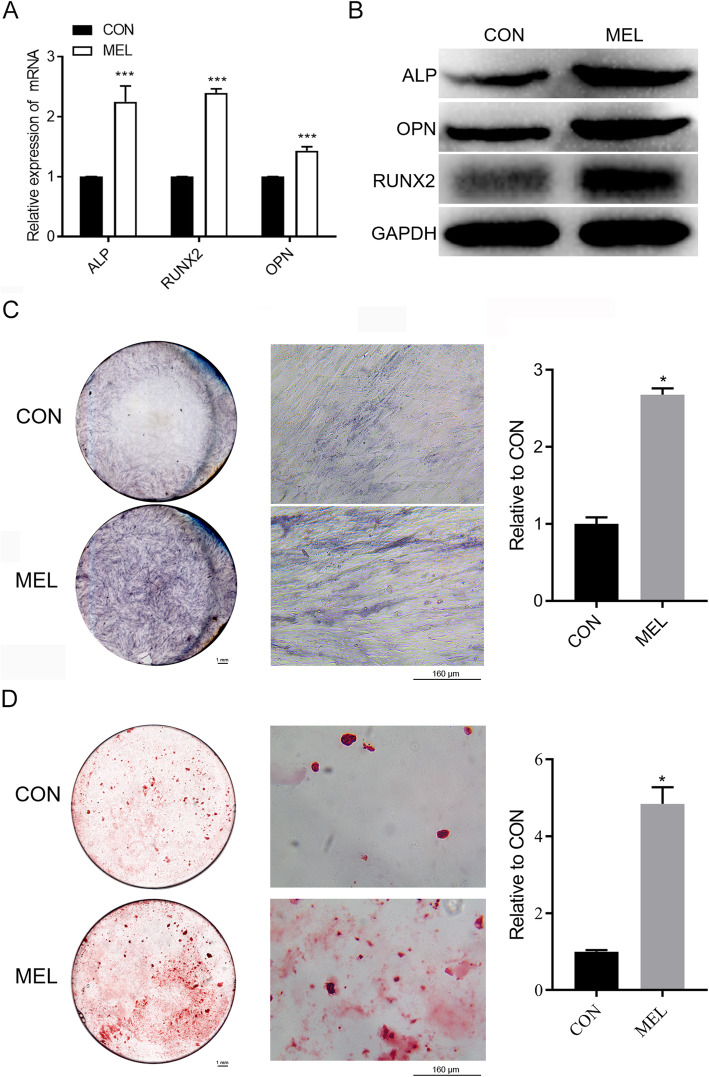
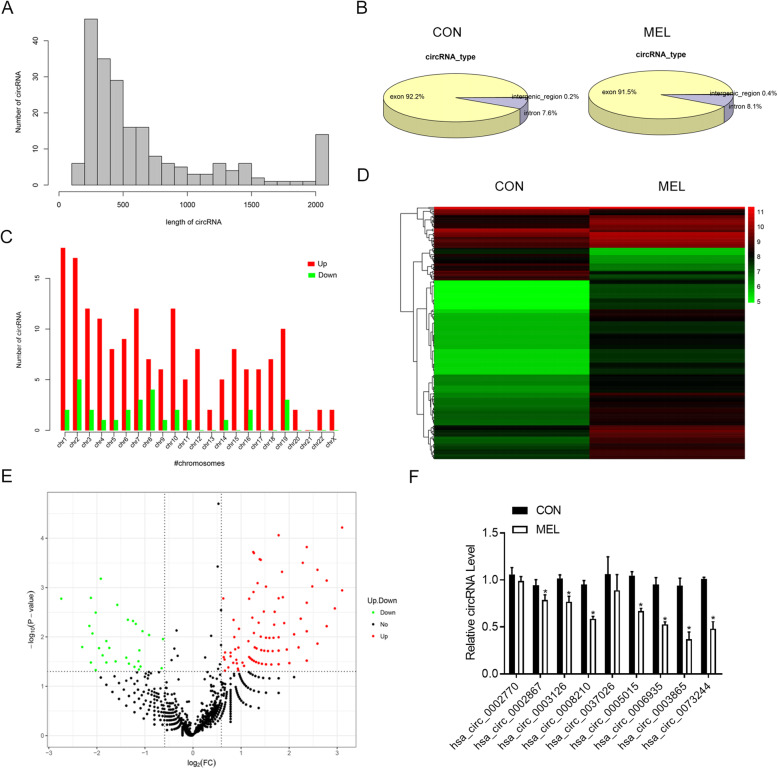
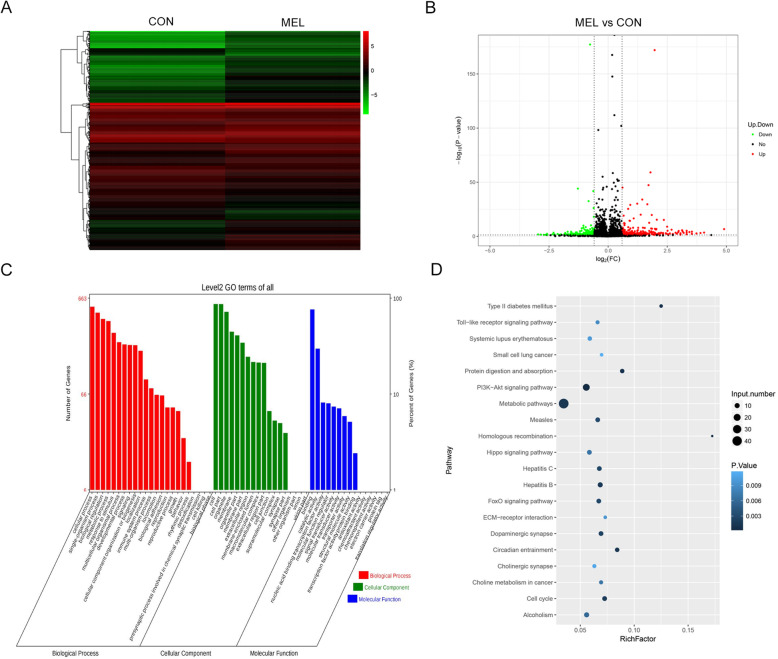
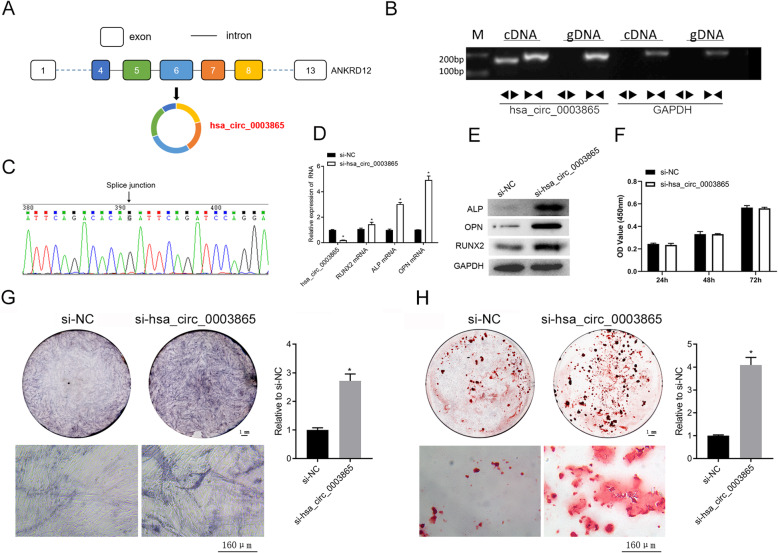
Methods: BMSC osteogenic differentiation was measured by qRT-PCR, western blot (WB), Alizarin Red, and alkaline phosphatase (ALP) staining. Differential circRNA and mRNA profiles of BMSCs treated by MEL were characterized by deep sequencing, followed by validation using RT-PCR, Sanger sequencing, and qRT-PCR. Silencing and overexpression of circ_0003865 were conducted for functional investigations. The sponged microRNAs and targeted mRNAs were predicted by bioinformatics and validated by qRT-PCR, RNA pull-down, and dual-luciferase reporter assay. The function of miR-3653-3p and circ_0003865/miR-3653-3p/growth arrest-specific gene 1 (GAS1) cascade was validated for the osteogenic differentiation of BMSCs by CCK-8, qRT-PCR, WB, Alizarin Red, and ALP staining. The effects of circ_0003865 on OP development were tested in murine OP model.

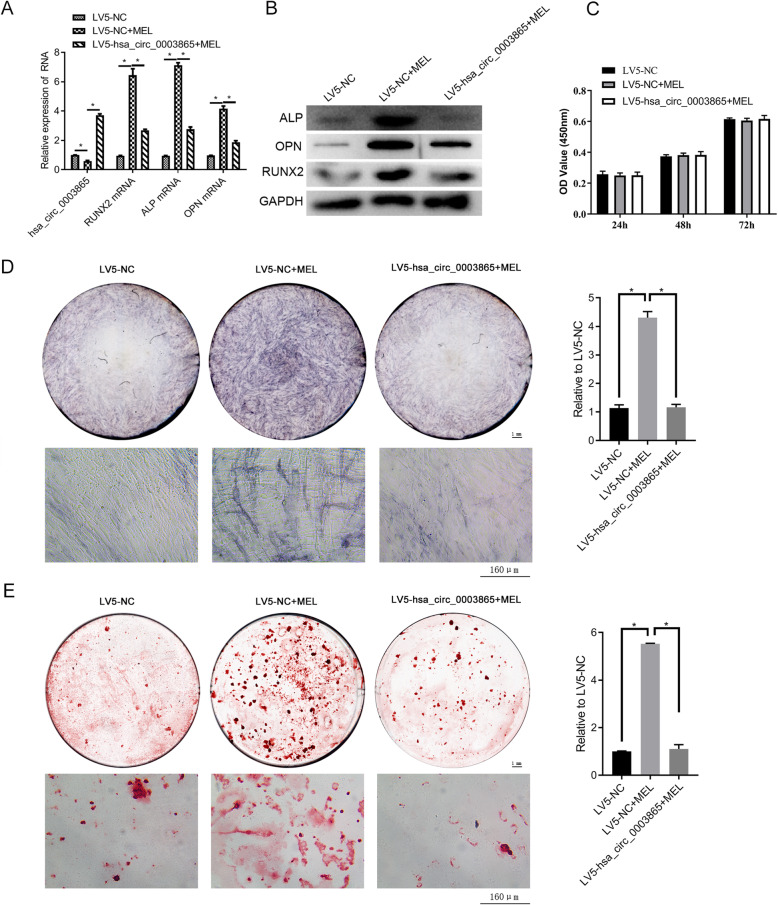
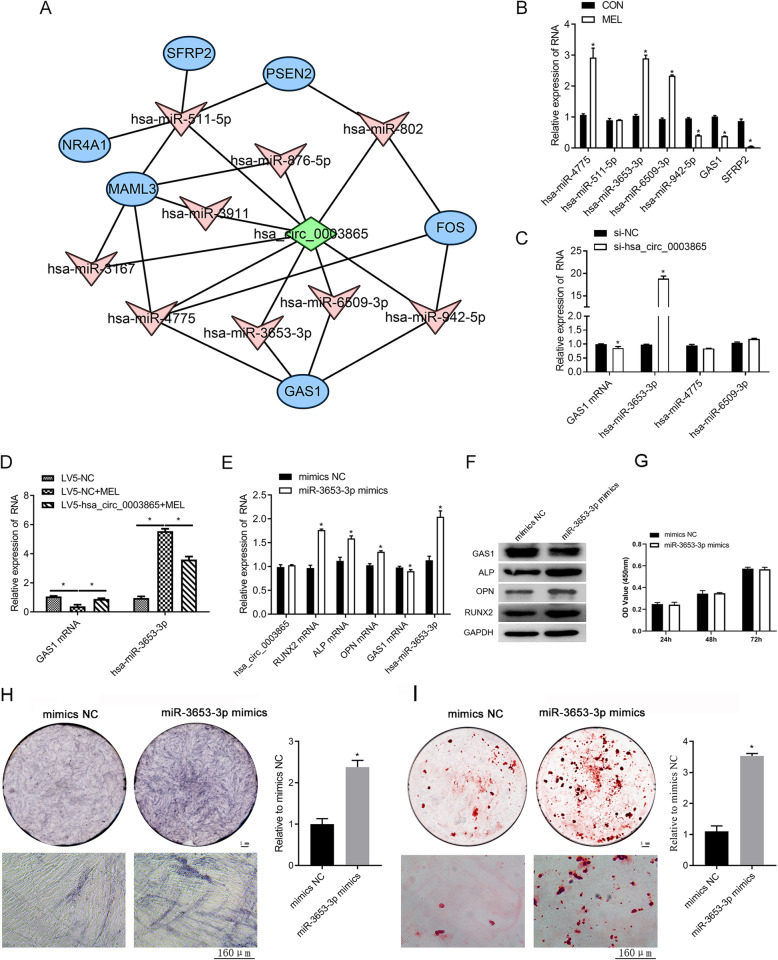
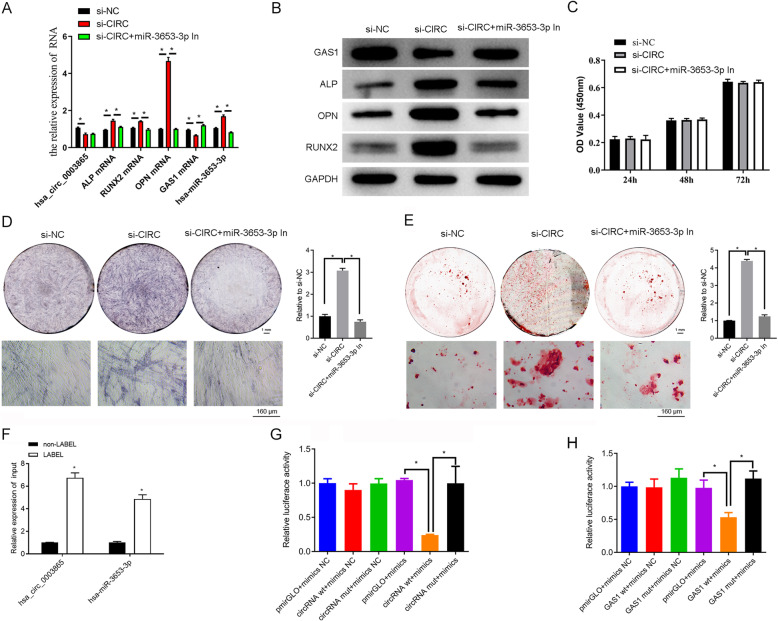
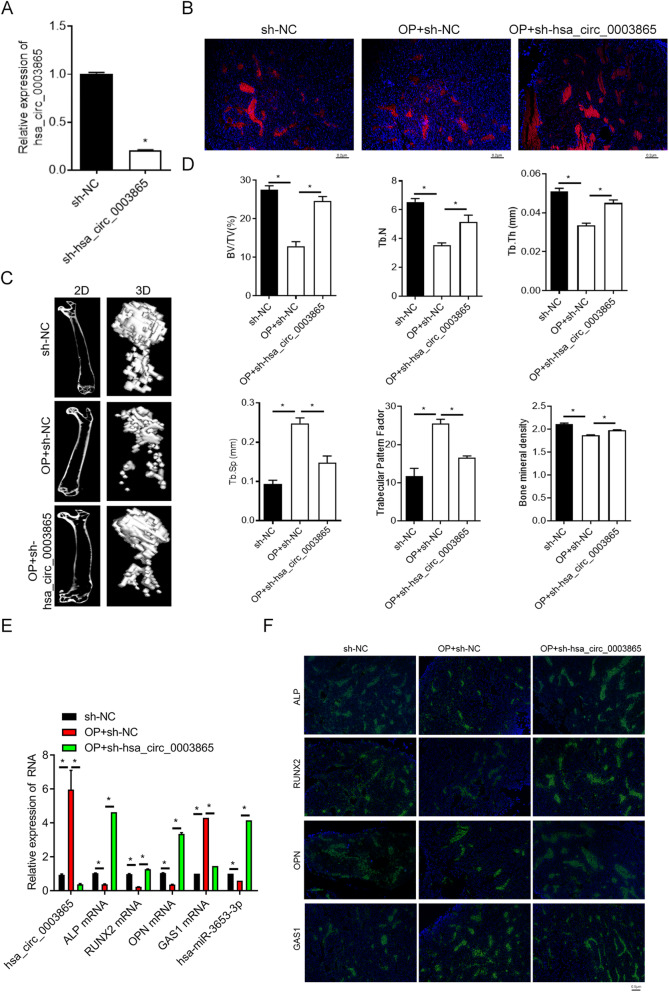
Results: MEL promoted osteogenic differentiation of BMSCs. RNA sequencing revealed significant alterations in circRNA and mRNA profiles associated with multiple biological processes and signaling pathways. Circ_0003865 expression in BMSCs was significantly decreased by MEL treatment. Silencing of circ_0003865 had no effect on proliferation while promoted osteogenic differentiation of BMSCs. Overexpression of circ_0003865 abrogated the promotion of BMSC osteogenic differentiation induced by MEL, but proliferation of BMSCs induced by MEL had no change whether circ_0003865 was overexpression or not. Furthermore, circ_0003865 sponged miR-3653-3p to promote GAS1 expression in BMSCs. BMSC osteogenic differentiation was enhanced by miR-3653-3p overexpression while BMSC proliferation was not affected. By contrast, miR-3653-3p silencing mitigated the promoted BMSC osteogenic differentiation caused by circ_0003865 silencing, but had no effect on proliferation. Finally, circ_0003865 silencing repressed OP development in mouse model.

Conclusion: MEL promotes BMSC osteogenic differentiation and inhibits OP pathogenesis by suppressing the expression of circ_0003865, which regulates GAS1 gene expression via sponging miR-3653-3p.

Keywords: BMSCs; Melatonin; Osteogenic differentiation; Osteoporosis; circ_0003865; miR-3653-3p.


Conflict of interest statement

The authors declare that they have no competing interests.

Figures

Fig. 1
Fig. 1
Enhanced osteogenic differentiation of BMSCs by MEL treatment. a Relative mRNA levels of osteogenic marker genes in human BMSCs treated with MEL. The ALP, RUNX2, and OPN mRNA levels in BMSCs were measured by qRT-PCR. b ALP, RUNX2, and OPN protein levels in human BMSCs treated with MEL. Western blot analysis was used to detect protein levels using GAPDH as the internal standard. c Elevated ALP expression in human BMSCs caused by MEL treatment. ALP expression in BMSCs was measured by the ALP staining method. Left are gross scanning images (scale bar: 1 mm), the middle are enlarged images (magnification: × 250, scale bar: 160 μm), and the right is quantification of the left gross scanning images. d MEL promotes osteogenic differentiation of human BMSCs. The osteogenic differentiation of BMSCs was evaluated by Alizarin Red staining. Left are gross scanning images (scale bar: 1 mm), the middle are enlarged images (magnification: × 250, scale bar: 160 μm), and the right is quantification of the left gross scanning images. CON: control; MEL: melatonin; ALP: alkaline phosphatase; RUNX2: runt-related transcription factor 2; OPN: osteopontin; GAPDH: glyceraldehyde-3-phosphate dehydrogenase; BMSCs: bone marrow mesenchymal stem cells; *P < 0.05, ***P < 0.001
Fig. 2
Fig. 2
Differential circRNA profiles in MEL-treated human BMSCs. a The length distribution of circRNAs identified in human BMSCs treated with MEL. Expression of circRNA profiles in BMSCs was analyzed by deep RNA sequencing. b The genomic distribution of circRNAs identified in human BMSCs treated with MEL based on gene exon, intron, and intergenic regions. c The numbers of circRNAs encoded by each human chromosome in BMSCs. Upregulated and downregulated circRNAs by MEL treatment are shown in red and green, respectively. d Hierarchical clustering of differentially expressed circRNAs in human BMSCs induced by MEL treatment. Differentially expressed circRNAs were defined by a fold change of > 1.5 and a P value of < 0.05. The increase and decrease of circRNAs are indicated by red and green colors, respectively. e A volcano plot showing the differential expression of circRNAs in BMSCs treated with MEL. Upregulated and downregulated circRNAs are indicated by red and green spots, respectively. Black spots represent CircRNAs with no significant alterations. f Relative expressional levels of nine representative differential circRNAs detected by RNA sequencing. The expression of circRNAs was evaluated by qRT-PCR. CON: control; MEL: melatonin; BMSCs: bone marrow mesenchymal stem cells; *P < 0.05
Fig. 3
Fig. 3
Differential mRNA profiles caused by MEL in human BMSCs. a Hierarchical clustering of differentially expressed mRNAs in MEL-treated human BMSCs. Differentially mRNA expression was defined by a fold change of > 1.5 and a P value of < 0.05. Red and green colors, respectively, show the increase and decrease of mRNAs. b A volcano plot presenting the differentially expressed mRNAs in BMSCs induced by MEL treatment. Upregulated and downregulated mRNAs were represented by red and green spots, respectively. The mRNAs showing no significant expression changes are indicated by black spots. c Functional categorization of differentially expressed mRNAs in MEL-treated human BMSCs. The enrichment of differentially expressed mRNAs in biological processes, cellular components, and molecular functions was analyzed by the GO method. d Significant enrichment of MEL-induced differentially expressed mRNAs in KEGG signaling pathways. The number of mRNAs in each pathway and the significance of enrichment are indicated by the circle diameters and blue colors, respectively. CON: control; MEL: melatonin; GO: gene ontology; KEGG: Kyoto Encyclopedia of Genes and Genomes
Fig. 4
Fig. 4
Activation of BMSC osteogenic differentiation by circ_0003865 knockdown. a A schematic illustration of circ_0003865 formation from the back-splicing of ANKRD12 gene pre-mRNA. Exons 4–8 of the ANKRD12 gene contributed to the formation of circ_0003865. b Detection of circ_0003865 formation in human BMSCs by RT-PCR. The existence of circ_0003865 in human BMSCs was validated by RT-PCR using a divergent primer pair in combination with cDNA samples as the template. Opposite-directed primers and gDNA were used as negative controls. c Characterization of the splice junction of circ_0003865 in human BMSCs by Sanger DNA sequencing. The samples amplified by RT-PCR using divergent primers were subjected to Sanger DNA sequencing. d Relative expression of circ_0003865 and osteogenic differentiation marker genes in BMSCs transfected with circ_0003865 siRNAs. qRT-PCR was performed to detect circRNA and mRNA expression in BMSCs. e ALP, RUNX2, and OPN protein levels in BMSCs transfected with circ_0003865 siRNAs. Protein levels were determined by western blot analysis using GAPDH as the internal standard. f No significant change of proliferation in human BMSCs by circ_0003865 knockdown. The CCK-8 assay was used to detect the proliferation in BMSCs. g Increased ALP expression in human BMSCs by circ_0003865 knockdown. The ALP staining method was used to measure in BMSCs. The top left are gross scanning images (scale bar: 1 mm), the lower left are enlarged images (magnification: 250×, scale bar: 160 μm), and the right is quantification of the left gross scanning images. h The enhanced osteogenic differentiation of human BMSCs by circ_0003865 knockdown. The osteogenic differentiation of human BMSCs was evaluated using the Alizarin Red staining method. The top left are gross scanning images (scale bar: 1 mm), the lower left are enlarged images (magnification: × 250, scale bar: 160 μm), and the right is quantification of the left gross scanning images. si-NC: negative control siRNA; si-hsa_circ_0003865: circ_0003865 siRNA; M: marker; gDNA: genomic DNA; CCK-8: cell counting kit-8; ALP: alkaline phosphatase; RUNX2: runt-related transcription factor 2; OPN: osteopontin; GAPDH: glyceraldehyde-3-phosphate dehydrogenase; *P < 0.05
Fig. 5
Fig. 5
Abrogation of MEL promotes BMSC osteogenic differentiation by circ_0003865 overexpression. a Relative expression of circ_0003865 and three osteogenesis marker genes in BMSCs. qRT-PCR was used to measure circRNA and mRNA levels in BMSCs. b The relative abundance of ALP, RUNX2, and OPN proteins in BMSCs. Osteogenesis marker protein abundances were determined by western blot analysis with GAPDH as the internal standard. c No significant change of proliferation in human BMSCs treated with MEL by circ_0003865 overexpression. CCK-8 assay was used to detect the proliferation. d Suppression of ALP expression in human BMSCs treated with MEL by circ_0003865 overexpression. ALP expression in BMSCs was detected by ALP staining. The top left are gross scanning images (scale bar: 1 mm), the lower left are enlarged images (magnification: × 250, scale bar: 160 μm), and the right is quantification of the left gross scanning images. e Inhibition of osteogenic differentiation of human BMSCs under MEL treatment by circ_0003865 overexpression. The Alizarin Red staining method was done to detect BMSC osteogenic differentiation. The top left are gross scanning images (scale bar: 1 mm), the lower left are enlarged images (magnification: × 250, scale bar: 160 μm), and the right is quantification of the left gross scanning images. MEL: melatonin; CCK-8: cell counting kit-8; ALP: alkaline phosphatase; RUNX2: runt-related transcription factor 2; OPN: osteopontin; GAPDH: glyceraldehyde-3-phosphate dehydrogenase; *P < 0.05
Fig. 6
Fig. 6
Inhibition of miR-3653-3p expression by circ_0003865 and the effects of miR-3653-3p on GAS1 expression and BMSC osteogenic differentiation. a The interaction networks between circ_0003865 with microRNAs and target genes. The microRNAs and target genes were predicted to interact with circ_0003865 using the miRanda database. b Relative expression of representative microRNAs and target genes in BMSCs treated with MEL. The expression of microRNAs and mRNAs were detected by qRT-PCR. c Elevated miR-3653-3p and decreased GAS1 expression in human BMSCs by circ_0003865 knockdown. Relative expression of microRNAs and GAS1 was measured by qRT-PCR. d circ_0003865 abrogates the suppression of GAS1 expression and elevates miR-3653-3p expression in BMSCs caused by MEL treatment. Relative expression of microRNAs and GAS1 was measured by qRT-PCR. e Influence of miR-3653-3p overexpression on circ_0003865, GAS1, and osteogenic biomarker gene expression in human BMSCs. Relative expression was evaluated by qRT-PCR. f ALP, RUNX2, OPN, and GAS1 protein levels in human BMSCs transfected with miR-3653-3p mimics. Western blot analysis was conducted to measure the protein levels in BMSCs. g Proliferation in human BMSCs transfected with miR-3653-3p mimics was detected by CCK-8 assay. h In situ expression of ALP in human BMSCs transfected with miR-3653-3p mimics was detected by ALP staining. The top left are gross scanning images (scale bar: 1 mm), the lower left are enlarged images (magnification: × 250, scale bar: 160 μm), and the right is quantification of the left gross scanning images. i The enhancement of osteogenic differentiation of human BMSCs by miR-3653-3p mimics. Alizarin Red staining was conducted to evaluate the osteogenic differentiation of human BMSCs. The top left are gross scanning images (scale bar: 1 mm), the lower left are enlarged images (magnification: × 250, scale bar: 160 μm), and the right is quantification of the left gross scanning image. MEL: melatonin; GAS1: growth arrest-specific gene 1; SFRP2: secreted frizzled-related protein 2; CCK-8: cell counting kit-8; ALP: alkaline phosphatase; RUNX2: runt-related transcription factor 2; OPN: osteopontin; NC: negative control; GAPDH: glyceraldehyde-3-phosphate dehydrogenase; *P < 0.05
Fig. 7
Fig. 7
miR-3653-3p reverses circ_0003865-regulated BMSC osteogenic differentiation by directly binding circ_0003865 and the GAS1 gene. a Relative expression of circ_0003865, miR-3653-3p, GAS1, and osteogenic marker genes in BMSCs as measured by qRT-PCR. b GAS1, ALP, RUNX2, and OPN protein levels in human BMSCs as quantitated by western blot analysis using GAPDH as the internal standard. c The proliferation in human BMSCs was tested by CCK-8 assay. d The expression of ALP in human BMSCs was analyzed by ALP staining. The top left are gross scanning images (scale bar: 1 mm), the lower left are enlarged images (magnification: 250×, scale bar: 160 μm), and the right is quantification of the left gross scanning images. e miR-3653-3p inhibitors repressed the osteogenic differentiation of human BMSCs transfected with circ_0003865 siRNAs compared with the si-CIRC group. The Alizarin Red staining was done to evaluate BMSC osteogenic differentiation. The top left are gross scanning images (scale bar: 1 mm), the lower left are enlarged images (magnification: × 250, scale bar: 160 μm), and the right is quantification of the left gross scanning images. f The association of circ_0003865 with miR-3653-3p as detected by an RNA pull-down assay. g, h The direct binding of miR-3653-3p with circ_0003865 and GAS1 gene as measured by the dual-luciferase reporter assay. Between miR-3653-3p and circ_0003865 (g). Between miR-3653-3p and GAS1 gene (h). si-CIRC: circ_0003865 siRNAs; miR-3653-3p In: miR-3653-3p inhibitors; GAS1: growth arrest-specific gene 1; CCK-8: cell counting kit-8; ALP: alkaline phosphatase; RUNX2: runt-related transcription factor 2; OPN: osteopontin; GAPDH: glyceraldehyde-3-phosphate dehydrogenase; NC: negative control; *P < 0.05
Fig. 8
Fig. 8
Silencing of circ_0003865 suppresses OP pathogenesis in a mouse model. a Decreased circ_0003865 expression in BMSCs caused by infection with adeno-associated virus (AAV) carrying sh-circ_0003865 sequences. Relative expression of circ_0003865 as measured by qRT-PCR. b Transfection of circ_0003865-silencing AAVs into bone tissues of the mouse OP model established by ovariectomy. The infection of AAVs in bone tissues was observed by immunofluorescence (magnification: × 200, scale bar: 0.5 μm). c Silencing of circ_0003865 restored the femur densities in the mice OP model. Femur densities were analyzed by micro-CT examination. d Bone microstructure parameters in the mouse OP model. The Siemens Preclinical Imaging System was used to detect BV/TV, Tb.N, Tb.Th, Tb.Sp, trabecular pattern factor, and bone mineral density of the mouse bones. e Relative expression of circ_0003865, miR-3653-3p, GAS1, ALP, RUNX2, and OPN mRNAs in bone tissues of the mouse OP model. qRT-PCR was used to measure relative expression. f Changes in GAS1, ALP, RUNX2, and OPN protein levels in bone tissues of the mouse OP model. In situ protein expression in mouse bone tissues as detected by immunofluorescence (magnification: × 200, scale bar: 0.5 μm) Sh-NC: negative control; OP: osteoporosis; BV/TV: bone volume/total volume; Tb.N: trabecular number; Tb.Th: trabecular thickness; Tb.Sp: trabecular separation; GAS1: growth arrest-specific gene 1; ALP: alkaline phosphatase; RUNX2: runt-related transcription factor 2; OPN: osteopontin; *P < 0.05

Similar articles

Cited by

References

    1. Hendrickx G, Boudin E, Van Hul W. A look behind the scenes: the risk and pathogenesis of primary osteoporosis. Nat Rev Rheumatol. 2015;11(8):462–474. doi: 10.1038/nrrheum.2015.48. - DOI - PubMed
    1. Raisz LG. Pathogenesis of osteoporosis: concepts, conflicts, and prospects. J Clin Invest. 2005;115(12):3318–3325. doi: 10.1172/JCI27071. - DOI - PMC - PubMed
    1. Manolagas SC. Birth and death of bone cells: basic regulatory mechanisms and implications for the pathogenesis and treatment of osteoporosis. Endocr Rev. 2000;21(1):115–137. - PubMed
    1. Rosen CJ, Klibanski A. Bone, fat, and body composition: evolving concepts in the pathogenesis of osteoporosis. Am J Med. 2009;122(5):409–414. doi: 10.1016/j.amjmed.2008.11.027. - DOI - PubMed
    1. Khosla S, Hofbauer LC. Osteoporosis treatment: recent developments and ongoing challenges. Lancet Diab Endo. 2017;5(11):898–907. doi: 10.1016/S2213-8587(17)30188-2. - DOI - PMC - PubMed

Publication types