

Magnetic resonance spectroscopy for the study of cns malignancies
- PMID: 33632416
- PMCID: PMC7910526
- DOI: 10.1016/j.pnmrs.2020.11.001
Magnetic resonance spectroscopy for the study of cns malignancies
Abstract
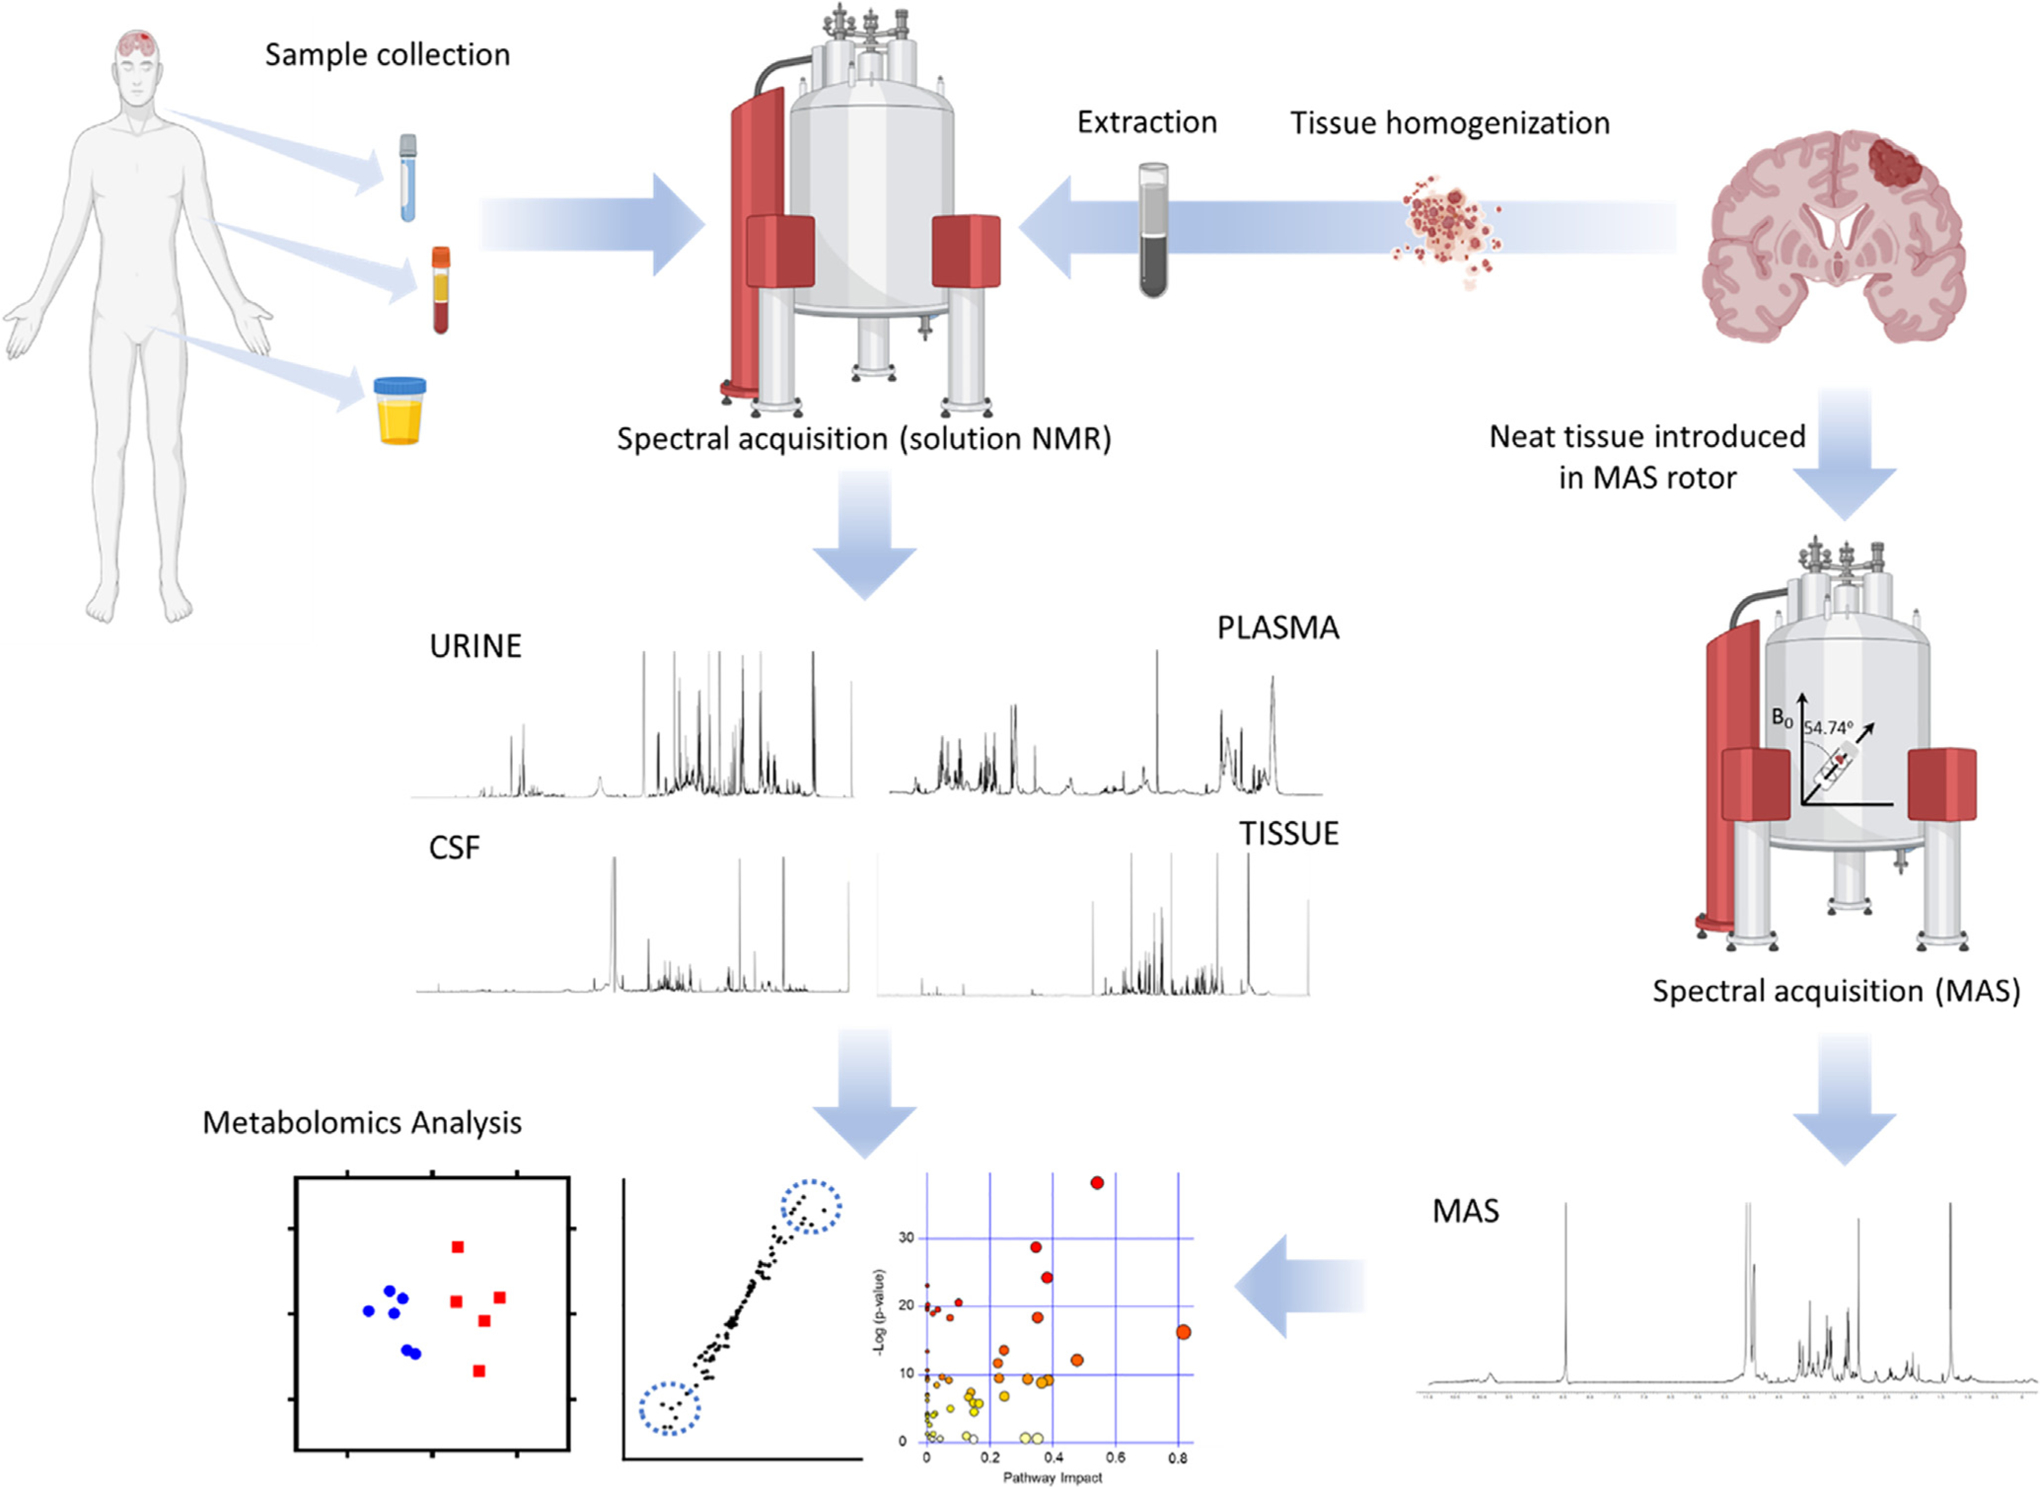
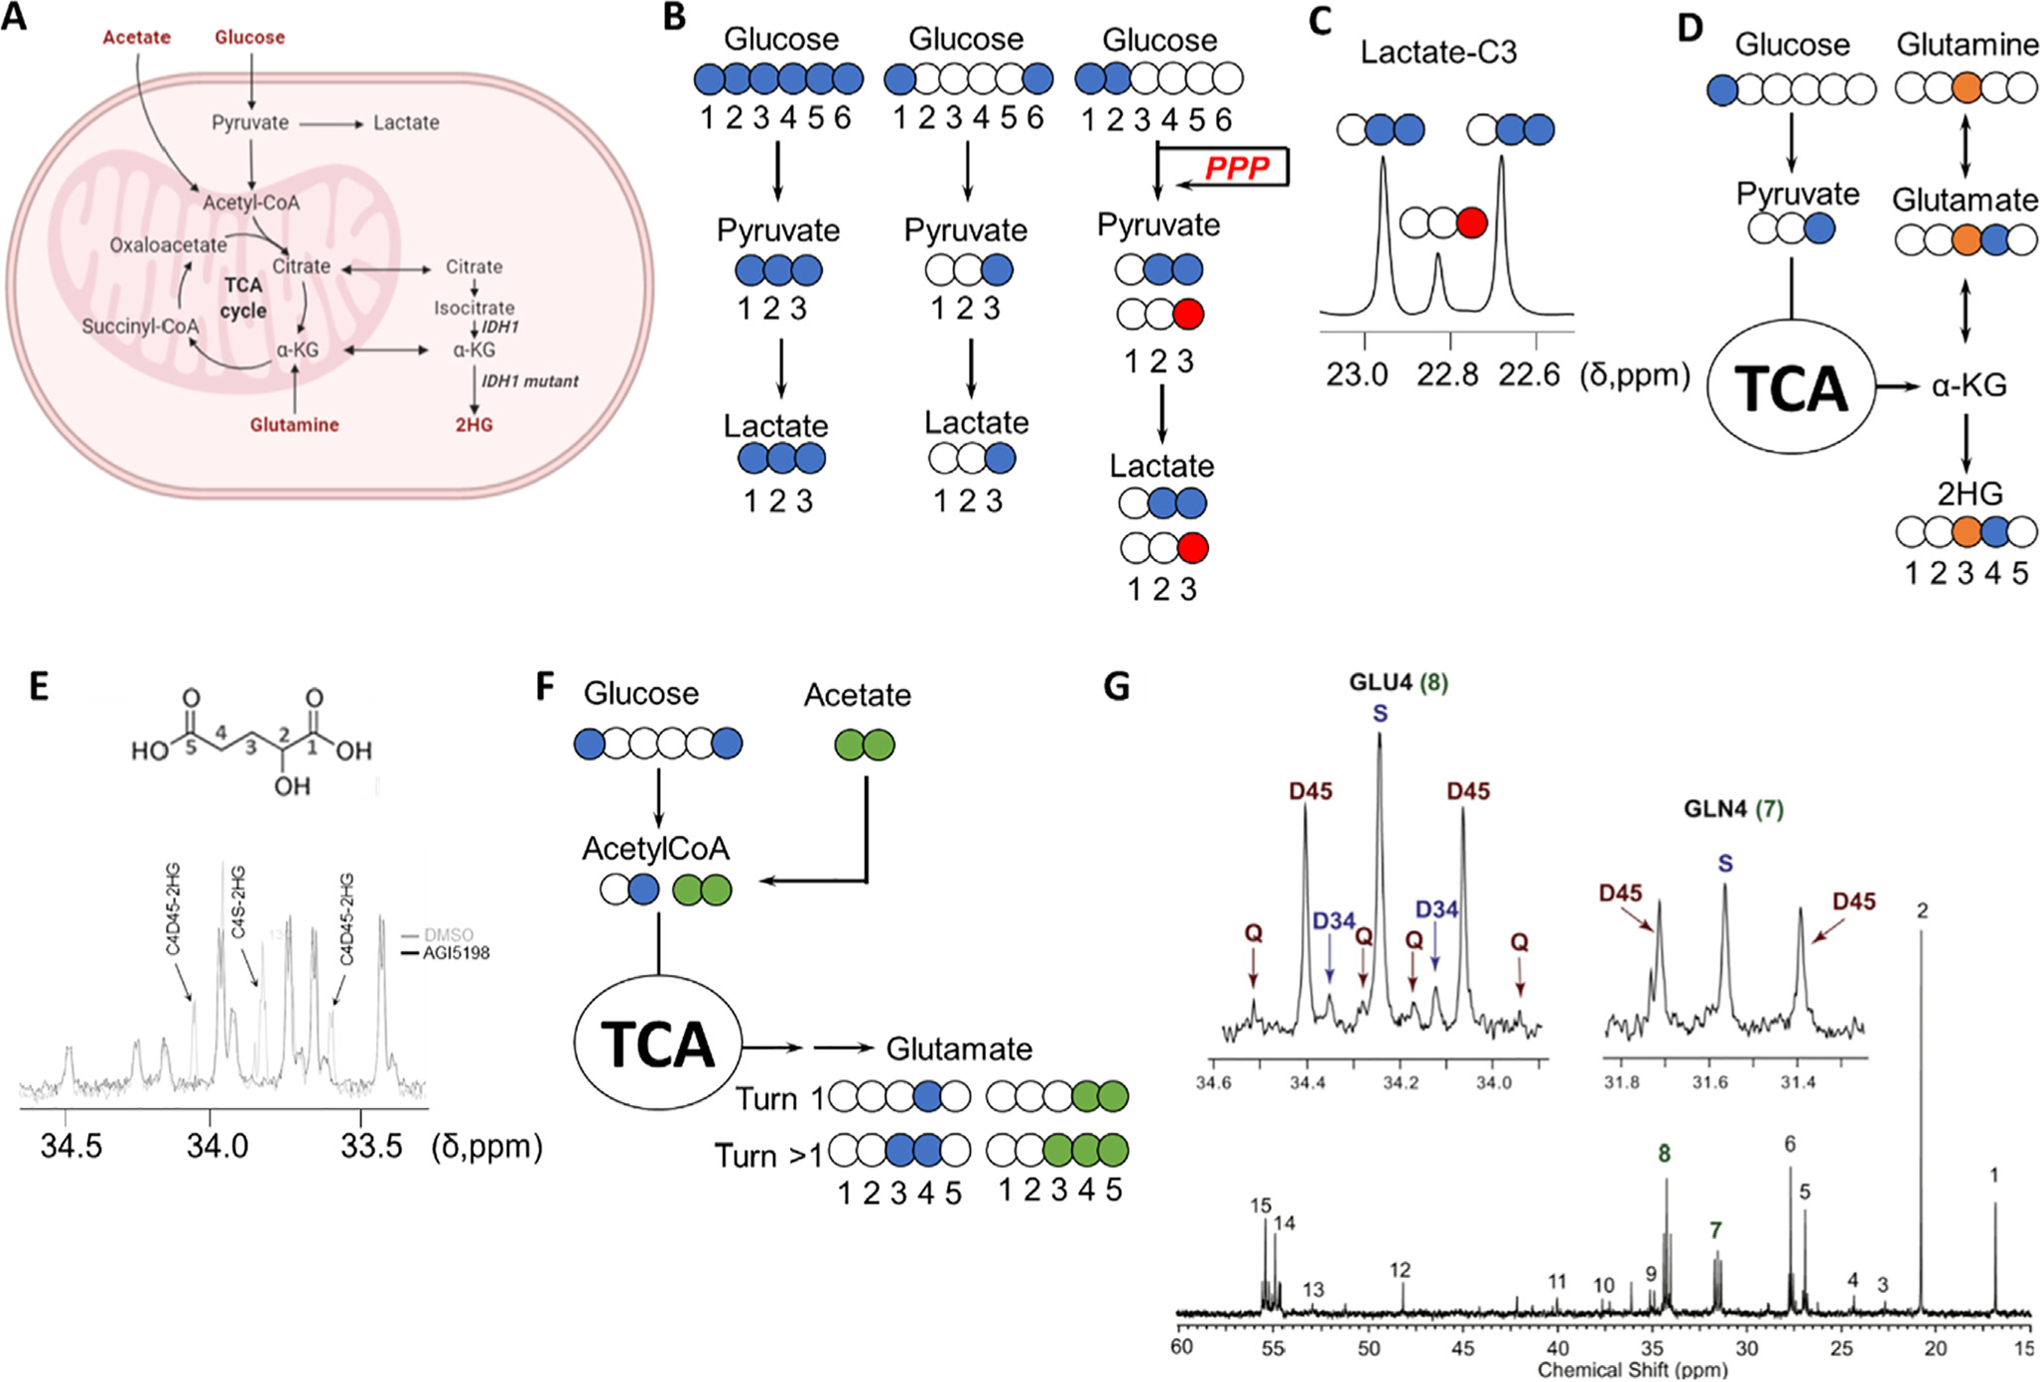
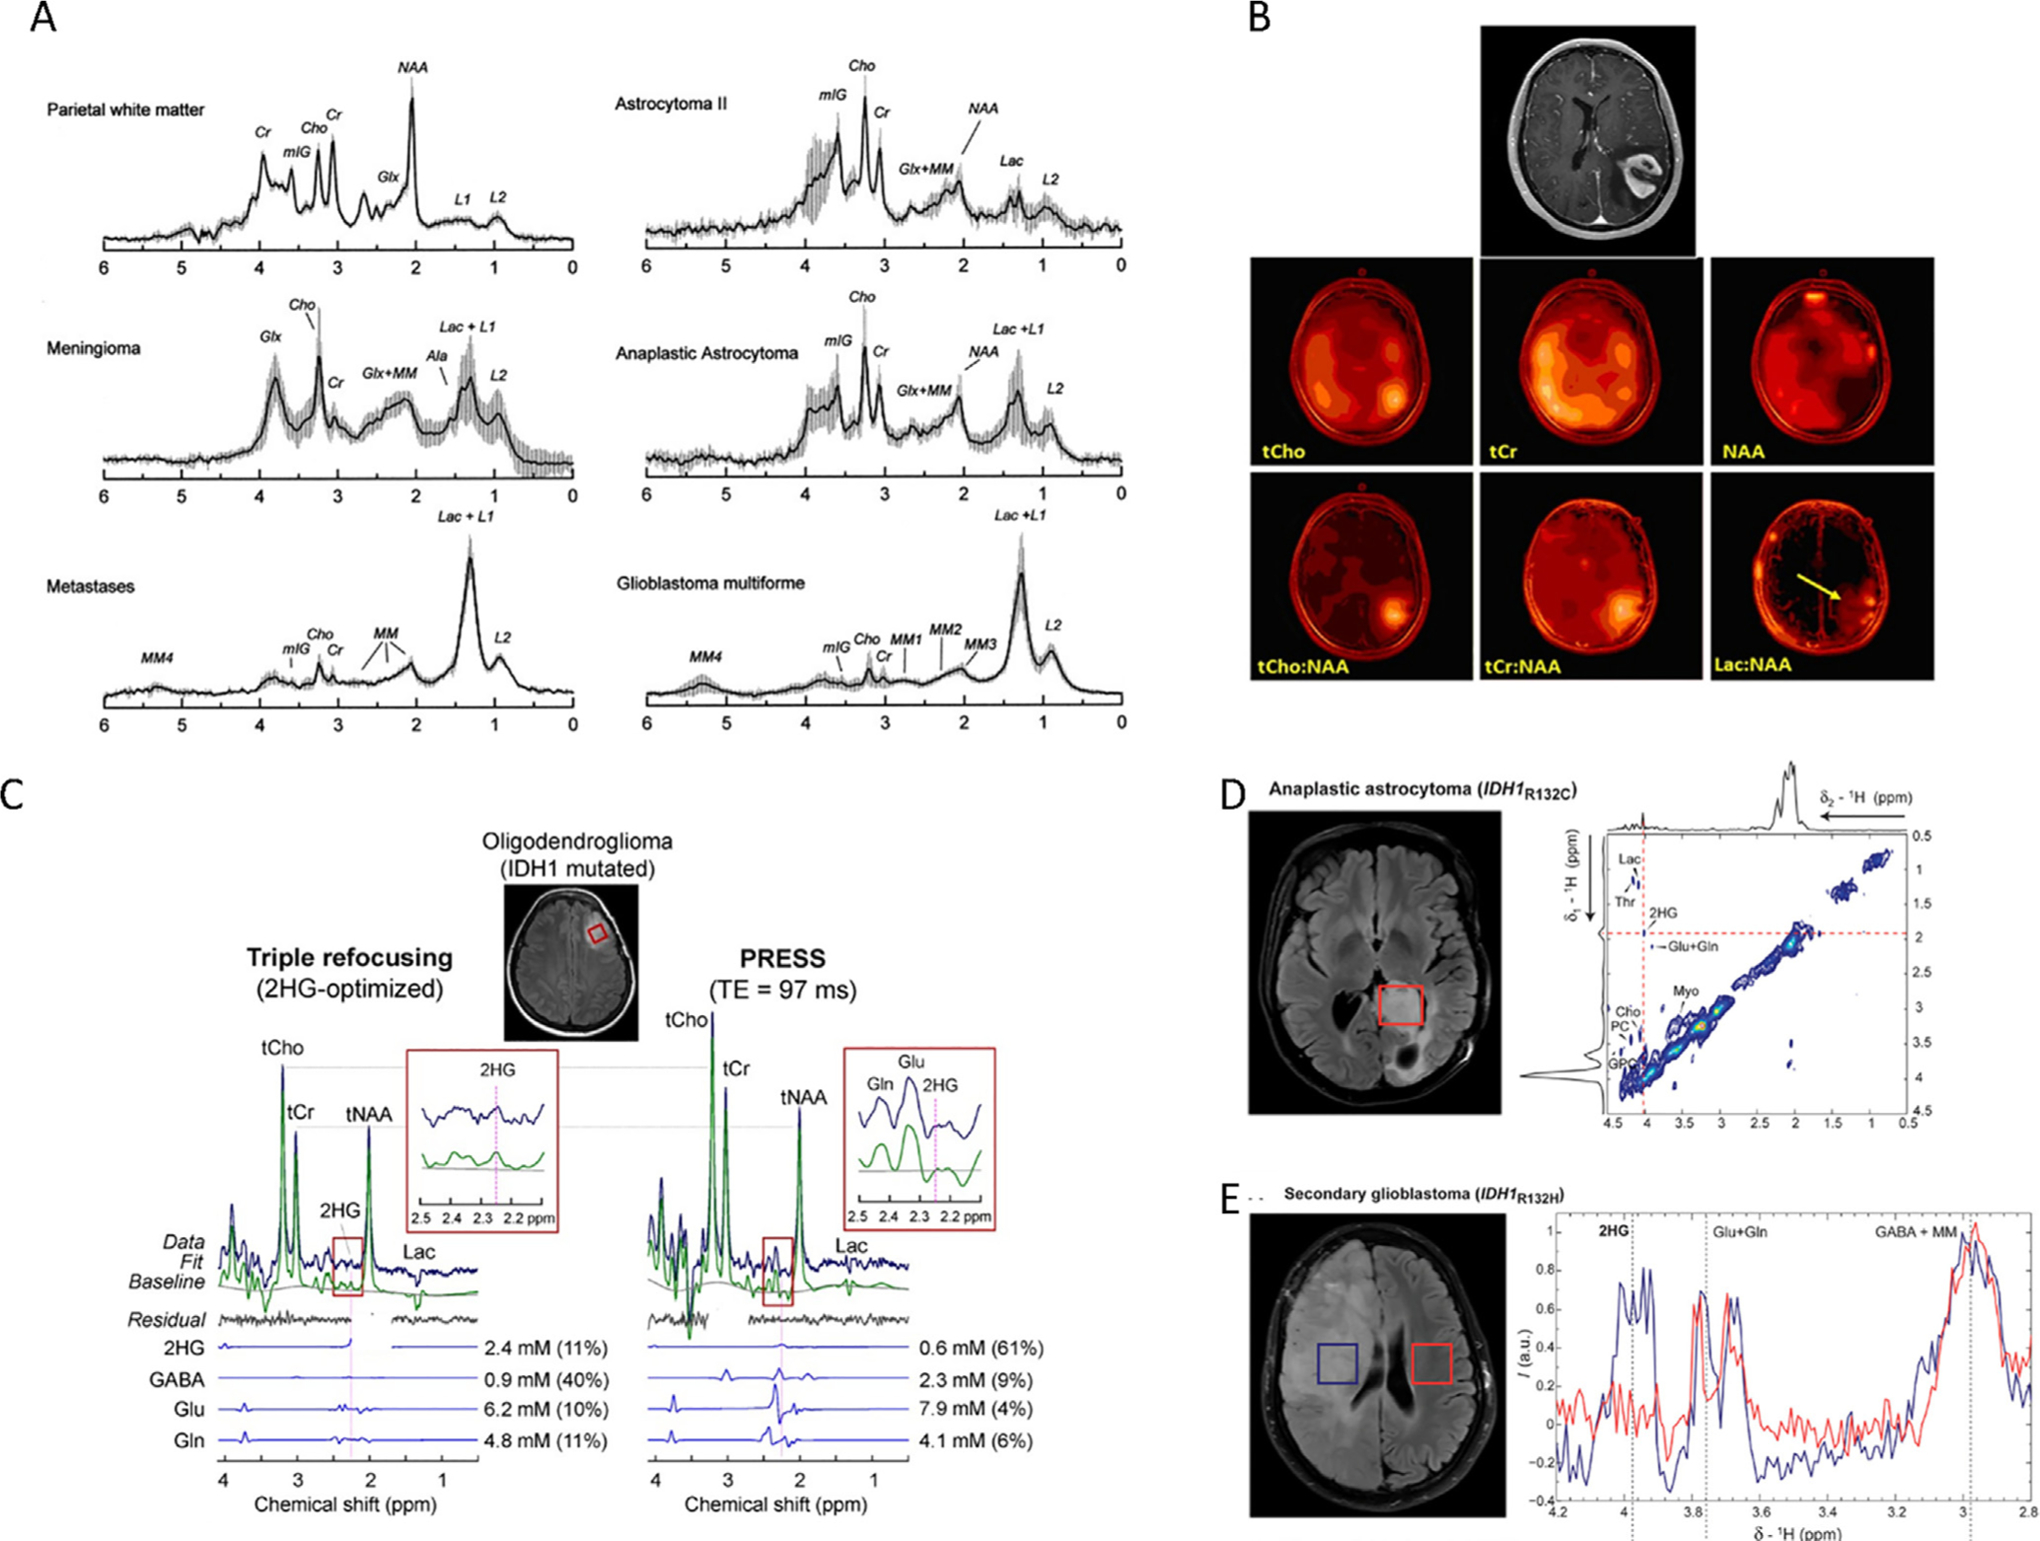
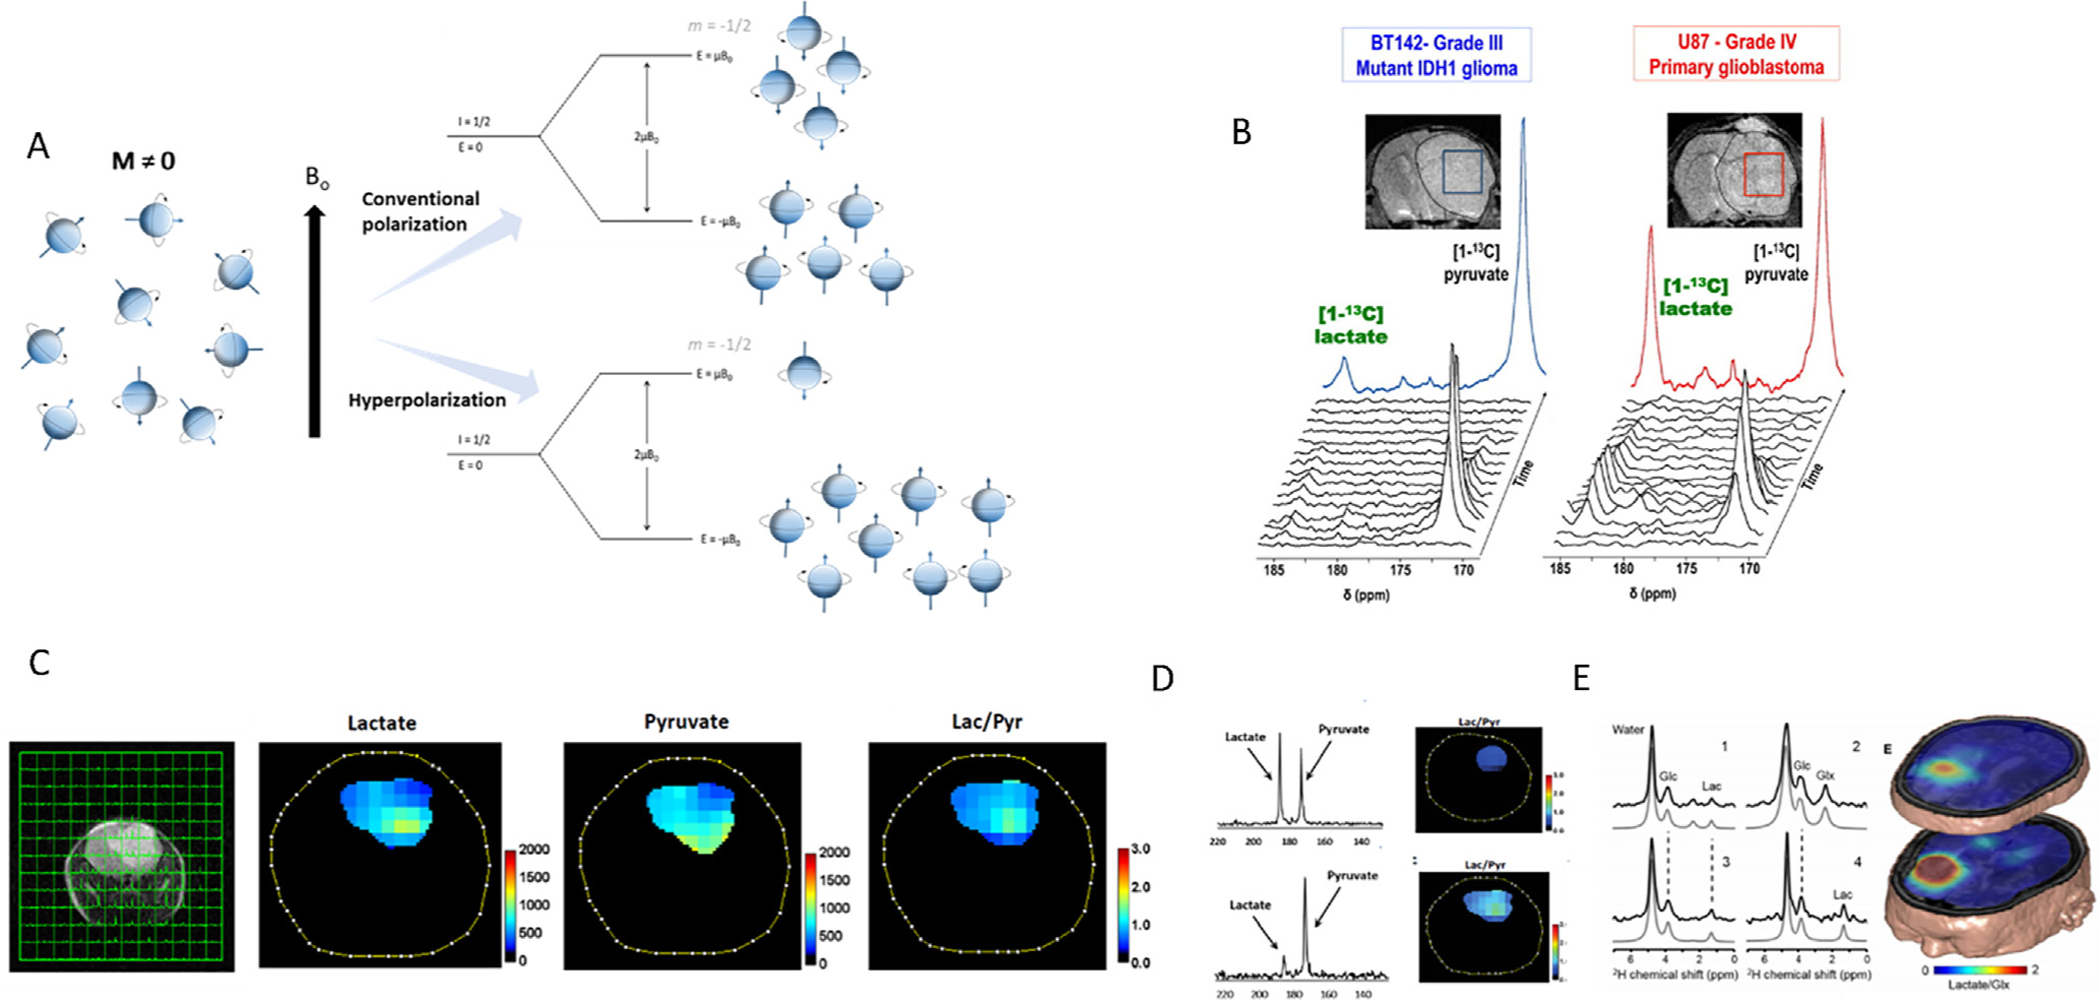
Despite intensive research, brain tumors are amongst the malignancies with the worst prognosis; therefore, a prompt diagnosis and thoughtful assessment of the disease is required. The resistance of brain tumors to most forms of conventional therapy has led researchers to explore the underlying biology in search of new vulnerabilities and biomarkers. The unique metabolism of brain tumors represents one potential vulnerability and the basis for a system of classification. Profiling this aberrant metabolism requires a method to accurately measure and report differences in metabolite concentrations. Magnetic resonance-based techniques provide a framework for examining tumor tissue and the evolution of disease. Nuclear Magnetic Resonance (NMR) analysis of biofluids collected from patients suffering from brain cancer can provide biological information about disease status. In particular, urine and plasma can serve to monitor the evolution of disease through the changes observed in the metabolic profiles. Moreover, cerebrospinal fluid can be utilized as a direct reporter of cerebral activity since it carries the chemicals exchanged with the brain tissue and the tumor mass. Metabolic reprogramming has recently been included as one of the hallmarks of cancer. Accordingly, the metabolic rewiring experienced by these tumors to sustain rapid growth and proliferation can also serve as a potential therapeutic target. The combination of 13C tracing approaches with the utilization of different NMR spectral modalities has allowed investigations of the upregulation of glycolysis in the aggressive forms of brain tumors, including glioblastomas, and the discovery of the utilization of acetate as an alternative cellular fuel in brain metastasis and gliomas. One of the major contributions of magnetic resonance to the assessment of brain tumors has been the non-invasive determination of 2-hydroxyglutarate (2HG) in tumors harboring a mutation in isocitrate dehydrogenase 1 (IDH1). The mutational status of this enzyme already serves as a key feature in the clinical classification of brain neoplasia in routine clinical practice and pilot studies have established the use of in vivo magnetic resonance spectroscopy (MRS) for monitoring disease progression and treatment response in IDH mutant gliomas. However, the development of bespoke methods for 2HG detection by MRS has been required, and this has prevented the wider implementation of MRS methodology into the clinic. One of the main challenges for improving the management of the disease is to obtain an accurate insight into the response to treatment, so that the patient can be promptly diverted into a new therapy if resistant or maintained on the original therapy if responsive. The implementation of 13C hyperpolarized magnetic resonance spectroscopic imaging (MRSI) has allowed detection of changes in tumor metabolism associated with a treatment, and as such has been revealed as a remarkable tool for monitoring response to therapeutic strategies. In summary, the application of magnetic resonance-based methodologies to the diagnosis and management of brain tumor patients, in addition to its utilization in the investigation of its tumor-associated metabolic rewiring, is helping to unravel the biological basis of malignancies of the central nervous system.
Keywords: (13)C-tracing; Brain tumors; Hyperpolarization; MRS; Metabolomics.
Published by Elsevier B.V.
Conflict of interest statement
Declaration of Competing Interest The authors declare that there is no conflict of interest.
Figures
Similar articles
-
Hyperpolarized (13)C MR imaging detects no lactate production in mutant IDH1 gliomas: Implications for diagnosis and response monitoring.Neuroimage Clin. 2016 Jun 23;12:180-9. doi: 10.1016/j.nicl.2016.06.018. eCollection 2016. Neuroimage Clin. 2016. PMID: 27437179 Free PMC article.
-
Noninvasive assessment of isocitrate dehydrogenase mutation status in cerebral gliomas by magnetic resonance spectroscopy in a clinical setting.J Neurosurg. 2018 Feb;128(2):391-398. doi: 10.3171/2016.10.JNS161793. Epub 2017 Mar 3. J Neurosurg. 2018. PMID: 28298040
-
2-Hydroxyglutarate magnetic resonance spectroscopy in adult brainstem glioma.J Neurosurg. 2023 Jan 27;139(2):355-362. doi: 10.3171/2022.12.JNS221954. Print 2023 Aug 1. J Neurosurg. 2023. PMID: 36708540
-
Translational Metabolomics of Head Injury: Exploring Dysfunctional Cerebral Metabolism with Ex Vivo NMR Spectroscopy-Based Metabolite Quantification.In: Kobeissy FH, editor. Brain Neurotrauma: Molecular, Neuropsychological, and Rehabilitation Aspects. Boca Raton (FL): CRC Press/Taylor & Francis; 2015. Chapter 25. In: Kobeissy FH, editor. Brain Neurotrauma: Molecular, Neuropsychological, and Rehabilitation Aspects. Boca Raton (FL): CRC Press/Taylor & Francis; 2015. Chapter 25. PMID: 26269925 Free Books & Documents. Review.
-
Magnetic resonance spectroscopy of isocitrate dehydrogenase mutated gliomas: current knowledge on the neurochemical profile.Curr Opin Neurol. 2020 Aug;33(4):413-421. doi: 10.1097/WCO.0000000000000833. Curr Opin Neurol. 2020. PMID: 32657882 Free PMC article. Review.
Cited by
-
Imaging telomerase reverse transcriptase expression in oligodendrogliomas using hyperpolarized δ-[1-13C]-gluconolactone.Neurooncol Adv. 2023 Jul 21;5(1):vdad092. doi: 10.1093/noajnl/vdad092. eCollection 2023 Jan-Dec. Neurooncol Adv. 2023. PMID: 37600229 Free PMC article.
-
NMR in the Age of Modern Biomedical Research and Drug Discovery.J Mol Biol. 2025 Jun 23:169302. doi: 10.1016/j.jmb.2025.169302. Online ahead of print. J Mol Biol. 2025. PMID: 40562354 Review.
-
Role of Magnetic Resonance Spectroscopy in Evaluating Choline Levels in Gallbladder Carcinoma: A Comprehensive Review.Cureus. 2024 Aug 5;16(8):e66205. doi: 10.7759/cureus.66205. eCollection 2024 Aug. Cureus. 2024. PMID: 39233932 Free PMC article. Review.
-
Impaired brain glucose metabolism in glucagon-like peptide-1 receptor knockout mice.Nutr Diabetes. 2024 Oct 10;14(1):86. doi: 10.1038/s41387-024-00343-w. Nutr Diabetes. 2024. PMID: 39389952 Free PMC article.
-
Epigenetic MRI: Noninvasive imaging of DNA methylation in the brain.Proc Natl Acad Sci U S A. 2022 Mar 8;119(10):e2119891119. doi: 10.1073/pnas.2119891119. Epub 2022 Mar 2. Proc Natl Acad Sci U S A. 2022. PMID: 35235458 Free PMC article.
References
-
- Louis DN, Perry A, Reifenberger G, von Deimling A, Figarella-Branger D, Cavenee WK, Ohgaki H, Wiestler OD, Kleihues P, Ellison DW, The 2016 World Health Organization Classification of Tumors of the Central Nervous System: a summary, Acta Neuropathol 131 (6) (2016) 803–820. - PubMed
-
- Louis DN, Ohgaki H, Wiestler OD, Cavenee WK, WHO Classification of Tumours of the Central Nervous System (revised 4th edition), World Health Organization, Lyon, 2016. - PubMed
-
- Barnholtz-Sloan JS, Sloan AE, Davis FG, Vigneau FD, Lai P, Sawaya RE, Incidence proportions of brain metastases in patients diagnosed (1973 to 2001) in the Metropolitan Detroit Cancer Surveillance System, J. Clin. Oncol 22 (14) (2004) 2865–2872. - PubMed
-
- National Comprehensive Cancer Network. Central nervous system cancers (version 1.2018) [https://www.nccn.org/professionals/physician_gls/pdf/cns.pdf]. - PubMed
Publication types
MeSH terms
Substances
LinkOut - more resources
Full Text Sources
Other Literature Sources
Medical
Miscellaneous
