

In vivo methods and applications of xenon-129 magnetic resonance
- PMID: 33632417
- PMCID: PMC7933823
- DOI: 10.1016/j.pnmrs.2020.11.002
In vivo methods and applications of xenon-129 magnetic resonance
Abstract
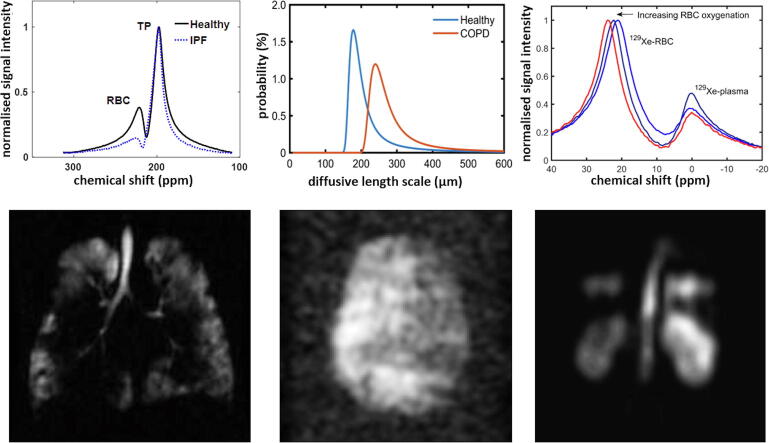
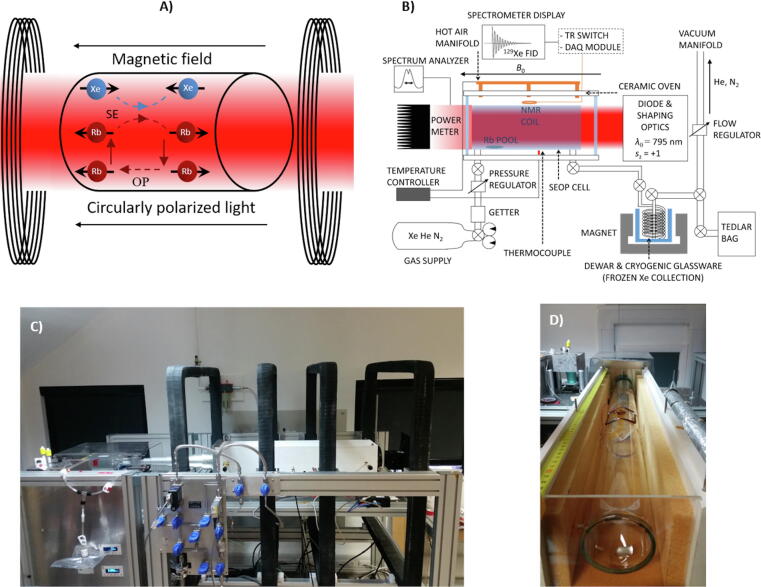
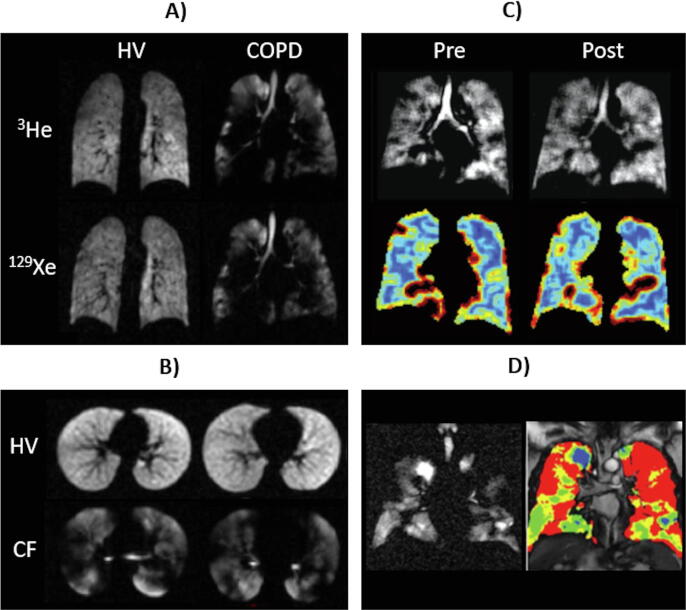
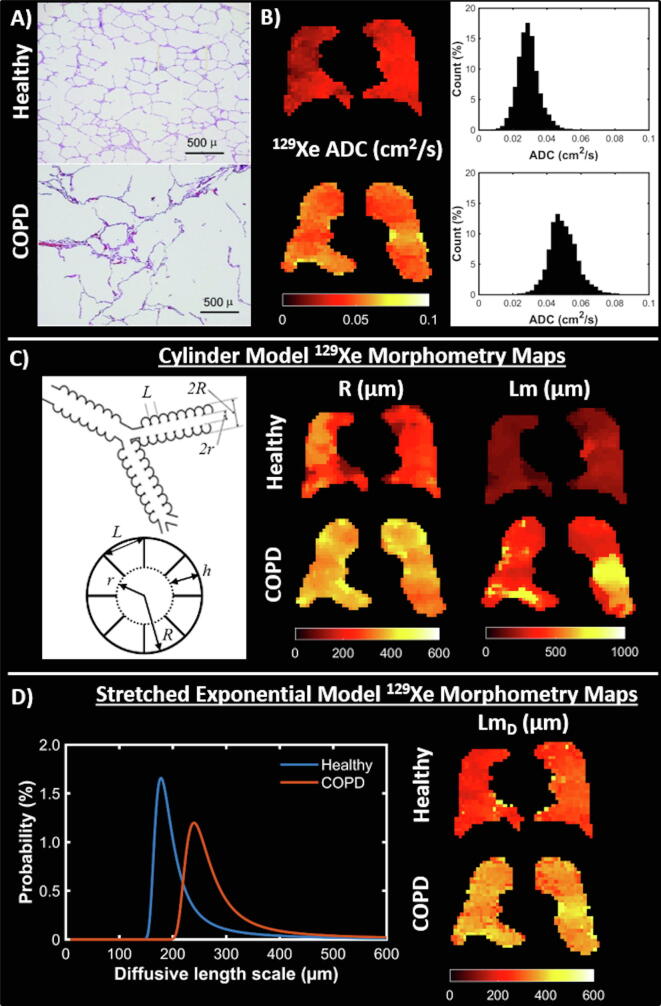
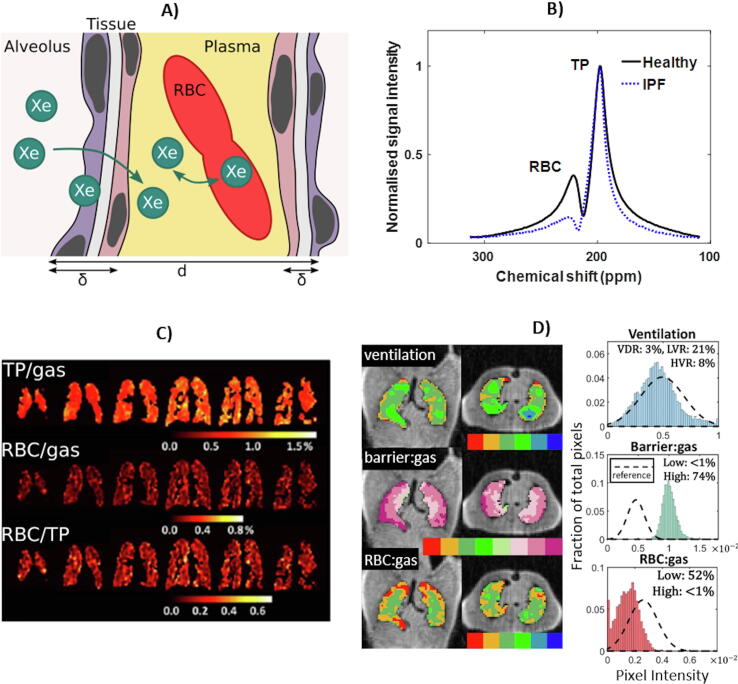
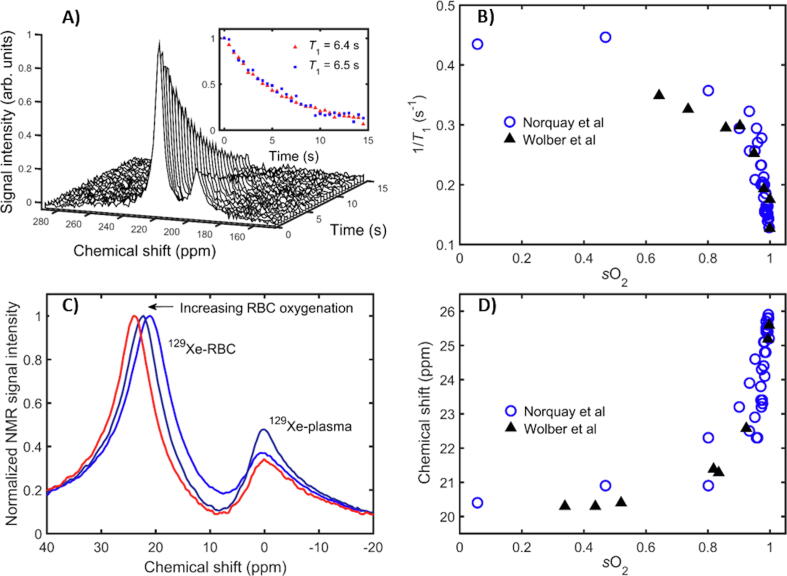
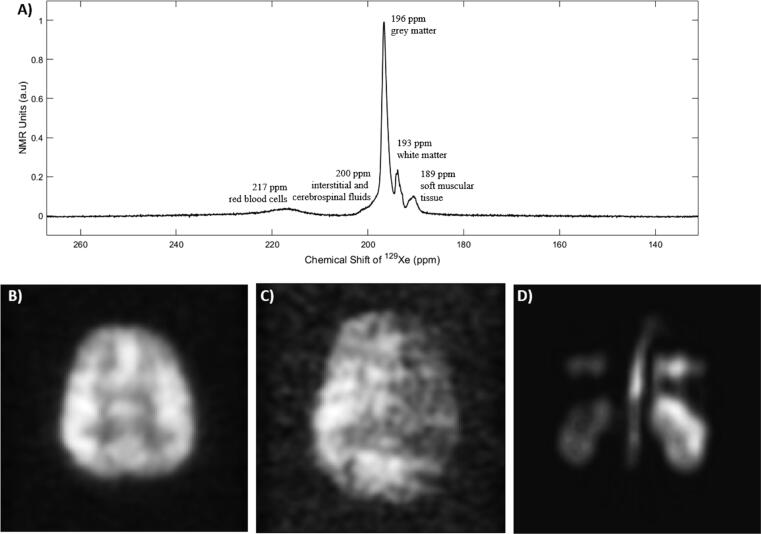
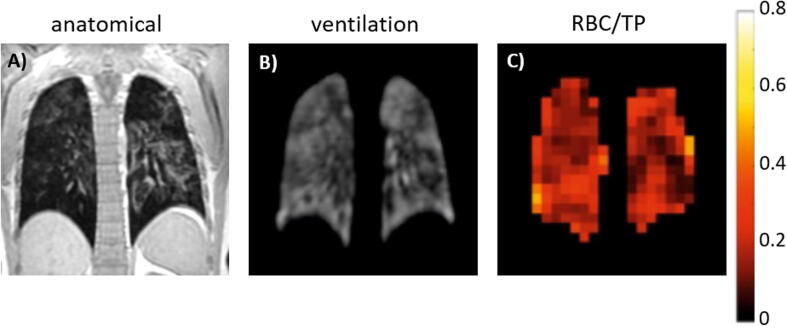
Hyperpolarised gas lung MRI using xenon-129 can provide detailed 3D images of the ventilated lung airspaces, and can be applied to quantify lung microstructure and detailed aspects of lung function such as gas exchange. It is sensitive to functional and structural changes in early lung disease and can be used in longitudinal studies of disease progression and therapy response. The ability of 129Xe to dissolve into the blood stream and its chemical shift sensitivity to its local environment allow monitoring of gas exchange in the lungs, perfusion of the brain and kidneys, and blood oxygenation. This article reviews the methods and applications of in vivo129Xe MR in humans, with a focus on the physics of polarisation by optical pumping, radiofrequency coil and pulse sequence design, and the in vivo applications of 129Xe MRI and MRS to examine lung ventilation, microstructure and gas exchange, blood oxygenation, and perfusion of the brain and kidneys.
Keywords: Brain; Hyperpolarised (129)Xe; Kidneys; Lungs; Magnetic resonance imaging/spectroscopy.
Copyright © 2020 The Authors. Published by Elsevier B.V. All rights reserved.
Conflict of interest statement
Declaration of Competing Interest The authors declare that they have no known competing financial interests or personal relationships that could have appeared to influence the work reported in this paper.
Figures
Similar articles
-
Hyperpolarized 129Xe MRI and Spectroscopy: Quantitative Measurements, Results, and Emerging Opportunities.Radiol Cardiothorac Imaging. 2025 Aug;7(4):e240562. doi: 10.1148/ryct.240562. Radiol Cardiothorac Imaging. 2025. PMID: 40772846 Review.
-
MR Spectroscopic Imaging of Hyperpolarized 129-Xenon in the Dissolved-Phase to Determine Regional Chemical Shifts of Hyperoxia in Healthy Porcine Lungs.NMR Biomed. 2025 Jun;38(6):e70063. doi: 10.1002/nbm.70063. NMR Biomed. 2025. PMID: 40384034 Free PMC article.
-
Hyperpolarised gas filling station for medical imaging using polarised 129Xe and 3He.Magn Reson Imaging. 2021 Jun;79:112-120. doi: 10.1016/j.mri.2021.02.010. Epub 2021 Feb 15. Magn Reson Imaging. 2021. PMID: 33600894 Free PMC article.
-
Hyperpolarized Gas MR Imaging: Technique and Applications.Magn Reson Imaging Clin N Am. 2015 May;23(2):217-29. doi: 10.1016/j.mric.2015.01.003. Magn Reson Imaging Clin N Am. 2015. PMID: 25952516 Free PMC article. Review.
-
In vivo MR imaging of pulmonary perfusion and gas exchange in rats via continuous extracorporeal infusion of hyperpolarized 129Xe.PLoS One. 2012;7(2):e31306. doi: 10.1371/journal.pone.0031306. Epub 2012 Feb 21. PLoS One. 2012. PMID: 22363613 Free PMC article.
Cited by
-
Global Trends and Research Hotspots in Long COVID: A Bibliometric Analysis.Int J Environ Res Public Health. 2022 Mar 21;19(6):3742. doi: 10.3390/ijerph19063742. Int J Environ Res Public Health. 2022. PMID: 35329428 Free PMC article.
-
Hyperpolarized Xenon-129 Chemical Exchange Saturation Transfer (HyperCEST) Molecular Imaging: Achievements and Future Challenges.Int J Mol Sci. 2024 Feb 5;25(3):1939. doi: 10.3390/ijms25031939. Int J Mol Sci. 2024. PMID: 38339217 Free PMC article. Review.
-
A decay-modeled compressed sensing reconstruction approach for non-Cartesian hyperpolarized 129Xe MRI.Magn Reson Med. 2024 Oct;92(4):1363-1375. doi: 10.1002/mrm.30188. Epub 2024 Jun 11. Magn Reson Med. 2024. PMID: 38860514
-
Instrumentation for Hydrogenative Parahydrogen-Based Hyperpolarization Techniques.Anal Chem. 2022 Jan 11;94(1):479-502. doi: 10.1021/acs.analchem.1c04863. Epub 2022 Jan 1. Anal Chem. 2022. PMID: 34974698 Free PMC article.
-
Lung Volume Dependence and Repeatability of Hyperpolarized 129Xe MRI Gas Uptake Metrics in Healthy Volunteers and Participants with COPD.Radiol Cardiothorac Imaging. 2023 Jun 22;5(3):e220096. doi: 10.1148/ryct.220096. eCollection 2023 Jun. Radiol Cardiothorac Imaging. 2023. PMID: 37404786 Free PMC article.
References
-
- W. Ramsay, Nobel Lecture – The Rare Gases of the Atmosphere, in: Nobel Media AB, 1904.
-
- Raftery D. Xenon NMR Spectroscopy. In: Webb G.A., editor. Annual Reports on NMR Spectroscopy. Elsevier; 2006. pp. 205–270.
-
- Fraissard J., Ito T. Xe-129 Nmr-study of adsorbed xenon – a new method for studying zeolites and metal-zeolites. Zeolites. 1988;8:350–361.
-
- Kastler A. Quelques suggestions concernant la production optique et la détection optique d'une inégalité de population des niveaux de quantifigation spatiale des atomes. Application à l'expérience de Stern et Gerlach et à la résonance magnétique. J. Phys. Radium. 1950;11:255–265.
-
- Bouchiat M.A., Carver T.R., Varnum C.M. Nuclear polarization in He-3 gas induced by optical pumping and dipolar exchange. Phys. Rev. Lett. 1960;5:373–375.
Publication types
MeSH terms
Substances
Grants and funding
LinkOut - more resources
Full Text Sources
Other Literature Sources
Medical
