. 2021 Feb 26;371(6532):eabb1625.
doi: 10.1126/science.abb1625.

Liver homeostasis is maintained by midlobular zone 2 hepatocytes

Affiliations

Liver homeostasis is maintained by midlobular zone 2 hepatocytes

Yonglong Wei et al. Science. .

Erratum in

Abstract

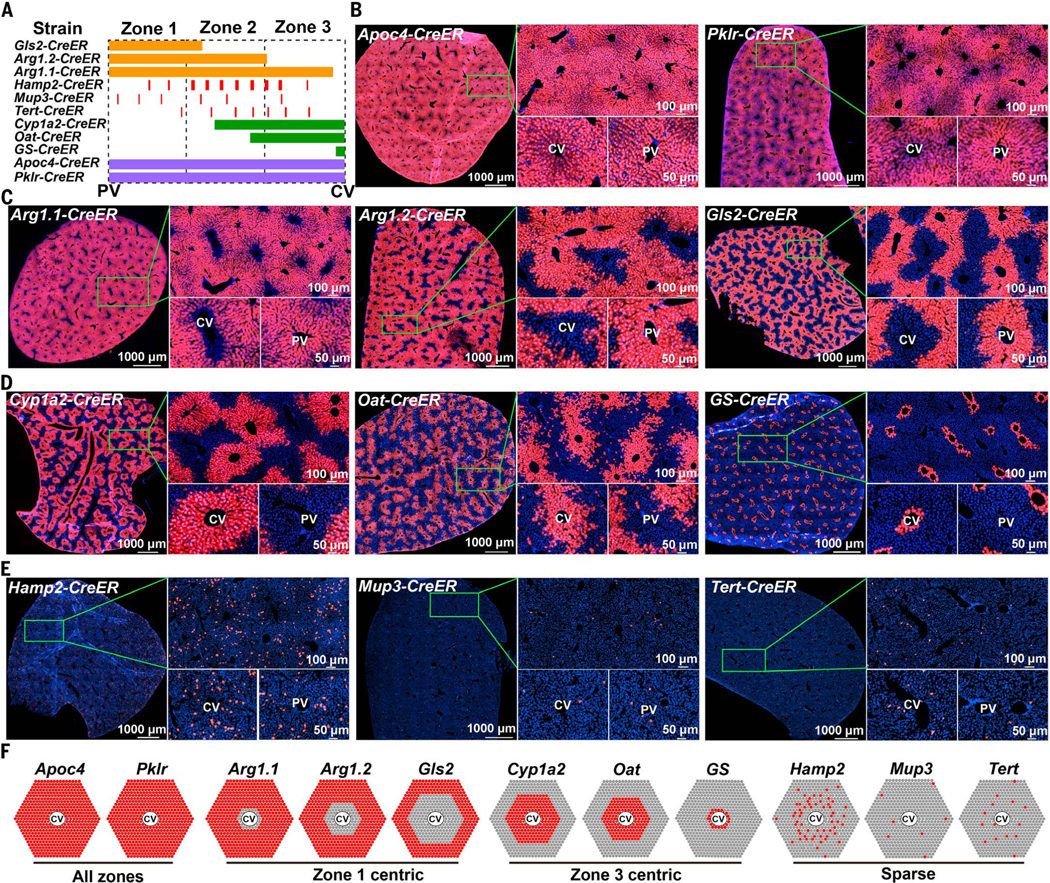
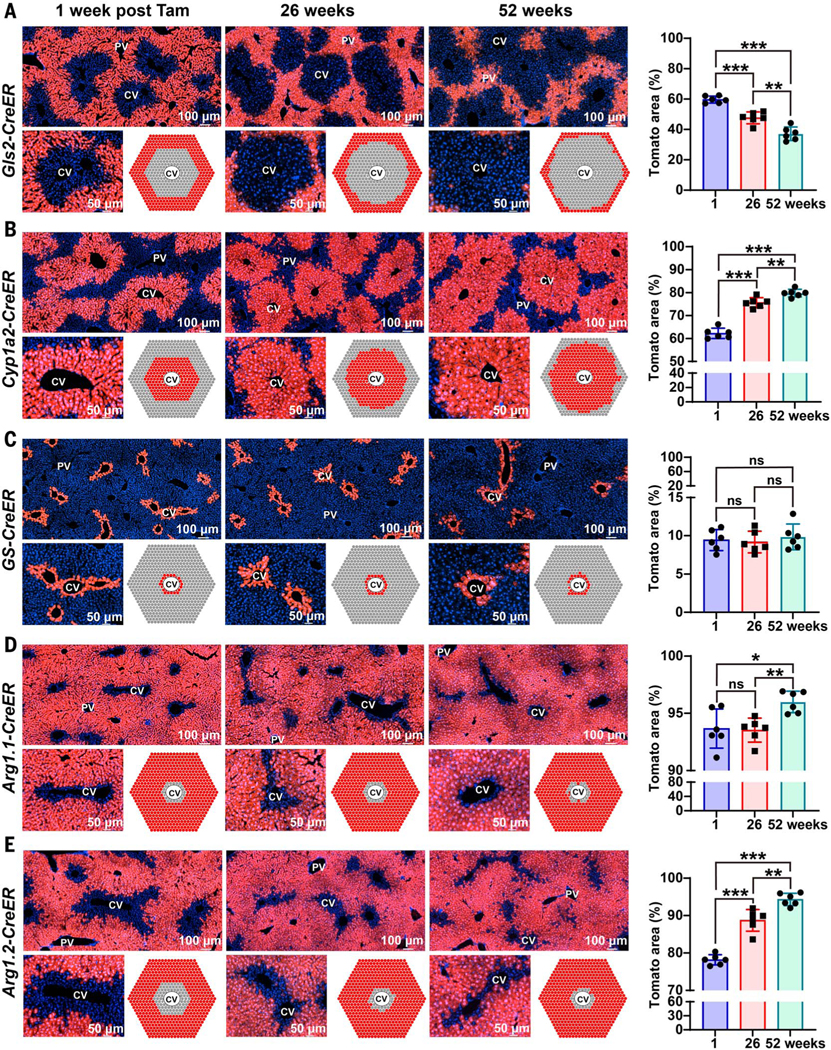
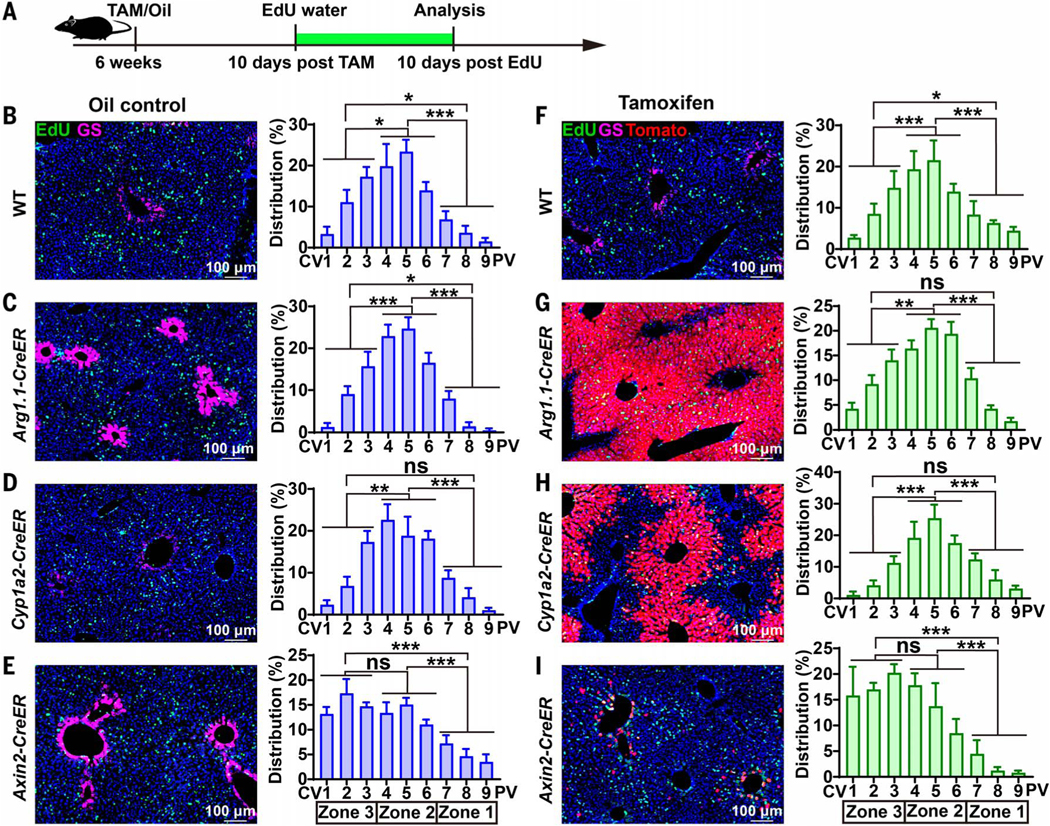
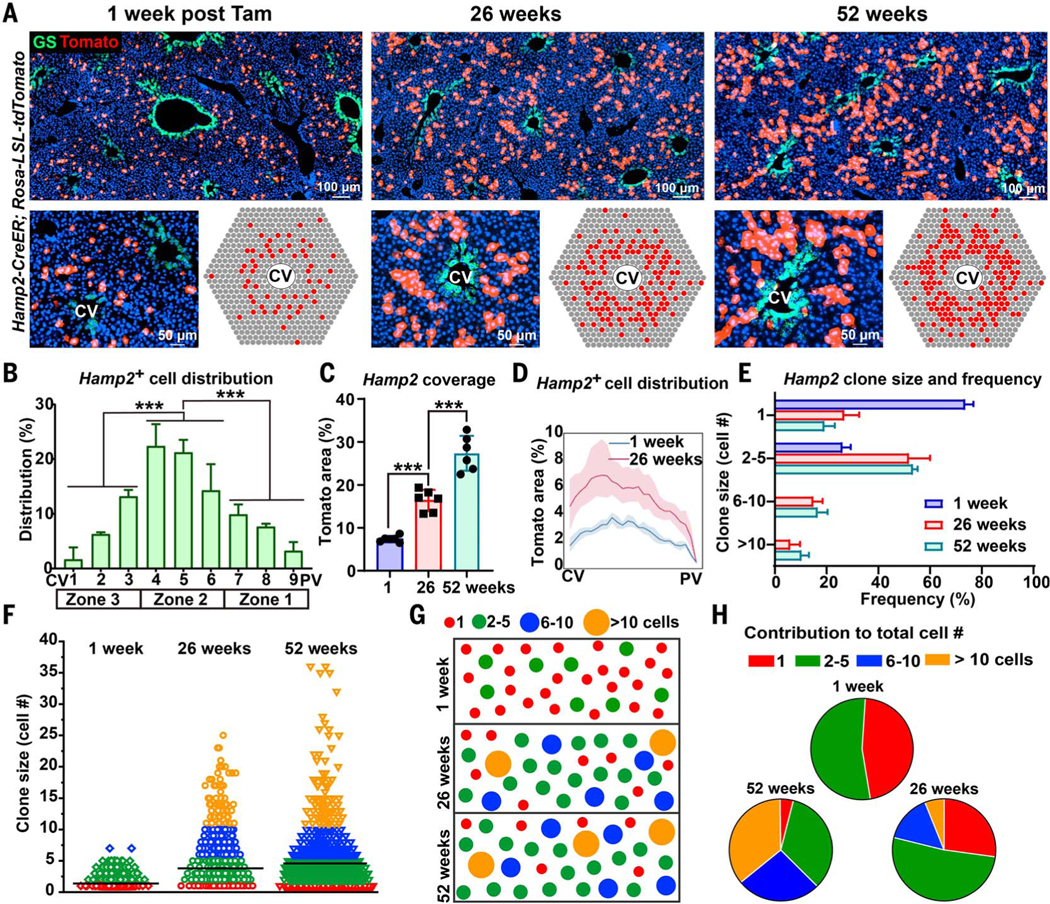
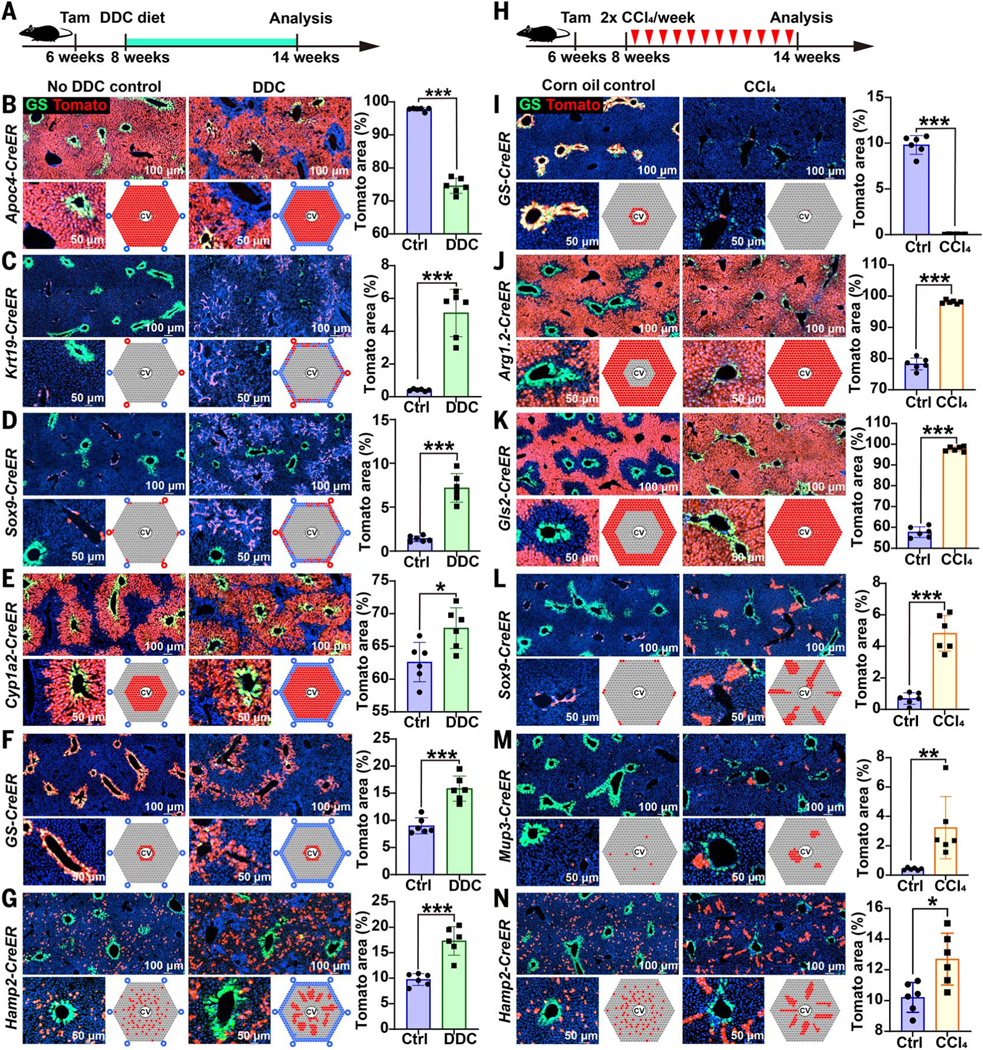
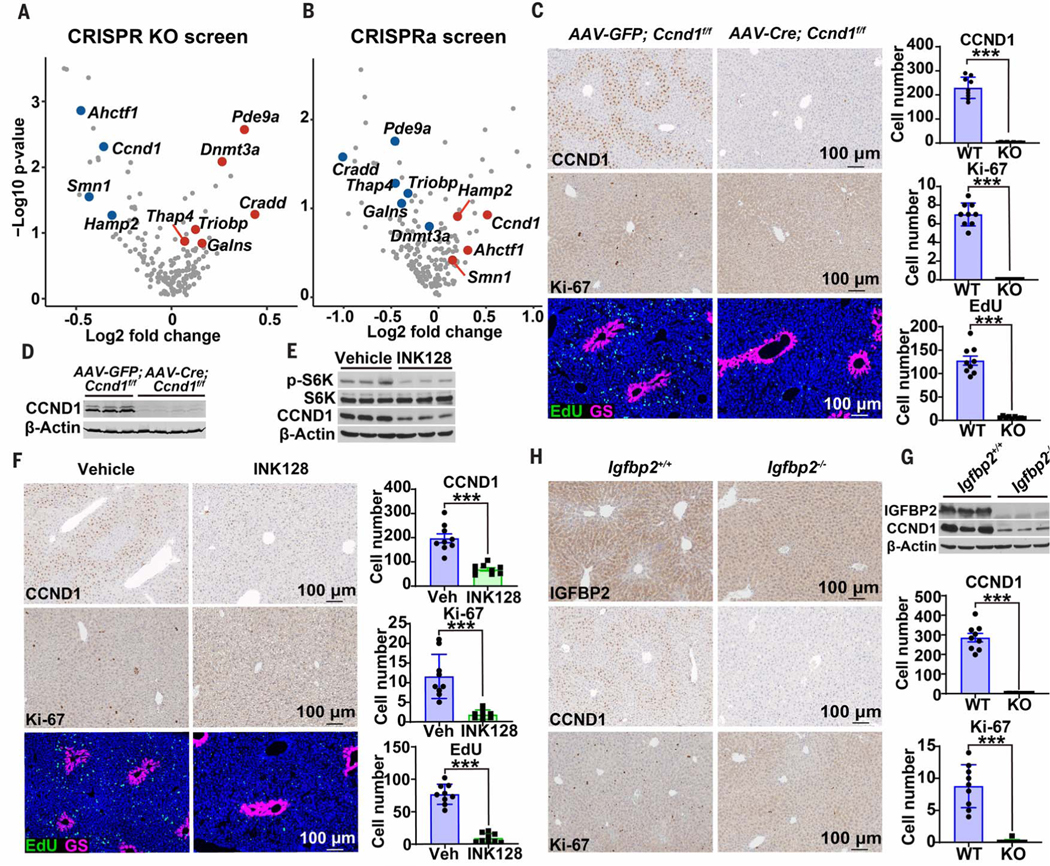
The liver is organized into zones in which hepatocytes express different metabolic enzymes. The cells most responsible for liver repopulation and regeneration remain undefined, because fate mapping has only been performed on a few hepatocyte subsets. Here, 14 murine fate-mapping strains were used to systematically compare distinct subsets of hepatocytes. During homeostasis, cells from both periportal zone 1 and pericentral zone 3 contracted in number, whereas cells from midlobular zone 2 expanded in number. Cells within zone 2, which are sheltered from common injuries, also contributed to regeneration after pericentral and periportal injuries. Repopulation from zone 2 was driven by the insulin-like growth factor binding protein 2-mechanistic target of rapamycin-cyclin D1 (IGFBP2-mTOR-CCND1) axis. Therefore, different regions of the lobule exhibit differences in their contribution to hepatocyte turnover, and zone 2 is an important source of new hepatocytes during homeostasis and regeneration.


Figures

Fig. 1.
Fig. 1.. Development of CreER knock-in strains using CRISPR mouse engineering.
(A) Eleven CreER knock-in strains used to label different zones across the liver lobule. (B) Each CreER strain was crossed to Rosa-LSL-tdTomato reporter mice, enabling permanent labeling by Tomato protein expression. Shown here are the pan-zonal, all-hepatocyte strains. For all strains, 100 mg of tamoxifen per kilogram of mouse was injected intraperitoneally once, unless otherwise indicated in fig. S2B. For all experiments in this figure, livers were harvested and analyzed ~1 week after the last dose of tamoxifen. (C) The zone 1 strains. (D) The zone 3 strains. For GS-CreER, no tamoxifen was needed. (E) The zone 2 strains. For Tert-CreER, 100 mg of tamoxifen per kilogram of mouse was injected intraperitoneally for 5 days. (F) Diagram of Tomato labeling in each CreER strain. At the corners are PVs and in the centers are CVs. Red spots reflect reporter expression in hepatocytes 1 week after tamoxifen administration.
Fig. 2.
Fig. 2.. Zone 1 and zone 3 compartments contract during normal homeostasis.
(A) For each of the lineage tracing experiments in this figure, we measured the proportion of total lobular area covered by Tomato as a proxy measure for hepatocyte repopulation (quantified on the right). Over 6 and 12 months, the percent area labeled by Gls2CreER decreased. (B) Over 6 and 12 months, the percent area labeled by Cyp1a2-CreER increased. (C) Over 6 and 12 months, the percent area labeled by GS-CreER did not change. (D) Over 6 months, the percent area labeled by Arg1.1CreER did not change, but after 12 months, the percent area increased. (E) Over 6 and 12 months, the percent area labeled by Arg1.2-CreER increased. *P < 0.05; **P < 0.01; ***P < 0.001; ns, not significant. Error bars indicate standard deviation (SD).
Fig. 3.
Fig. 3.. EdU labeling of wild-type and CreER strains during homeostasis.
(A) Schema for tamoxifen (TAM) administration followed by 10 days of EdU incorporation. (B) EdU florescence images for the detection of proliferating cells (left) and the quantification of spatial distribution of EdU-positive cells (right) from wild-type mice without CreER (n = 6 mice, three images from each were quantified). Distribution (%) of EdU represents the number of EdU-positive cells within a zonal layer divided by the total number of EdU-positive cells in all zones. See methods for positional quantification methods. All images are 7 × 105 μm2. (C) The same EdU analysis in Arg1.1-CreER;tdTomato mice (n = 7 mice, three images from each).(D) EdU analysis in Cyp1a2-CreER;tdTomato mice (n = 5 mice, three images from each). (E) EdU analysis in Axin2-CreER;tdTomato mice (n = 5 mice, three images from each). (F to I) The analysis from (B) to (E) was repeated after tamoxifen administration (n = 8, 9, 8, and 9 mice, respectively). Three images from each mouse were analyzed. *P < 0.05; **P < 0.01; ***P < 0.001. Error bars indicate standard error (SEM).
Fig. 4.
Fig. 4.. Zone 2 hepatocytes repopulate the liver during normal homeostasis.
(A) Hamp2CreER Tomato labeling at 1, 26, and 52 weeks. Endogenous GS immunofluorescence shown in green marks the CV region. Cartoon depicting the pattern of Tomato labeling in Hamp2-CreER livers over time (bottom right).(B) Manual measurements of Hamp2-CreER–labeled Tomatopositive cells as a function of position along the CV-to-PV axis. (C) The percent area labeled by Hamp2-CreER at 1, 26, and 52 weeks after tamoxifen administration. (D) Image analysis of Hamp2-labeled area at 1 and 26 weeks after tamoxifen administration. (E) Labeled clone size frequency in Hamp2-CreER livers at 1, 26, and 52 weeks after tamoxifen administration. (F) Individual clone size distribution in Hamp2-CreER livers at 1, 26, and 52 weeks after tamoxifen administration. The mean clone size (horizontal black line) increased from 1.38 ± 0.37 to 3.81 ± 0.35 to 4.74 ± 0.48 cells at 1, 26, and 52 weeks, respectively (mean ± SD). (G) Statistically representative cartoon of clone size changes over time. (H) Pie chart showing how different-sized clones contributed to the total number of labeled cells. ***P < 0.001. Error bars indicate SD for all panels except (B), where SEM is used.
Fig. 5.
Fig. 5.. Cellular contributions to regeneration after chronic periportal and centrilobular injuries.
(A) Periportal zone 1 injury was induced by feeding lineage-tracing mice with 0.1% DDC for 6 weeks. DDC was initiated 2 weeks after using tamoxifen to label populations, then we harvested livers and examined the distribution of Tomato-labeled cells. Endogenous GS immunofluorescence is shown in green for all of the images in this figure. (B) Apoc4CreER tracing after 6 weeks of DDC. (C) Krt19-CreER tracing after 6 weeks of DDC. (D) Sox9CreER tracing after 6 weeks of DDC. (E) Cyp1a2-CreER tracing after 6 weeks of DDC. (F) GSCreER tracing after 6 weeks of DDC. (G) Hamp2-CreER tracing after 6 weeks of DDC. (H) For all of the following experiments, mice were injected with 12 biweekly doses of CCl4 (1 ml per gram of mouse) to induce chronic centrilobular liver injury 2 weeks after using tamoxifen to label different populations. One week after the last dose, we harvested livers and examined the distribution of Tomatolabeled cells. (I) GS-CreER tracing after 6 weeks of CCl4. (J) Arg1.2-CreER tracing after 6 weeks of CCl4. (K) Gls2-CreER tracing after 6 weeks of CCl4. (L) Sox9-CreER tracing after 6 weeks of CCl4. (M) Mup3 tracing after 6 weeks of CCl4. (N) Hamp2-CreER tracing after 6 weeks of CCl4. *P < 0.05; **P < 0.01; ***P < 0.001. Error bars indicate SD. ctrl, control.
Fig. 6.
Fig. 6.. Zone 2 proliferation is driven by the IGFBP2-mTOR-CCND1 axis.
(A) Pooled transposon plasmids were used for gene deletion and hepatocyte repopulation of Fah KO mouse livers. Plasmids containing Cas9, mouse Fah, and sgRNAs targeting zone 2 genes were injected with Sleeping Beauty transposase (SB100) intravenously using hydrodynamic transfection. After 4 weeks, sgRNAs were deep sequenced and the results are shown here in the form of volcano plots. Only genes scoring as significant (P < 0.15) in both screens are highlighted as red or blue dots. (B) Pooled transposon plasmids were used for gene activation and repopulation of Fah KO mouse livers. Plasmids containing dCas9-VP64 (catalytically dead Cas9 fused with transcriptional activator VP64), mouse Fah cDNA, and sgRNAs targeting the promoters of zone 2 genes were injected with SB100. (C) Sevenweek-old Ccnd1f/f mice were given control AAV-GFP (n = 3 mice) or liver-specific AAV-TBG-Cre (n = 4 mice). After 48 hours, EdU water was provided for 15 days. Immunohistochemistry (IHC) showing CCND1 and Ki-67 along with immunofluorescence (IF) showing EdU (green) and GS (red) in livers of control and Ccnd1-deleted mice. Cell numbers for three image fields per mouse are quantified on the right. All quantified images in this figure are 7 × 105 mm2. WT, wild type; KO, knockout. (D) Western blot analysis from harvested Ccnd1 livers. (E) Eight-week-old wild-type mice were treated with INK128, an mTORC1/2 specific inhibitor (n = 3, 3 mice). Two days after INK128 initiation, EdU water was provided for 10 days. Western blot analysis from harvested livers is shown. (F) IHC showing CCND1 and Ki-67 along with IF showing EdU (green) and GS (red) in livers of control and INK128-treated mice. Cell numbers for three image fields per mouse are quantified on the right. Veh, vehicle. (G) Eight-week-old wild-type and Igfbp2 whole-body KO mice were analyzed by Western blot analysis. (H) IHC showing IGFBP2, CCND1, and Ki-67 in livers of wild-type and Igfbp2 KO mice (n = 3, 3 mice). Cell numbers for three image fields per mouse are quantified on the right. ***P < 0.001. Error bars indicate SD.

Comment in

Similar articles

Cited by

References

    1. Kulik L, El-Serag HB, Epidemiology and management of hepatocellular carcinoma. Gastroenterology 156, 477–491.e1 (2019). doi: 10.1053/j.gastro.2018.08.065; - DOI - PMC - PubMed
    1. Font-Burgada J. et al. , Hybrid periportal hepatocytes regenerate the injured liver without giving rise to cancer. Cell 162, 766–779 (2015). doi: 10.1016/j.cell.2015.07.026; - DOI - PMC - PubMed
    1. Wang B, Zhao L, Fish M, Logan CY, Nusse R, Self-renewing diploid Axin2+ cells fuel homeostatic renewal of the liver. Nature 524, 180–185 (2015). doi: 10.1038/nature14863; - DOI - PMC - PubMed
    1. Lin S. et al. , Distributed hepatocytes expressing telomerase repopulate the liver in homeostasis and injury. Nature 556, 244–248 (2018). doi: 10.1038/s41586-018-0004-7; - DOI - PMC - PubMed
    1. Pu W. et al. , Mfsd2a+ hepatocytes repopulate the liver during injury and regeneration. Nat. Commun. 7, 13369 (2016). doi: 10.1038/ncomms13369; - DOI - PMC - PubMed

Publication types