. 2021 Apr 2;372(6537):eabf7117.
doi: 10.1126/science.abf7117. Epub 2021 Feb 25.

Haplotype-resolved diverse human genomes and integrated analysis of structural variation

Peter Ebert #  1 Peter A Audano #  2 Qihui Zhu #  3 Bernardo Rodriguez-Martin #  4 David Porubsky  2 Marc Jan Bonder  4   5 Arvis Sulovari  2 Jana Ebler  1 Weichen Zhou  6 Rebecca Serra Mari  1 Feyza Yilmaz  3 Xuefang Zhao  7   8 PingHsun Hsieh  2 Joyce Lee  9 Sushant Kumar  10 Jiadong Lin  11 Tobias Rausch  4 Yu Chen  12 Jingwen Ren  13 Martin Santamarina  14   15 Wolfram Höps  4 Hufsah Ashraf  1 Nelson T Chuang  16 Xiaofei Yang  17 Katherine M Munson  2 Alexandra P Lewis  2 Susan Fairley  18 Luke J Tallon  16 Wayne E Clarke  19 Anna O Basile  19 Marta Byrska-Bishop  19 André Corvelo  19 Uday S Evani  19 Tsung-Yu Lu  13 Mark J P Chaisson  13 Junjie Chen  20 Chong Li  20 Harrison Brand  7   8 Aaron M Wenger  21 Maryam Ghareghani  22   23   1 William T Harvey  2 Benjamin Raeder  4 Patrick Hasenfeld  4 Allison A Regier  24 Haley J Abel  24 Ira M Hall  25 Paul Flicek  18 Oliver Stegle  4   5 Mark B Gerstein  10 Jose M C Tubio  14   15 Zepeng Mu  26 Yang I Li  27 Xinghua Shi  20 Alex R Hastie  9 Kai Ye  11   28 Zechen Chong  12 Ashley D Sanders  4 Michael C Zody  19 Michael E Talkowski  7   8 Ryan E Mills  6   28 Scott E Devine  16 Charles Lee #  29   30   31 Jan O Korbel #  32   18 Tobias Marschall #  33 Evan E Eichler #  34   35
Affiliations

Haplotype-resolved diverse human genomes and integrated analysis of structural variation

Peter Ebert et al. Science. .

Abstract

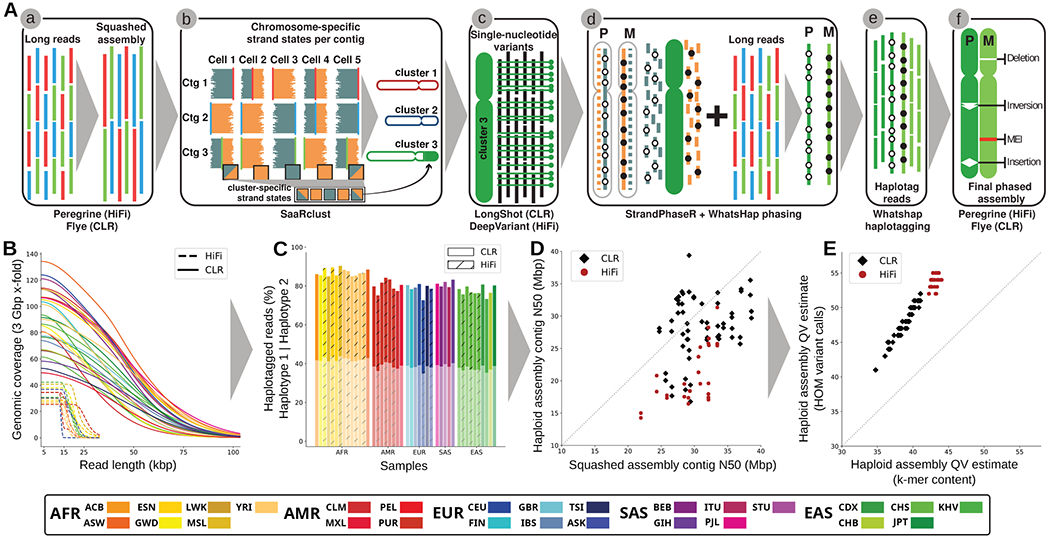
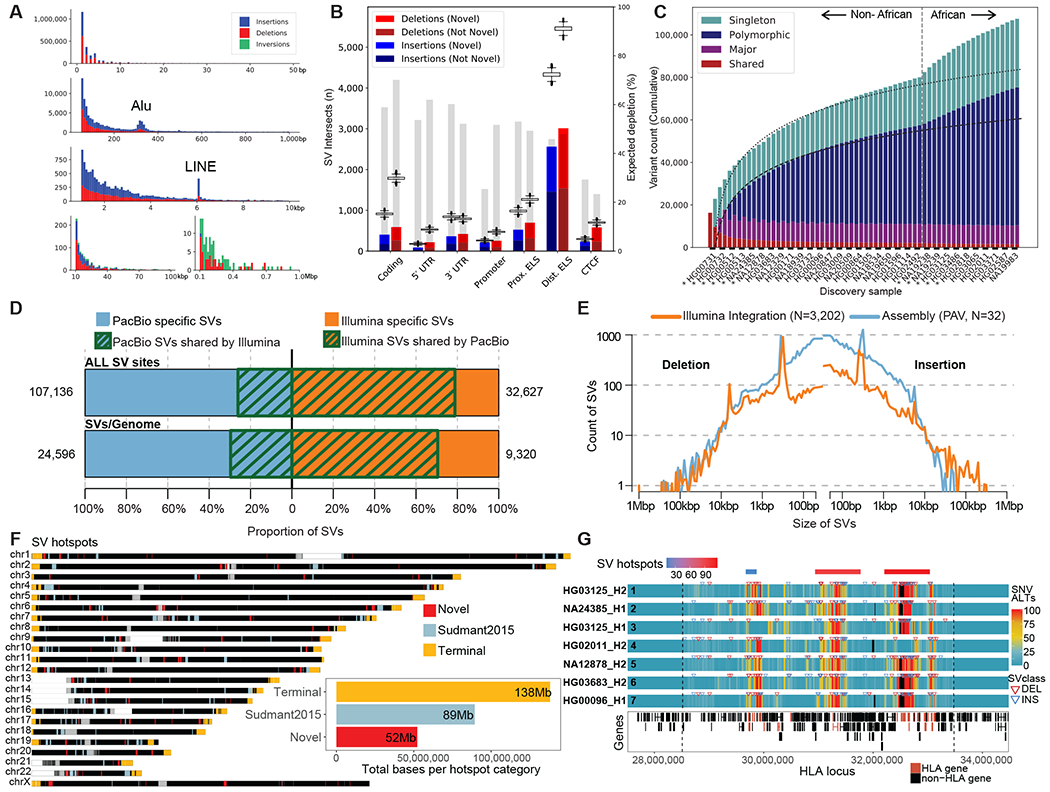
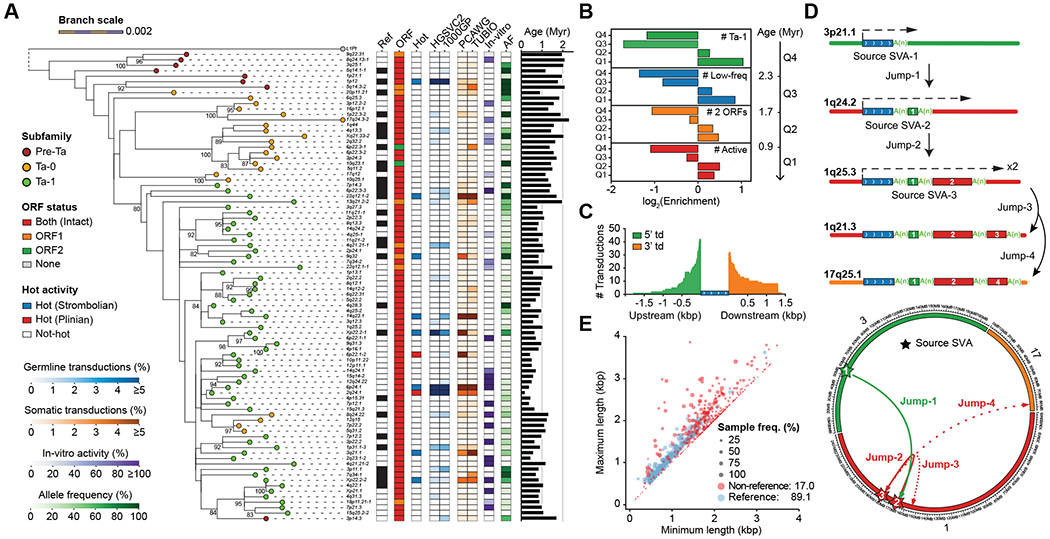
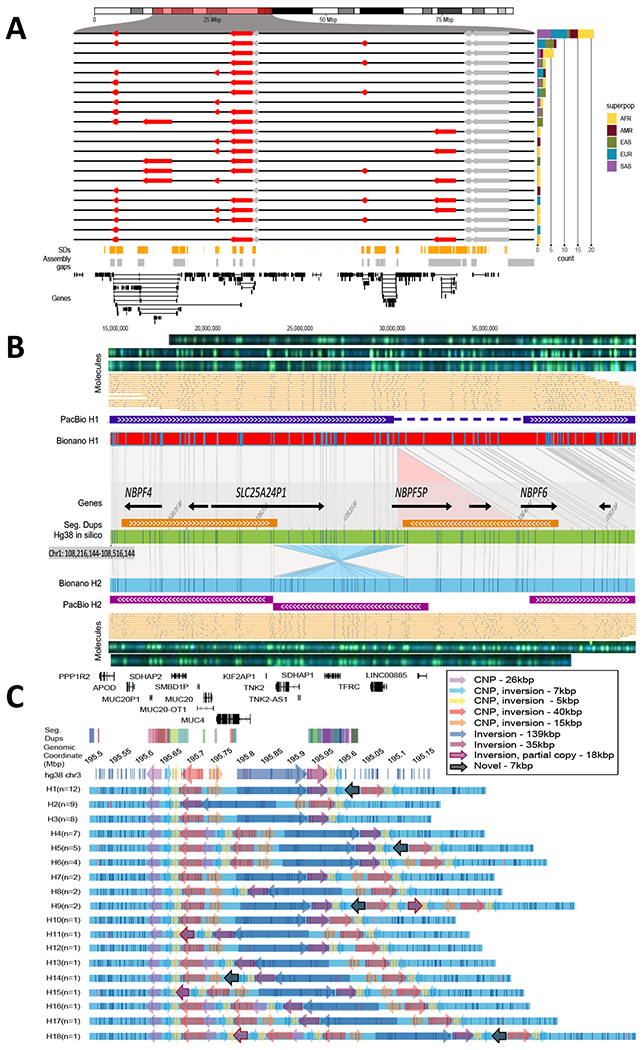
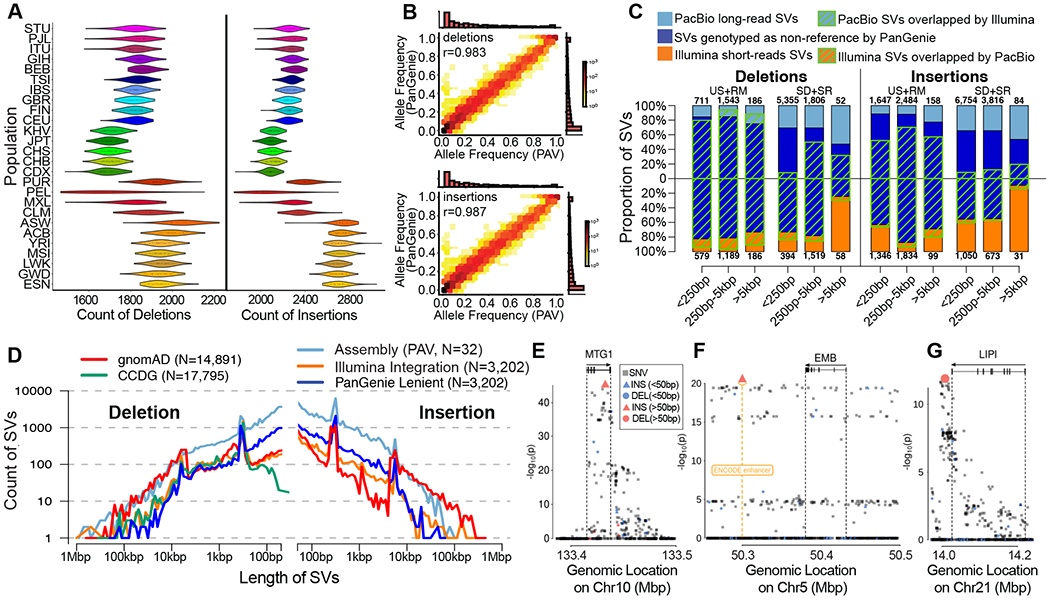
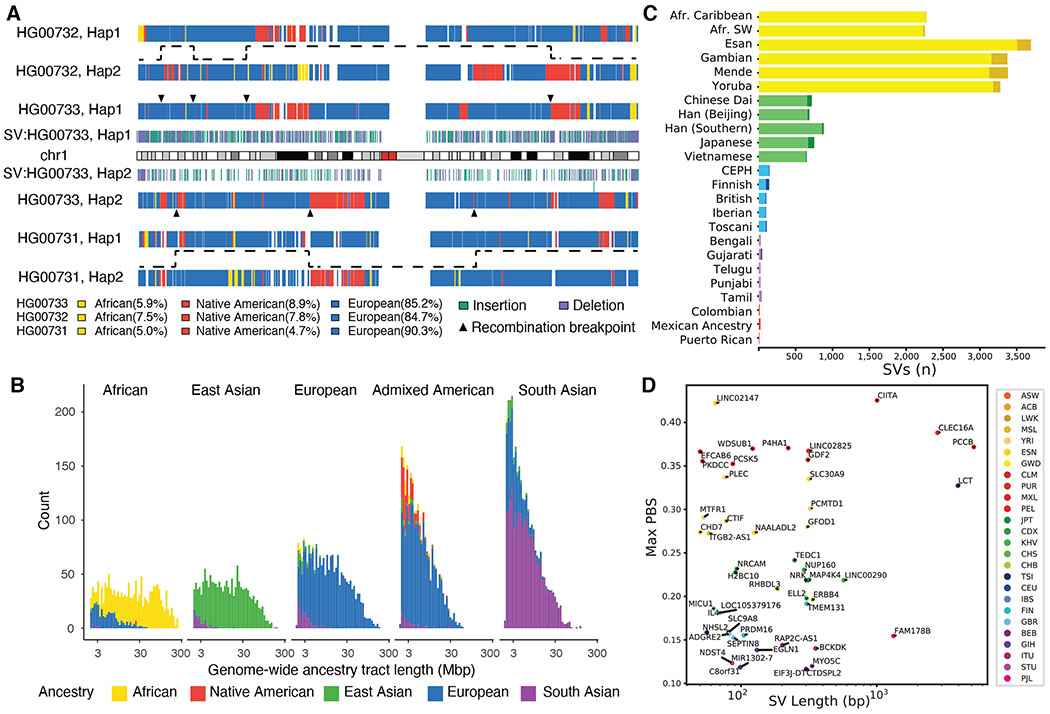
Long-read and strand-specific sequencing technologies together facilitate the de novo assembly of high-quality haplotype-resolved human genomes without parent-child trio data. We present 64 assembled haplotypes from 32 diverse human genomes. These highly contiguous haplotype assemblies (average minimum contig length needed to cover 50% of the genome: 26 million base pairs) integrate all forms of genetic variation, even across complex loci. We identified 107,590 structural variants (SVs), of which 68% were not discovered with short-read sequencing, and 278 SV hotspots (spanning megabases of gene-rich sequence). We characterized 130 of the most active mobile element source elements and found that 63% of all SVs arise through homology-mediated mechanisms. This resource enables reliable graph-based genotyping from short reads of up to 50,340 SVs, resulting in the identification of 1526 expression quantitative trait loci as well as SV candidates for adaptive selection within the human population.


Conflict of interest statement

Competing interests: A.R.H. and J.L. are employees and shareholders of Bionano Genomics. A.M.W. is an employee and shareholder of Pacific Biosciences. M.C.Z. is a shareholder of Merck & Co. and Thermo Fisher Scientific Inc. P.F. is a member of the Scientific Advisory Boards of Fabric Genomics, Inc., and Eagle Genomics, Ltd. A.D.S., J.O.K., T.M., M.G., and D.P. have a pending patent application relevant to the subject matter (method relevant to Strand-seq).

Figures

Fig. 1.
Fig. 1.. Trio-free phased diploid genome assembly using Strand-seq (PGAS).
(A) A schematic of the PGAS pipeline (3): (a) generation of a non-haplotype-resolved (“squashed”) long-read assembly; (b) clustering of assembled contigs into “chromosome” clusters based on Strand-seq Watson/Crick signal; (c) calling of single-nucleotide variants (SNVs) relative to the clustered squashed assembly; (d) integrative phasing combines local (SNV) and global (Strand-seq) haplotype information for chromosome-wide phasing; (e) tagging of input long reads by haplotype; (f) phased genome assembly based on haplotagged long reads and subsequent variant calling (18). (B) Genomic coverage (y-axis) as a function of the long-read length (x-axis). (C) Fraction of reads that can be assigned (“haplotagged”) to either haplotype 1 (semitransparent) or haplotype 2 for HiFi (hatched) and CLR (solid) datasets. (D) Contig-level N50 values for squashed (x-axis) and haploid assemblies (y-axis) for CLR (black diamonds) and HiFi (red circles) samples. (E) Haploid assembly QV estimates computed from unique and shared k-mers (x-axis) based on homozygous Illumina variant calls (y-axis). Samples colored according to the 1000GP population color scheme (15) with exception of the added Ashkenazim individual NA24385/HG002 (Coriell family ID 3140) (ASK/dark blue).
Fig. 2.
Fig. 2.. Variant discovery and distribution.
(A) Size distribution of indels and SVs from 64 unrelated reference genomes shows a 2 bp periodicity for indels, 300 bp peak for Alu insertions (second row), and 6 kbp peak for L1 MEIs. (B) The number of SVs intersecting functional elements (horizontal axis) compared to randomly permuting SV locations (box plots). Gray bars depict percent depletion (right axis scale). ELS: Enhancer-like signature. CTCF: CCCTC-binding factor. (C) Cumulative number of unique SVs when adding samples one-by-one, from left to right. The rate of SV discovery slows with each new haplotype (regression lines); however, the addition of haplotypes of African origin (dashed line) increases SV yield. Colors indicate SVs shared among all haplotypes and not present in GRCh38 (red), major allele variants (AF≥50%, purple), polymorphisms (≥2 haplotypes, blue) and singletons (teal). Asterisks indicate samples sequenced using PacBio HiFi. (D) Overlap between SVs detected by PacBio long-read assemblies and Illumina short-read alignments on 31 matched samples (NA24835, HG00514, HG00733 and NA19240 excluded). Top bar shows overall SV sites across 31 samples, while the bottom bar displays the average count of SVs per sample, with green stripes representing concordant SV calls between technologies. (E) Length distribution of SVs detected by PacBio long-read assemblies and Illumina short-read alignments across all 31 matched samples. (F) Genome-wide distribution of SV hotspots divided in three categories: last 5 Mbp of chromosomes (yellow), overlapping (light blue), and novel (red) when compared to short-read SV analysis of 1000GP (23). The total sequence length is represented by each hotspot category (inset). (G) Heatmap of seven selected SV haplotypes for 4 Mbp MHC region (chr6:28,510,120-33,480,577 dashed lines) comparing regions of high SNV (red) and low diversity (blue) regions based on the number of alternate SNVs compared to the reference (GRCh38; alignment bin size 10 kbp, step 1 kbp). Phased SV insertions (blue arrows) and deletions (red arrows) are mapped above each haplotype. The most diverse regions correspond to SV hotspots (red/blue bars top row) and cluster with HLA genes (red bottom track).
Fig. 3.
Fig. 3.. Mobile element insertions.
(A) Maximum-likelihood phylogenetic tree (85) for highly active sequence-resolved FL-L1s annotated by subfamily designation, presence/absence on the reference, ORF content, and hot activity profile (–36) (bootstrap values ≥80% shown). Tree branch lengths are scaled according to the average number of substitutions per base position. Dashed lines map each L1 cytoband identifier to its corresponding branch on the tree. Pan troglodytes (L1Pt) is included as an outgroup. Heatmaps represent allele frequency (AF) based on the assembly discovery set, activity estimates based on in vitro assays (31, 32) and the number of transduction events detected in human populations (33) or cancer studies (–36). (B) Enrichment and depletion in the number of FL-L1s belonging to the Ta-1 subfamily at age quartiles (Q1-Q4) compared with a random distribution. Same applies for the other features, including the number of FL-L1s with low allele frequency (MAF<5%), with two intact ORFs, or with evidence of activity. (C) Size distribution and number of 5′ and 3′ SVA-mediated transductions (td) based on the analysis of flanking sequences. (D) Schematic and circos representation for serial SVA-mediated transduction events. Dashed arrows indicate SVA transcription initiation and end. Transduced sequences are shown as colored boxes with their length proportional to transduction size. (E) Distributions of VNTR length (x-axis: the minimum, y-axis: the maximum) of reference and non-reference SVA elements. Reference SVAs are shown as blue dots and non-reference SVAs as red dots. The dot size represents the sample frequency of SVAs among discovery samples in the HGSVC.
Fig. 4.
Fig. 4.. Complex patterns of structural variation.
(A) An inversion hotspot mapping to a 2.5 Mbp gene-rich region of chromosome 16p12 (highlighted portion of ideogram). Haplotype structure of inversions (red arrows) are compared to the GRCh38 reference orientation (black lines) as well as additional inversions (gray), which could not be haplotype integrated because of uninformative markers. A barplot (right panel) enumerates the frequency of each distinct inversion configuration (n=22) by superpopulation for the 64 phased genomes. Bottom panels: Shows distribution of SDs (orange), assembly gaps (gray), and genes (black) in a given region. (B) A partially resolved complex SV locus (HG00733 at chr1:108,216,144-108,516,144). Optical maps generated by DLE1 digestion predict a deletion (red bar, Bionano H1) and an inversion (blue bar, Bionano H2) when compared to GRCh38 (green bar). Haplotype structures are strongly supported by extracted single molecules (beige) and raw images (green dots). Phased assembly correctly resolves the hap1 deletion (purple top) and Strand-seq detects the inversion (blue) but misses the flanking SD, which is a gap in the H2 assembly (gap). (C) Haplotype structural complexity at chromosome 3q29. Optical mapping of a 410 kbp gene-rich region (chr3:195,607,154-196,027,006) predicts 18 distinct structural haplotypes (H1-H8) that vary in abundance (n=1 to 12) and differ by at least nine copy number SDs and associated inversion polymorphisms (see colored arrows). This hotspot leads to changes in gene copy and order (GENCODE v34 top panel): 26 haplotypes are fully resolved by phased assembly (21 CLR, 5 HiFi) and the median MAP60 contig coverage of the region is 96.1%.
Fig. 5.
Fig. 5.. SV genotyping and eQTL analysis.
(A) Distribution of heterozygous SV counts per diploid genome broken down by population, based on PanGenie genotypes passing strict filters. (B) Concordance of allele frequency (AF) estimates from the assembly-based PAV discovery callset and AF estimates from genotyping unrelated Illumina genomes (n=2,504) with PanGenie (strict genotype set of 24,107 SVs); marginal histograms are in linear scale. (C) Count of short- and long-read SVs across variant class, size distribution, and genomic sequence localization. Blue bars represent the proportion of SVs genotyped by PanGenie with AF>0 and green stripes represent concordant SVs between technologies. SD: segmental duplications; SR: simple repeats; RM: repeat masked (not SD or SR); US: unique sequence. (D) Length distribution of common SVs sites (AF>5%) represented in assembly-based callset, including variants genotyped using PanGenie and all common variants from population-scale studies from the Genome Aggregation Database (gnomAD-SV) and the Centers for Common Disease Genetics (CCDG; insertions from CCDG omitted due to lack of data). Length distributions for all variants (not restricted to common) are provided in fig. S23. (E-G) Examples of lead SV-eQTLs (large symbols) in context of their respective genes, overlapping regulatory annotation, and other variants (small symbols). (E) An 89 bp insertion (chr10-133415975-INS-89) is linked to decreased expression of MTGI (q-value = 4.10e-11, Beta = −0.55 [−0.51 — −0.59]). (F) A 186 bp insertion (chr5-50299995-INS-186), overlapping an ENCODE enhancer mark (orange), is the lead variant associated with decreased expression of EMB (q-value = 2.92e-06, Beta = −0.44 [−0.39 — −0.49]). (G) A 1,069 bp deletion (chr21-14088468-DEL-1069) downstream of LIPI is linked to increased expression of LIPI (q-value = 0.0022, Beta = 0.44 [0.38 — 0.50]).
Fig. 6.
Fig. 6.. Ancestry and population differentiation inferences using haplotype-phased diploid assemblies.
(A) Inferred local ancestries (18) for maternal (upper) and paternal (bottom) haplotypes of HG00733 are compared to parental haplotypes (maternal: HG00732, paternal: HG00731). Ancestral segments are colored (African: yellow, Native American: red, and European: blue) and are consistent with the recent demographic history of the island (18). HG0733 SVs (≥50 bp; insertion: green, deletion: purple), inferred recombination breakpoints (triangles), and transmission of recombinant parental haplotypes (dashed lines) are shown. (B) Length distribution (log10) of ancestry tracts among the 64 genomes assigned to five superpopulations shows evidence of recent (Admixed American) and more ancient (South Asian) admixture. (C) Top population-specific Fst variants (dark color) and top superpopulation-specific Fst variants (light color). The number of stratified SVs differs by orders of magnitude depending on population. (D) Top SV PBS (population branch statistic) values within 5 kbp of genes identify SV candidates for selection and disease. A high PBS statistic suggests AF differences among populations are a result of selection.

Comment in

References

    1. Chaisson MJP et al. Multi-platform discovery of haplotype-resolved structural variation in human genomes. Nat. Commun 10, 1784 (2019). - PMC - PubMed
    1. Garg S et al. Chromosome-scale, haplotype-resolved assembly of human genomes. Nat. Biotechnol (2020), doi:10.1038/s41587-020-0711-0. - DOI - PMC - PubMed
    1. Porubsky D et al. Fully phased human genome assembly without parental data using single-cell strand sequencing and long reads. Nat. Biotechnol (2020), doi:10.1038/s41587-020-0719-5. - DOI - PMC - PubMed
    1. Audano PA et al. Characterizing the Major Structural Variant Alleles of the Human Genome. Cell. 176, 663–675.e19 (2019). - PMC - PubMed
    1. Collins RL et al. A structural variation reference for medical and population genetics. Nature. 581, 444–451 (2020). - PMC - PubMed

Publication types