. 2021 Feb 25;11(1):4688.
doi: 10.1038/s41598-021-83513-5.

Interaction of Plasmodium falciparum apicortin with α- and β-tubulin is critical for parasite growth and survival

Affiliations

Interaction of Plasmodium falciparum apicortin with α- and β-tubulin is critical for parasite growth and survival

Malabika Chakrabarti et al. Sci Rep. .

Abstract

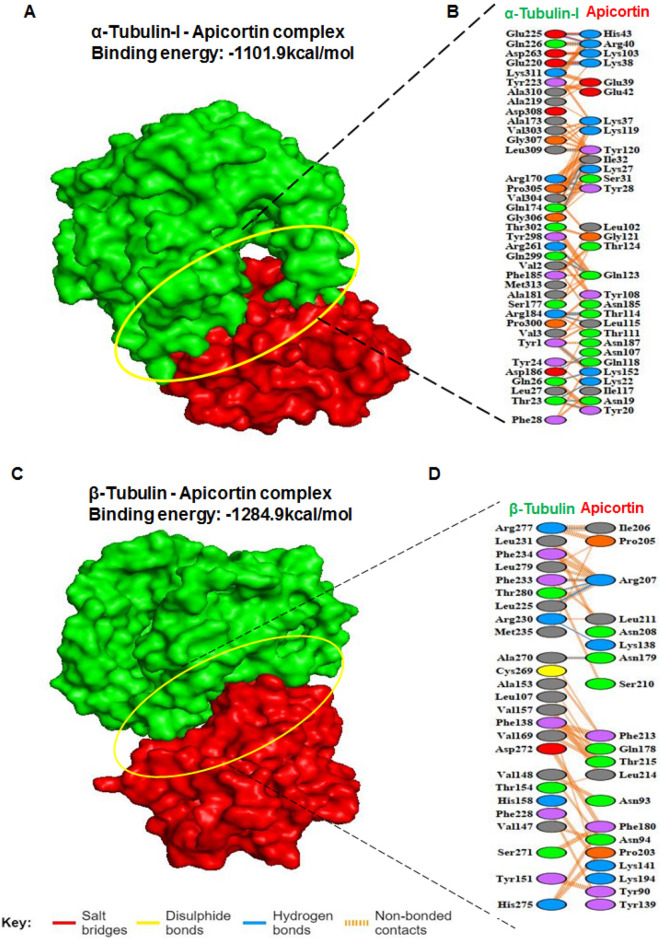
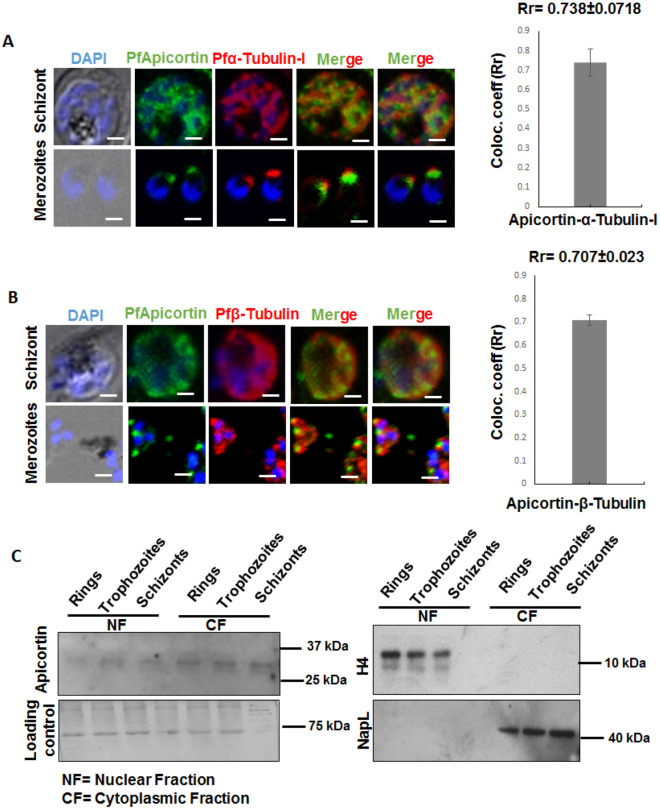
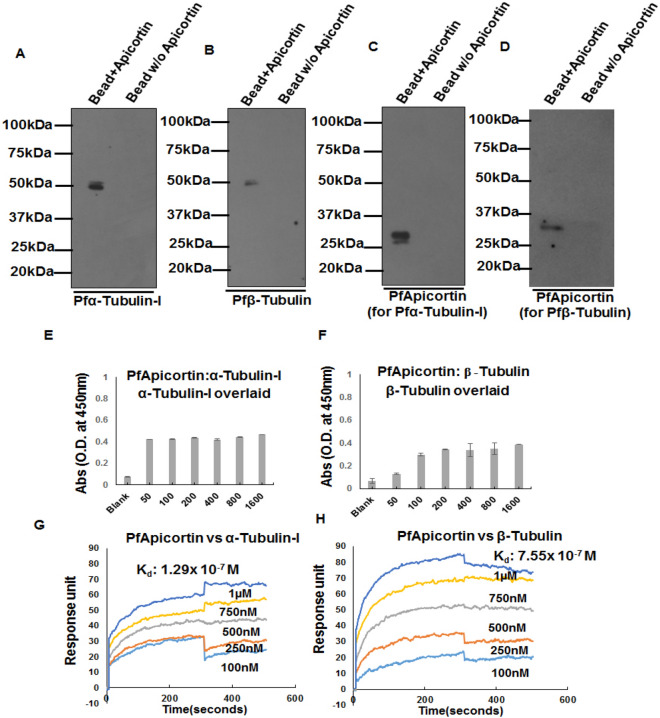
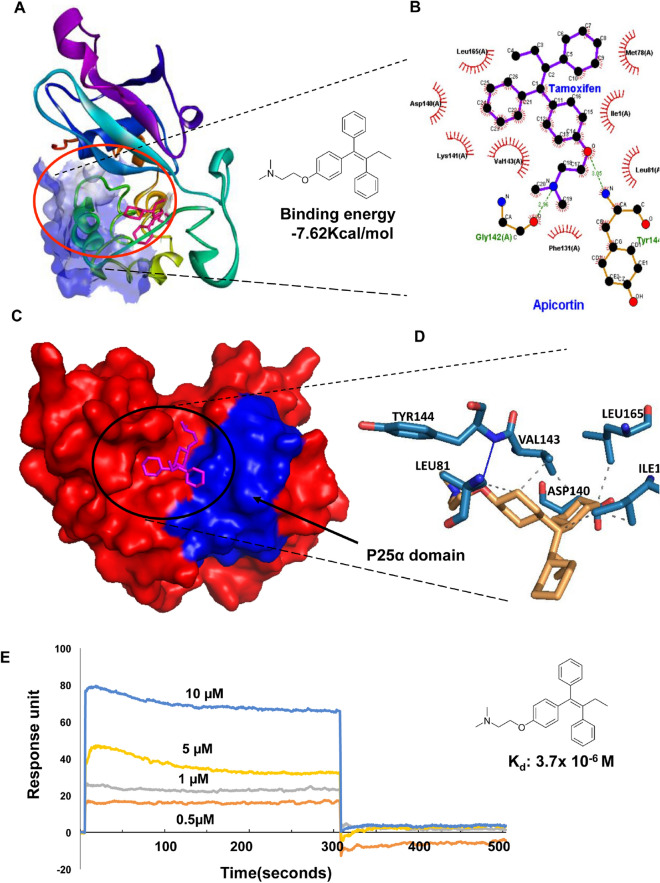
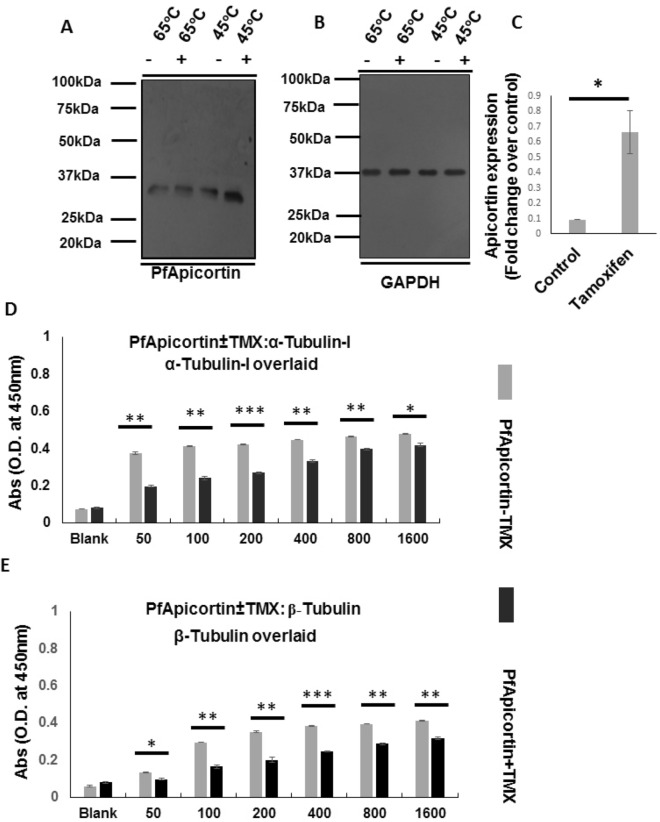
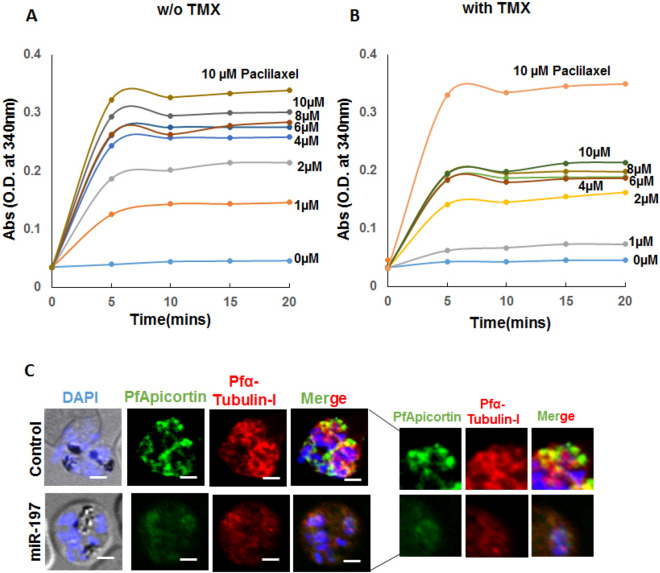
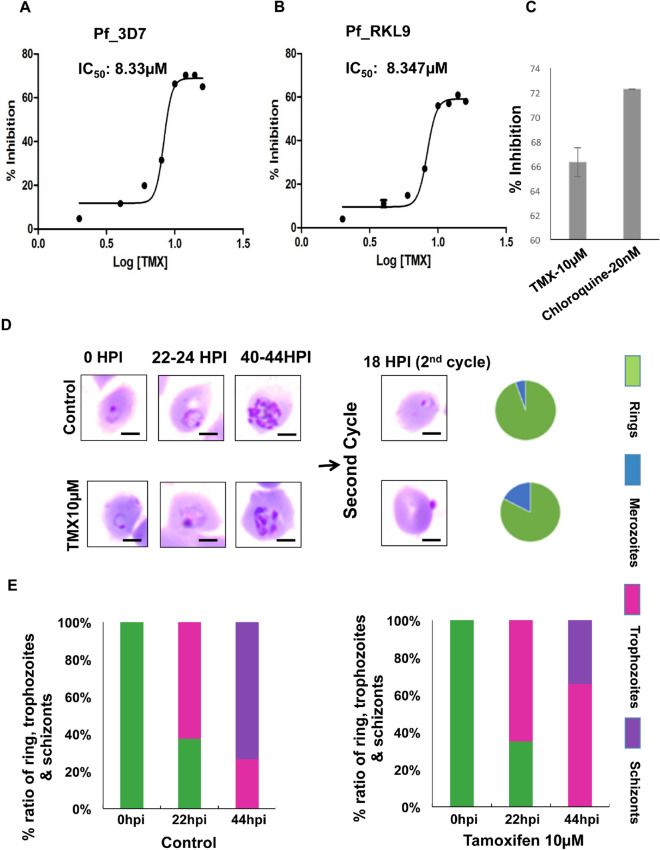
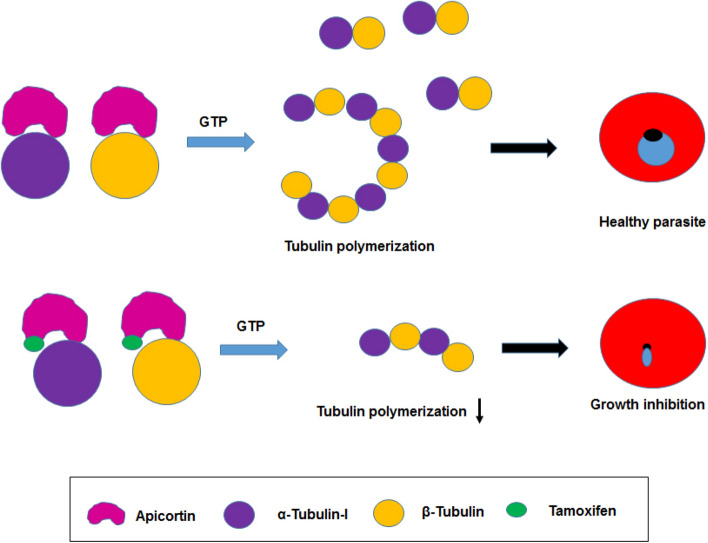
Cytoskeletal structures of Apicomplexan parasites are important for parasite replication, motility, invasion to the host cell and survival. Apicortin, an Apicomplexan specific protein appears to be a crucial factor in maintaining stability of the parasite cytoskeletal assemblies. However, the function of apicortin, in terms of interaction with microtubules still remains elusive. Herein, we have attempted to elucidate the function of Plasmodium falciparum apicortin by monitoring its interaction with two main components of parasite microtubular structure, α-tubulin-I and β-tubulin through in silico and in vitro studies. Further, a p25 domain binding generic drug Tamoxifen (TMX), was used to disrupt PfApicortin-tubulin interactions which led to the inhibition in growth and progression of blood stage life cycle of P. falciparum.


Conflict of interest statement

The authors declare no competing interests.

Figures

Figure 1
Figure 1
In silico docking studies showing possible binding of PfApicortin with Pfα-tubulin-I and Pfβ-tubulin. (A) Pfα-tubulin-I-PfApicortin complex shown in surface model with interacting residues of α-tubulin-I-Apicortin complex, (B) Interacting residues of Pfα-tubulin-I and PfApicortin, (C) Pfβ-tubulin-PfApicortin complex shown in surface model with interacting residues of Pfβ-tubulin-PfApicortin complex, (D) Interacting residues of Pfβ-tubulin and PfApicortin. Modes of interaction have been shown using different colours. PLIP (https://projects.biotec.tu-dresden.de/plip-web/plip), Ligplus version 2.2 (ebi.ac.uk/thornton-srv/software/LigPlus/applicence.html), Discovery Studio version 19.1.0 (https://discover.3ds.com/discovery-studio-visualizer-download) and Pymol 2.3.2 (https://pymol.org/2/) softwares were used for data analysis and generation of figures.
Figure 2
Figure 2
Expression and localization of Pfα-tubulin-I and Pfβ-tubulin in parasite with respect to apicortin along with localization of apicortin in subcellular fractions. (A) Expression of PfApicortin(green channel) and Pfα-tubulin-I(red channel) in mature schizont and merozoites along with colocalization of it with PfApicortin (merged image and graph), (B) Expression of PfApicortin (green channel) and Pfβ-tubulin (red channel) in mature schizont along with localization of it with PfApicortin (merged image and graph), scale bar represents distance of 5 µm. Images were analyzed with Cellsense Dimension 3 (https://www.olympus-lifescience.com/en/software/cellsens/) and ImageJ (imagej.nih.gov) softwares, (C) Blot showing bands of apicortin in the cytoplasmic and nuclear fractions along with the gel showing the loading control (Supplementary Fig. S9A,B) and the blots indicating the level of H4(histone) and PfNapL in nuclear and cytoplasmic fractions as controls (Supplementary Fig. S9C,D).
Figure 3
Figure 3
Monitoring of the binding of PfApicortin with α-tubulin-I and β-tubulin by immuno-precipitation, ELISA and SPR. (A) Detection of α-tubulin-I in western blotting after pulling down from parasite lysate with recombinant apicortin (Supplementary Fig. S10A), (B) Detection of β-tubulin in western blotting after pulling down from Pf3D7 lysate using recombinant apicortin (Supplementary Fig. S10B), (C) and (D) Confirmation of the presence of recombinant apicortin bound on the bead used for pull down assay (Supplementary Fig. S10C,D), (E) Graph showing indirect ELISA data showing interaction between PfApicortin and Pfα-tubulin-I with increasing titers of recombinant Pfα-tubulin-I overlaid on apicortin coated surface (x axis indicates amount of overlaid α-tubulin-I in ng), (F) Graph showing indirect ELISA data showing interaction between PfApicortin and Pfβ-tubulin with increasing titers of recombinant Pfβ-tubulin overlaid on apicortin coated surface (x axis indicates amount of overlaid β-tubulin in ng), (G) Graph showing surface plasmon resonance data where increasing concentrations of α-tubulin-I (in µM) was injected over the surface containing immobilized apicortin, (H) Graph showing surface plasmon resonance data where increasing concentrations of β-tubulin (in µM) was injected over the surface containing immobilized apicortin (analysis of spectra using Autolab ESPRIT kinetic evaluation software (https://www.metrohm.com/en-in/products/more-products/kei/). Data are represented as mean ± SD of at least three independent experiments.
Figure 4
Figure 4
Binding of TMX with apicortin. (A) 3D model of apicortin-TMX complex (PLIP; https://projects.biotec.tu-dresden.de/plip-web/plip) p25α domain surface has been shown in blue scheme based on its hydrophobicity, (B) Ligplot analysis (ebi.ac.uk/thornton-srv/software/LigPlus/applicence.html) of apicortin-TMX complex, (C) 3D surface model (Pymol 2.3.2; https://pymol.org/2/) of apicortin-TMX complex with p25α domain highlighted in blue, (D) Interacting residues of apicortin-TMX complex, (E) Graph showing SPR data indicating binding of increasing concentrations of TMX (in µM) on immobilized apicortin (analysis of spectra using ESPRIT kinetic evaluation software https://www.metrohm.com/en-in/products/more-products/kei/. Data are represented as mean ± SD of at least three independent experiments.
Figure 5
Figure 5
Confirmation of TMX binding with apicortin within parasite and disruption of apicortin-tubulin interaction in presence of TMX. (A) Western blot showing reduced band intensity of PfApicortin in thermal shift assay after treatment of parasites with TMX (presence and absence of TMX is indicated as ‘+’ and ‘−’; Supplementary Fig. S11A), (B) Blot showing bands of GAPDH as loading control (Supplementary Fig. S11B), (C) Graph showing the level of protection of PfApicortin(*p < 0.05) in thermal shift assay due to binding with TMX, (D) Graph showing indirect ELISA data indicating reduction in PfApicortin-α-tubulin-I interaction due to presence of TMX where recombinant α-tubulin-I was overlaid on apicortin-TMX complex coated surface (x axis indicates amount of overlaid α-tubulin-I in ng). Significant level of reduction in absorbance intensity was observed for all the titers of α- tubulin-I (50 ng, 100 ng, 400 ng, 800 ng: **p < 0.01, 200 ng:***p < 0.001, 1600 ng:*p < 0.05), (E) Graph showing indirect ELISA data indicating reduction in PfApicortin-β-tubulin interaction due to presence of TMX where recombinant β-tubulin was overlaid on apicortin-TMX complex coated surface (x axis indicates amount of overlaid β-tubulin in ng). Significant level of reduction in absorbance intensity was observed for all the titers of β-tubulin (100 ng, 200 ng, 800 ng, 1600 ng: **p < 0.01, 400 ng: ***p < 0.001, 50 ng: *p < 0.05). Data are represented as mean ± SD of at least three independent experiments.
Figure 6
Figure 6
Apicortin mediated tubulin polymerization and stabilization of parasite microtubules. (A) Graph showing polymerization of tubulins over time in presence of increasing concentrations of apicortin, (B) graph showing polymerization of tubulins in presence of increasing concentrations apicortin (in µM) pre-incubated with 10 µM TMX, (C) reduced expression of apicortin (green channel) and diffuse staining of α-tubulin-I (red channel) in parasites infecting miR-197 loaded erythrocytes. Scale bar represents distance of 5 µm. Analysis of images performed using Cellsense Dimension 3 (https://www.olympus-lifescience.com/en/software/cellsens/) and ImageJ (imagej.nih.gov) softwares.
Figure 7
Figure 7
Growth inhibition and defective progression of P. falciparum due to TMX treatment. (A) Graph showing growth inhibition of Pf3D7 and (B) PfRKL9 in presence of TMX with IC50 8.3 µM, (C) Graph showing percent inhibition in presence of TMX and chloroquine as positive control (D) Giemsa images showing hindered progression (44 hpi) and invasion (2nd cycle) of Pf3D7 with the relative percentages of ring formed and uninvaded merozoites in 2nd cycle of infection in control and TMX treated culture, scale bar represents distance of 5 µm (analysis of images by ImageJ; imagej.nih.gov) (E) Graph showing percent ratio of ring, trophozoite and schizonts at different time points post invasion for control and TMX treated culture. Data are represented as mean ± SD of at least three independent experiments.
Figure 8
Figure 8
Schematic showing interaction of apicortin with tubulins in absence and presence of TMX affecting parasite growth.

Similar articles

Cited by

References

    1. Trampuz A, Jereb M, Muzlovic I, Prabhu RM. Clinical review: Severe malaria. Crit. Care. 2003;7:315. doi: 10.1186/cc2183. - DOI - PMC - PubMed
    1. Mackintosh CL, Beeson JG, Marsh K. Clinical features and pathogenesis of severe malaria. Trends Parasitol. 2004;20:597–603. doi: 10.1016/j.pt.2004.09.006. - DOI - PubMed
    1. Bloland PB, Organization WH. Drug Resistance in Malaria. Geneva: World Health Organization; 2001.
    1. Klein E. Antimalarial drug resistance: A review of the biology and strategies to delay emergence and spread. Int. J. Antimicrob. Agents. 2013;41:311–317. doi: 10.1016/j.ijantimicag.2012.12.007. - DOI - PMC - PubMed
    1. Kappes, B. & Rohrbach, P. Microtubule inhibitors as a potential treatment for malaria. Future Microbiology2(4), 409–423 (2007). - PubMed

Publication types

MeSH terms

Substances

LinkOut - more resources