. 2021 Feb 25;11(1):4691.
doi: 10.1038/s41598-021-83913-7.

CIBERSORT analysis of TCGA and METABRIC identifies subgroups with better outcomes in triple negative breast cancer

Affiliations

CIBERSORT analysis of TCGA and METABRIC identifies subgroups with better outcomes in triple negative breast cancer

Kelly E Craven et al. Sci Rep. .

Abstract

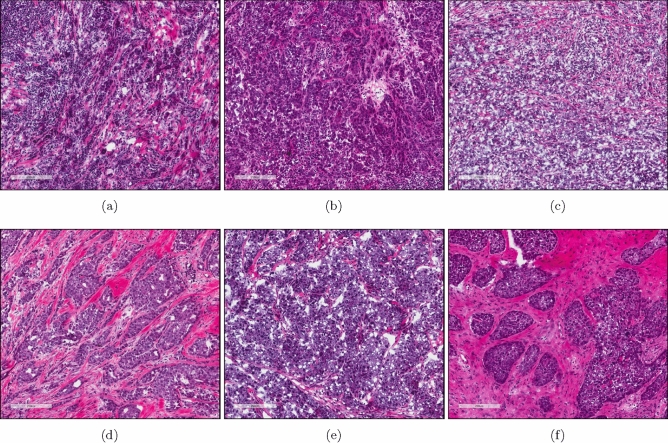
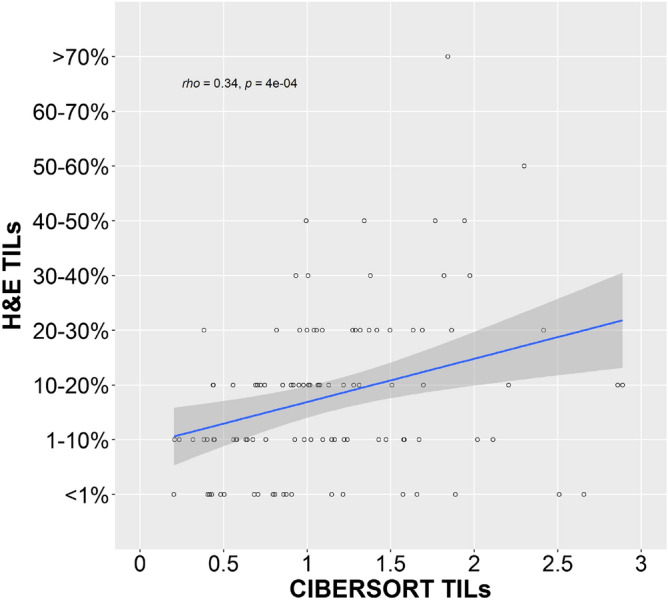
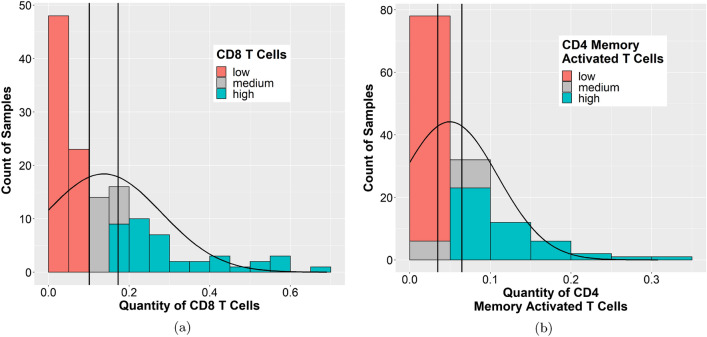
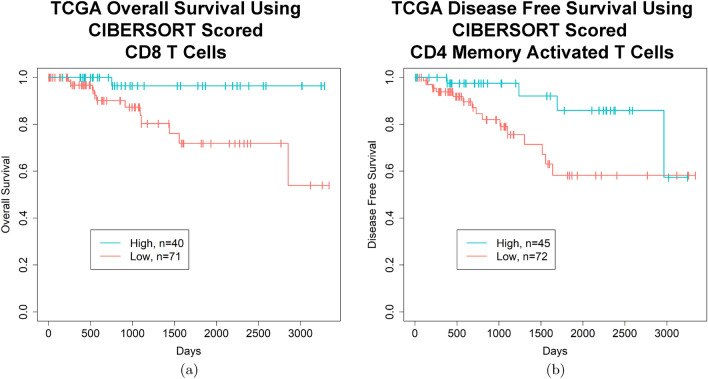
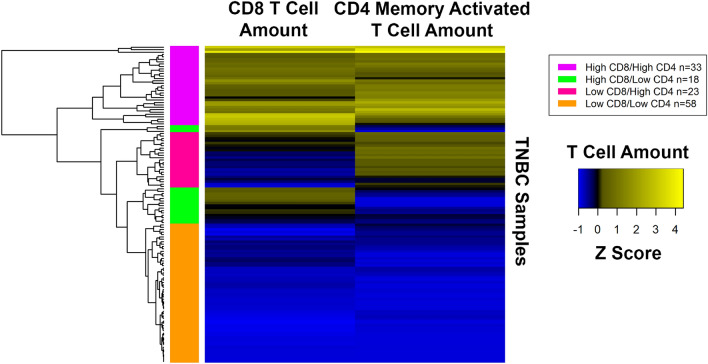
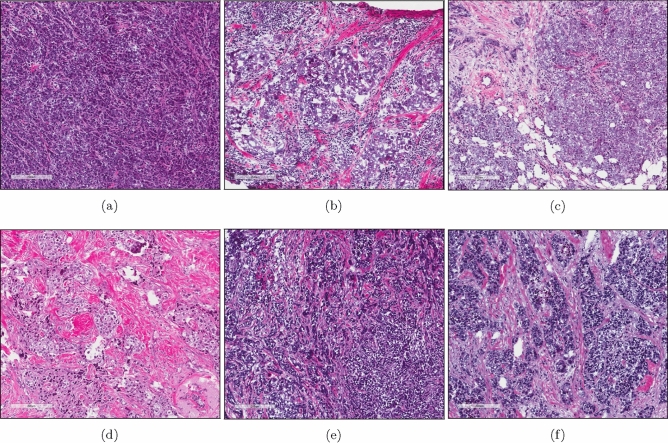
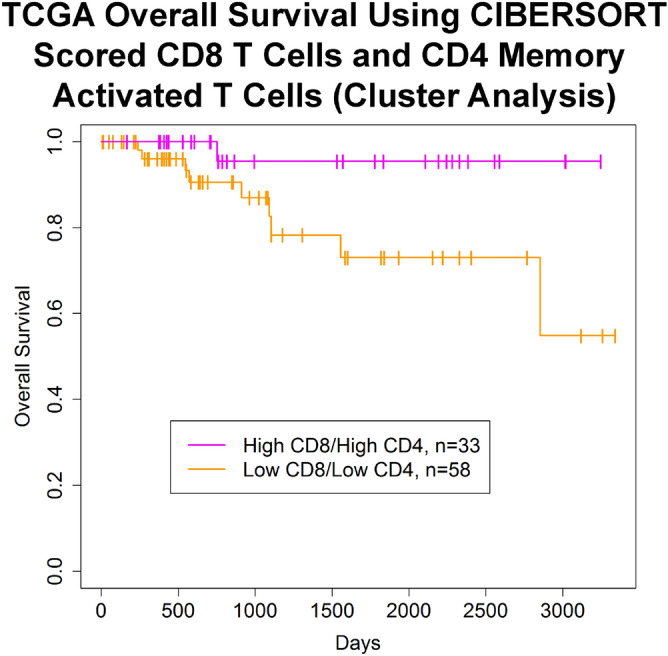
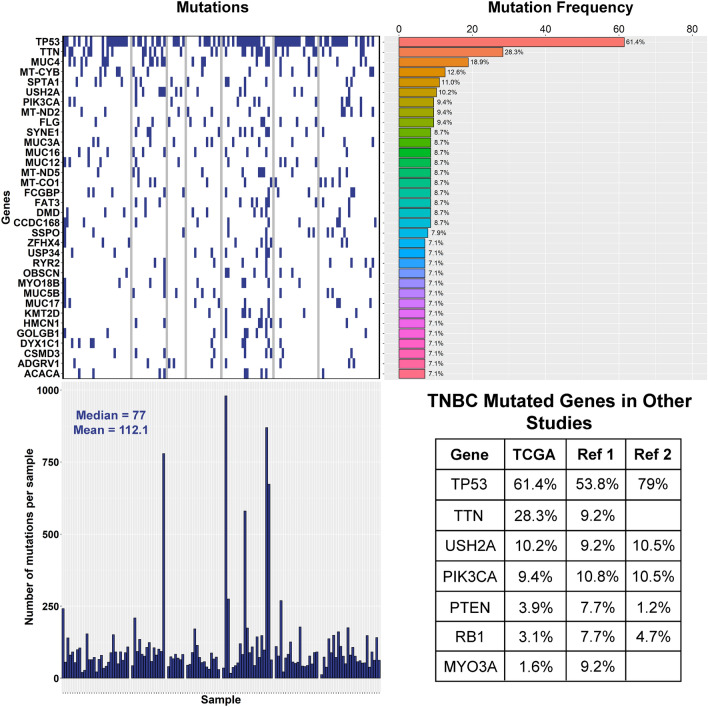
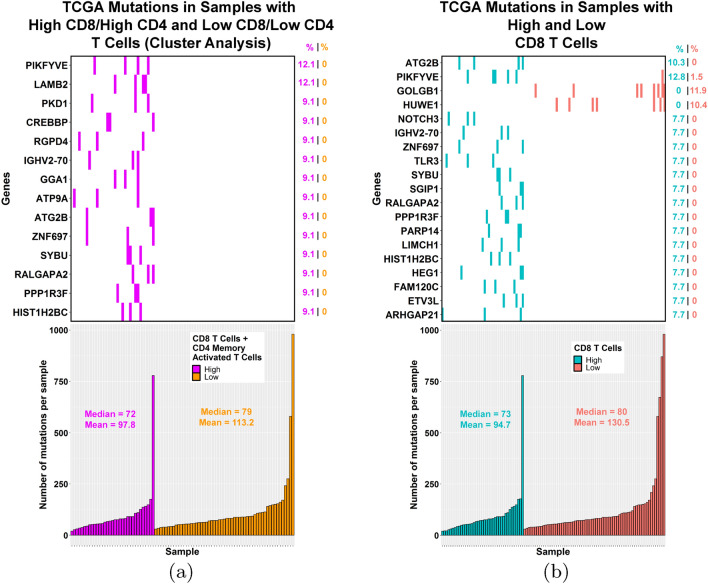
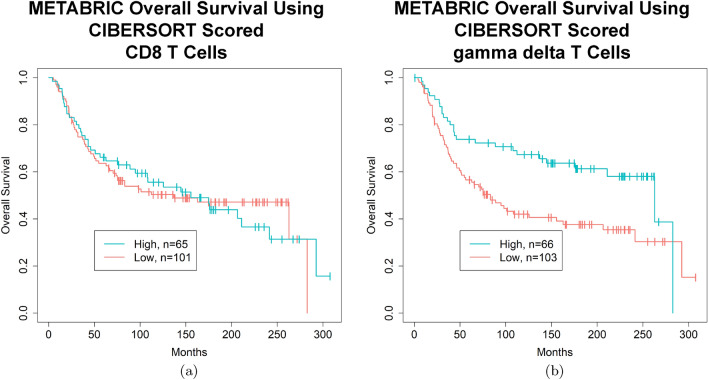
Studies have shown that the presence of tumor infiltrating lymphocytes (TILs) in Triple Negative Breast Cancer (TNBC) is associated with better prognosis. However, the molecular mechanisms underlying these immune cell differences are not well delineated. In this study, analysis of hematoxylin and eosin images from The Cancer Genome Atlas (TCGA) breast cancer cohort failed to show a prognostic benefit of TILs in TNBC, whereas CIBERSORT analysis, which quantifies the proportion of each immune cell type, demonstrated improved overall survival in TCGA TNBC samples with increased CD8 T cells or CD8 plus CD4 memory activated T cells and in Molecular Taxonomy of Breast Cancer International Consortium (METABRIC) TNBC samples with increased gamma delta T cells. Twenty-five genes showed mutational frequency differences between the TCGA high and low T cell groups, and many play important roles in inflammation or immune evasion (ATG2B, HIST1H2BC, PKD1, PIKFYVE, TLR3, NOTCH3, GOLGB1, CREBBP). Identification of these mutations suggests novel mechanisms by which the cancer cells attract immune cells and by which they evade or dampen the immune system during the cancer immunoediting process. This study suggests that integration of mutations with CIBERSORT analysis could provide better prediction of outcomes and novel therapeutic targets in TNBC cases.


Conflict of interest statement

The authors declare no competing interests.

Figures

Figure 1
Figure 1
Example H&E images of TCGA TNBC cases with > 30%. (ac) or < 30% (df) TILs as scored by a pathologist. (a) TCGA-A2-A0CM. (b) TCGA-S3-AA10. (c) TCGA-EW-A1OV. (d) TCGA-LL-A740. (e) TCGA-OL-A6VO. (f) TCGA-GI-A2C9. (a)–(f) Image captures made from TCGA image files opened with Aperio ImageScope 12.3.2.8013 (https://www.leicabiosystems.com/digital-pathology/manage/aperio-imagescope/).
Figure 2
Figure 2
Correlation between H&E scored and CIBERSORT scored TILs in TCGA TNBC cases. Comparison of H&E scored and CIBERSORT scored TILs in TCGA TNBC cases (n = 103) showed a Spearman rank correlation coefficient of 0.34 with a pvalue of 0.0004. The CIBERSORT score consists of arbitrary units that reflect the absolute proportion of immune cells in a mixture. A higher score would indicate a higher proportion of immune cells. Image generated with R 4.0.2 (https://www.R-project.org).
Figure 3
Figure 3
Distribution of the proportion of CD8 T cells or CD4 memory activated T cells across the TCGA TNBC cases. A histogram of the quantity of (a) CD8 T cells or (b) CD4 memory activated T cells present across the different TCGA TNBC samples was plotted using data generated by CIBERSORT. CIBERSORT assigns a score of arbitrary units that reflects the absolute proportion of each cell type in a mixture. A higher score would indicate a higher proportion of that cell type. Vertical lines represent the cut off (± 0.25 * standard deviation) used to create the “high” and “low” groups. (a) and (b) Images generated with R 4.0.2 (https://www.R-project.org).
Figure 4
Figure 4
Kaplan–Meier curves demonstrating improvements in OS or DFS in TCGA TNBC patients with high quantities of CD8 T cells or CD4 memory activated T cells in their tumor sample, respectively. (a) TCGA TNBC patients with a higher proportion of CD8 T cells in their tumor have a better OS (p = 0.013, FDR = 0.24, log rank test) (survival rates high vs. low, 5 year: 96.4% and 71.9%, 10 year: 96.4% and 53.9%). (b) TCGA TNBC patients with a higher proportion of CD4 memory activated T cells in their tumor sample have a better DFS (p = 0.034, FDR = 0.66, log rank test) (survival rates high vs. low, 5 year: 85.9% and 58.2%, 10 year: 57.3% and 58.2%). (a) and (b) High and low cut offs of T cell infiltrate were chosen as quantities above and below 0.25 times the standard deviation of the mean, respectively. (a) and (b) Images generated with R 4.0.2 (https://www.R-project.org).
Figure 5
Figure 5
Hierarchical clustering of CD8 T cell and CD4 memory activated T cell quantities in TCGA TNBC samples. RNA sequencing (RNA-Seq) gene expression data was analyzed with CIBERSORT to quantify the amount of different T cells in the TCGA TNBC samples. Hierarchical clustering of these quantities after normalization is shown in the heatmap. Clusters of samples enriched in CD4 memory activated T cells (deep pink cluster), CD8 T cells (green cluster), both cell types (magenta cluster), or neither cell type (orange cluster) are represented. Image generated with R’s (4.0.2) (https://www.R-project.org) gplots package (3.0.4) (https://CRAN.R-project.org/package=gplots).
Figure 6
Figure 6
Example H&E images of TCGA TNBC cases with a high quantity of T cells (CD8 and CD4 memory activated) (ac) or a low quantity of T cells (CD8 and CD4 memory activated) (df) as scored by RNA-Seq gene expression analysis by CIBERSORT. (a) TCGA-AO-A128. (b) TCGA-GM-A2DI. (c) TCGA-OL-A66I. (d) TCGA-A7-A26I. (e) TCGA-BH-A0AV. (f) TCGA-OL-A5RW. (a)–(f) Image captures made from TCGA image files opened with Aperio ImageScope 12.3.2.8013 (https://www.leicabiosystems.com/digital-pathology/manage/aperio-imagescope/).
Figure 7
Figure 7
Kaplan–Meier curve demonstrating improvements in OS in TCGA TNBC patients with high quantities of CD8 T cells and CD4 memory activated T cells in their tumor sample. TCGA TNBC patients with a higher amount of CD8 T cells and CD4 memory activated T cells in their tumor as compared to samples with a lower amount of both these cell types have a better OS (p = 0.037, FDR = 0.11, log rank test) (survival rates high vs. low, 5 year: 95.5% and 73.1%, 10 year: 95.5% and 54.8%). The high and low groups were identified according to the hierarchical clustering analysis in Fig. 5. Image generated with R 4.0.2 (https://www.R-project.org).
Figure 8
Figure 8
Top 34 gene mutations in TCGA TNBC cases. (Top left and right) Mutational analysis of the TNBC cases in TCGA identifies TP53 (61.4%), TTN (28.3%), MUC4 (18.9%), MT-CYB (12.6%), SPTA1 (11%), and USH2A (10.2%) as the most frequently mutated genes. (Bottom left) Median and mean mutation count are 77 and 112.1, respectively. (Bottom right) Mutation frequencies of several genes in TNBC as determined by this study (TCGA) or other whole genome or exome sequencing studies (Ref 1 =, Ref 2 =). (Top left and right, Bottom left) Images generated with R 4.0.2 (https://www.R-project.org). (Bottom right) Image generated with Adobe Photoshop CC 2018 (https://www.adobe.com).
Figure 9
Figure 9
Genes with significantly different mutation frequencies between TCGA TNBC samples with high or low T cells (CD8/CD4 memory activated or CD8). (a, top) 14 genes show significantly different mutation frequencies (p < 0.05, Fisher’s exact test) between the group enriched in both CD8 T cells and CD4 memory activated T cells as compared to the group low in these T cells. (a, bottom) Mutation counts were similar between the two groups. (b, top) 19 genes show significantly different mutation frequencies (p < 0.05, Fisher’s exact test) between the high and low CD8 T cell groups. (b, bottom) Mutation counts were similar between the high and low CD8 T cell groups. (a) and (b) Images generated with R 4.0.2 (https://www.R-project.org).
Figure 10
Figure 10
Kaplan–Meier curves demonstrating improvements in OS in METABRIC TNBC patients with high quantities of gamma delta T cells in their tumor sample. (a) METABRIC TNBC patients with a higher proportion of CD8 T cells in their tumor do not have a better OS (p = 0.98, FDR = 0.98, log rank test) (survival rates high vs. low, 5 year: 66.2% and 63.5%, 10 year: 55.6% and 50.3%). (b) METABRIC TNBC patients with a higher proportion of gamma delta T cells in their tumor sample have a better OS (p = 0.0059, FDR = 0.12, log rank test) (survival rates high vs. low, 5 year: 73.9% and 56.6%, 10 year: 67.3% and 42.0%). (a) and (b) High and low cut offs of T cell infiltrate were chosen as quantities above and below 0.25 times the standard deviation of the mean, respectively. (a) and (b) Images generated with R 4.0.2 (https://www.R-project.org).

Similar articles

Cited by

References

    1. Loi S, et al. Prognostic and predictive value of tumor-infiltrating lymphocytes in a phase III randomized adjuvant breast cancer trial in node-positive breast cancer comparing the addition of docetaxel to doxorubicin with doxorubicin-based chemotherapy: BIG 02–98. J. Clin. Oncol. 2013;31:860–7. doi: 10.1200/JCO.2011.41.0902. - DOI - PubMed
    1. Ibrahim EM, Al-Foheidi ME, Al-Mansour MM, Kazkaz GA. The prognostic value of tumor-infiltrating lymphocytes in triple-negative breast cancer: A meta-analysis. Breast Cancer Res. Treat. 2014;148:467–76. doi: 10.1007/s10549-014-3185-2. - DOI - PubMed
    1. Adams S, et al. Prognostic value of tumor-infiltrating lymphocytes in triple-negative breast cancers from two phase III randomized adjuvant breast cancer trials: ECOG 2197 and ECOG 1199. J. Clin. Oncol. 2014;32:2959–66. doi: 10.1200/JCO.2013.55.0491. - DOI - PMC - PubMed
    1. Loi S, et al. Tumor infiltrating lymphocytes are prognostic in triple negative breast cancer and predictive for trastuzumab benefit in early breast cancer: Results from the FinHER trial. Ann. Oncol. 2014;25:1544–50. doi: 10.1093/annonc/mdu112. - DOI - PubMed
    1. Dieci MV, et al. Prognostic and predictive value of tumor-infiltrating lymphocytes in two phase III randomized adjuvant breast cancer trials. Ann. Oncol. 2015;26:1698–704. doi: 10.1093/annonc/mdv239. - DOI - PMC - PubMed

Publication types