. 2021 Feb 25;11(1):4563.
doi: 10.1038/s41598-021-83677-0.

Real-time observation of microcirculatory leukocytes in patients undergoing major liver resection

Affiliations

Real-time observation of microcirculatory leukocytes in patients undergoing major liver resection

Zühre Uz et al. Sci Rep. .

Abstract

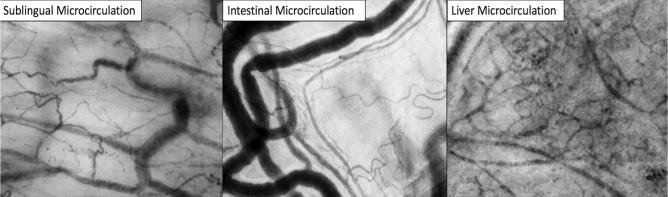
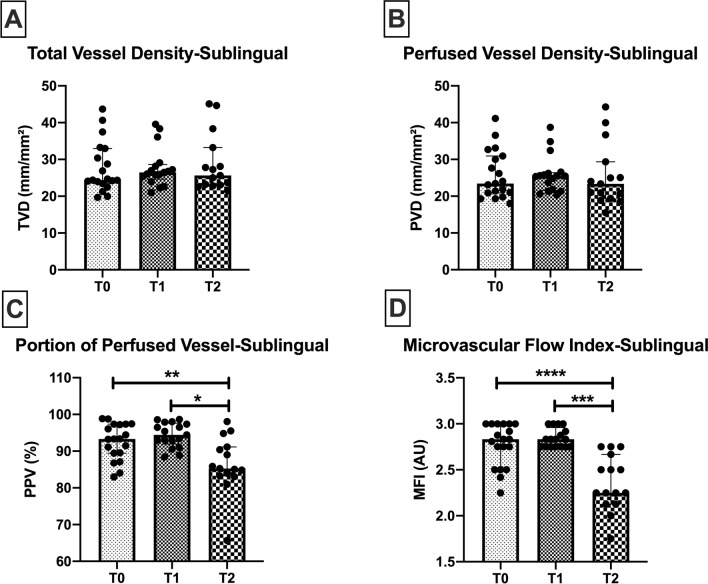
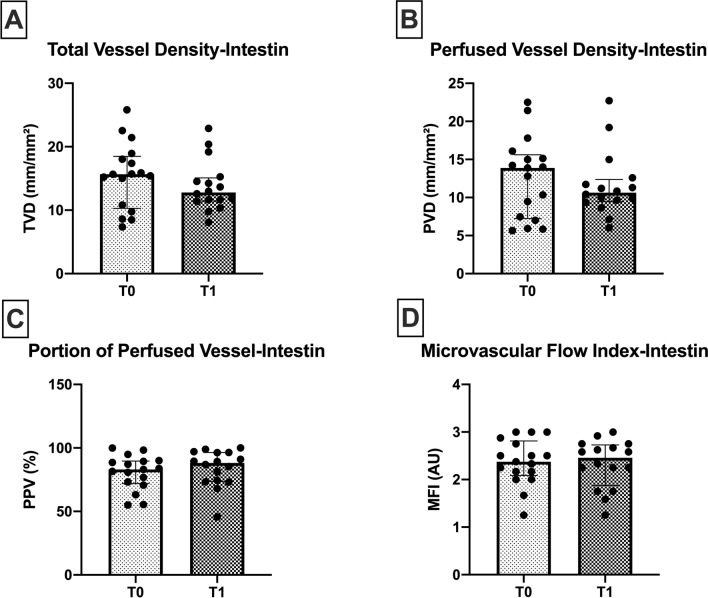
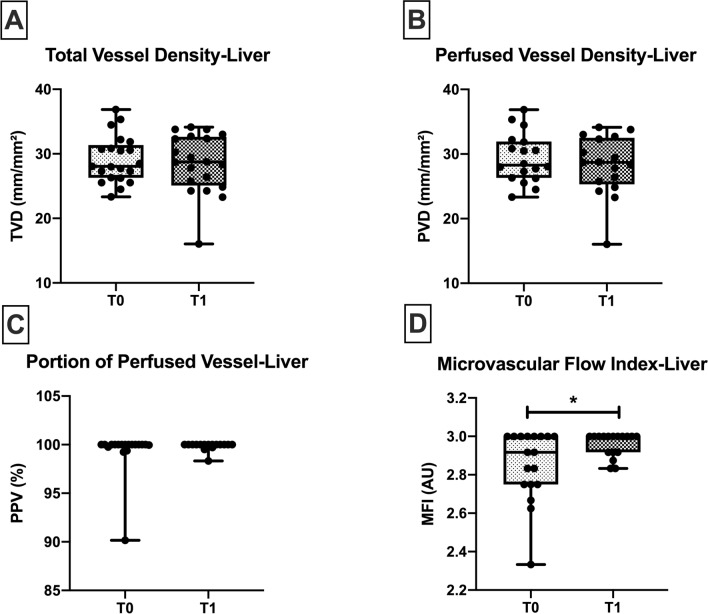
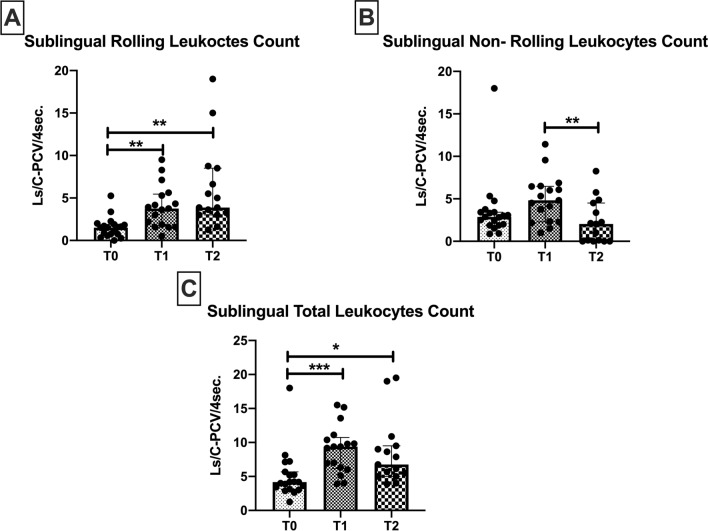
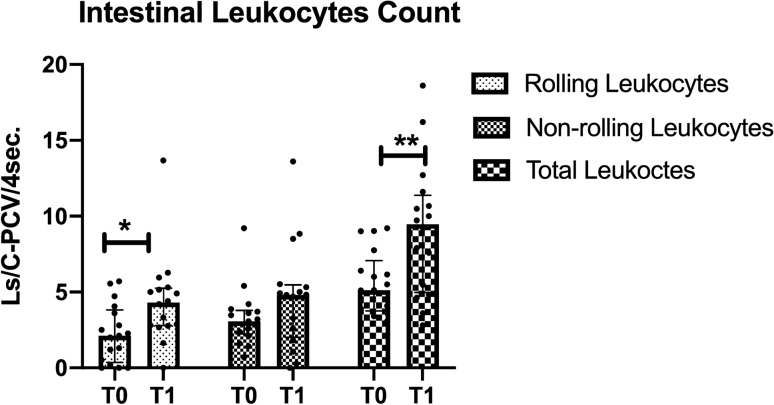
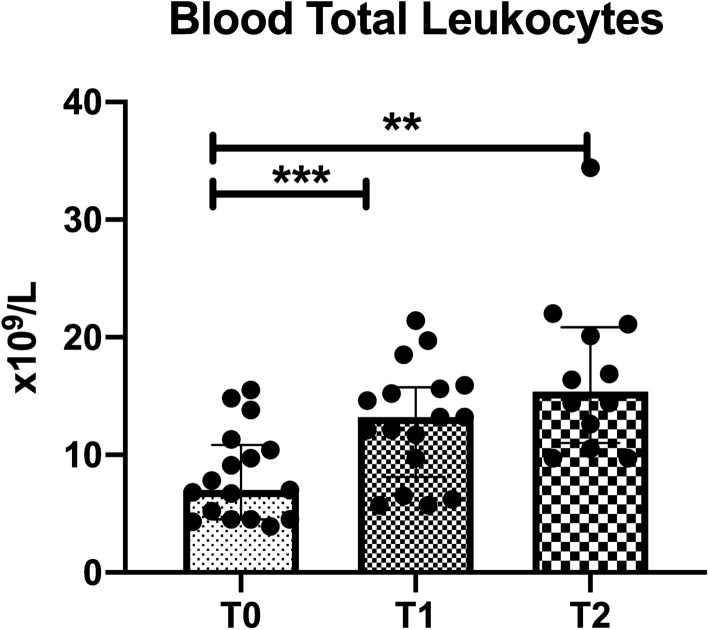
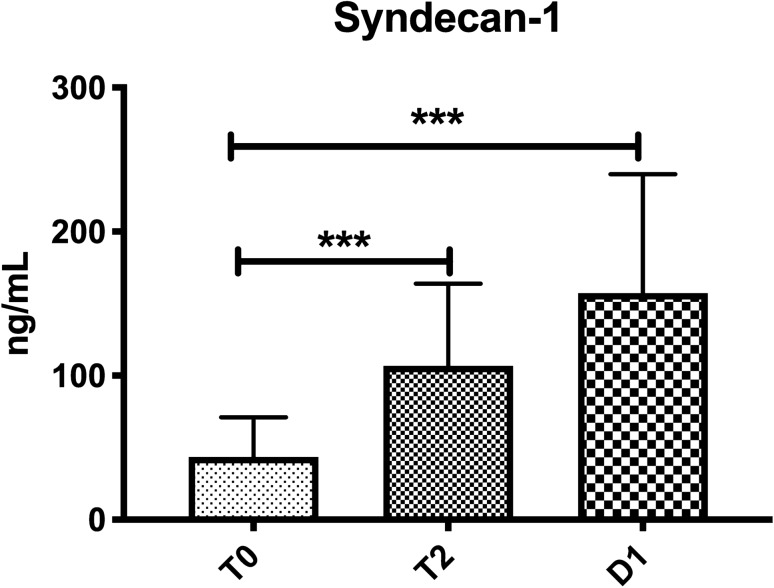
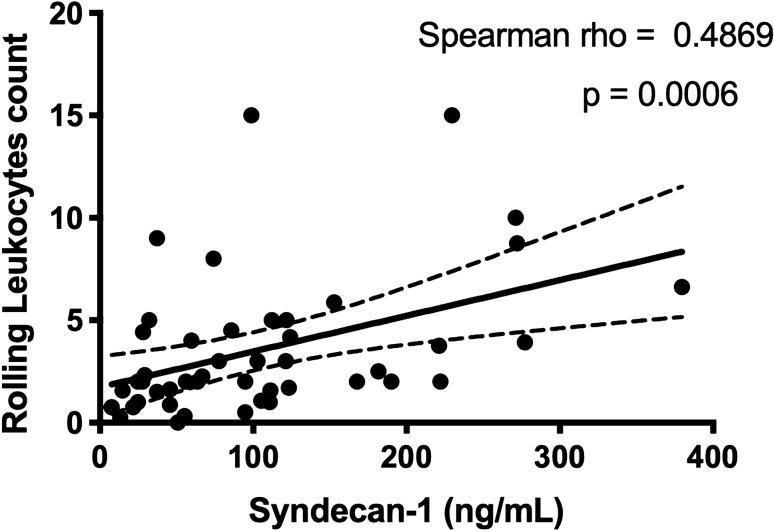
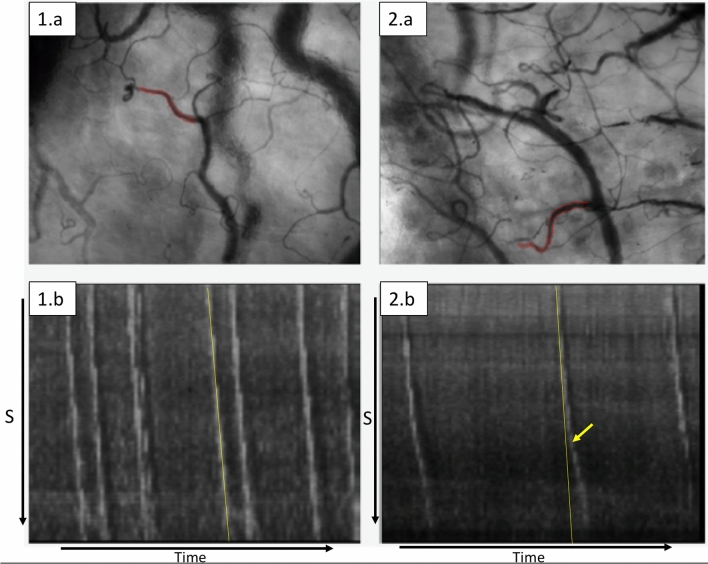
Ischemia/reperfusion injury and inflammation are associated with microcirculatory dysfunction, endothelial injury and glycocalyx degradation. This study aimed to assess microcirculation in the sublingual, intestinal and the (remnant) liver in patients undergoing major liver resection, to define microcirculatory leukocyte activation and its association with glycocalyx degradation. In this prospective observational study, the microcirculation was assessed at the beginning of surgery (T0), end of surgery (T1) and 24 h after surgery (T2) using Incident Dark Field imaging. Changes in vessel density, blood flow and leukocyte behaviour were monitored, as well as clinical parameters. Syndecan-1 levels as a parameter of glycocalyx degradation were analysed. 19 patients were included. Sublingual microcirculation showed a significant increase in the number of rolling leukocytes between T0 and T1 (1.5 [0.7-1.8] vs. 3.7 [1.7-5.4] Ls/C-PCV/4 s respectively, p = 0.001), and remained high at T2 when compared to T0 (3.8 [3-8.5] Ls/C-PCV/4 s, p = 0.006). The microvascular flow decreased at T2 (2.4 ± 0.3 vs. baseline 2.8 ± 0.2, respectively, p < 0.01). Duration of vascular inflow occlusion was associated with significantly higher numbers of sublingual microcirculatory rolling leukocytes. Syndecan-1 increased from T0 to T1 (42 [25-56] vs. 107 [86-164] ng/mL, p < 0.001). The microcirculatory perfusion was characterized by low convection capacity and high number of rolling leukocytes. The ability to sublingually monitor the rolling behaviour of the microcirculatory leukocytes allows for early identification of patients at risk of increased inflammatory response following major liver resection.


Conflict of interest statement

Prof. Dr. Ince has developed SDF imaging and is listed as an inventor on related patents commercialized by MicroVision Medical (MVM) under a license from the Academic Medical Centre (AMC). Prof. Dr.Ince receives no royalties or any benefits from this license. He has been a consultant for MVM in the past, but has not been involved with this company for more than 7 years now and holds no shares or stock. Braedius Medical, a company owned by a relative of Prof. Dr. Ince, has developed and designed a third generation handheld microscope called CytoCam-IDF imaging. Prof. Dr. Ince has no financial relation with Braedius Medical of any sort, i.e., never owned shares, or received consultancy or speaker fees from Braedius Medical. Prof. Dr. Ince runs an internet site https://microcirculationacademy.org which offers services (e.g. training, courses, analysis) related to clinical microcirculation. The other authors declare that they have no competing interests.

Figures

Figure 1
Figure 1
Screenshots of sublingual, intestinal and liver microcirculation, respectively, obtained by incident dark field handheld video microscopy. Dimensions of the field of view of the microcirculatory images is 1.55 mm × 1.16 mm.
Figure 2
Figure 2
Sublingual microcirculation. Sublingual microcirculatory parameters at the beginning of surgery (T0), end of surgery (T1) and 24 h after surgery (T2) in 19 patients. Sublingual portion of perfused vessel and microvascular flow index (MFI) decrease 24 h after surgery. TVD total vessel density, PVD perfused vessel density, PPV portion of perfused vessel, MFI microvascular flow index. Values are represented as median [interquatile] for TVD, PVD and MFI and mean ± SD for PPV, *p < 0.05, **p < 0.01, ***p < 0.001, ****p < 0.0001.
Figure 3
Figure 3
Intestinal microcirculation. Intestinal microcirculatory parameters at the beginning of surgery (T0) and end of surgery (T1) in 18 patients. No significant differences were observed in microcirculatory density nor flow in the perioperative period. TVD; total vessel density. PVD; perfused vessel density. PPV; portion of perfused vessel. MFI; microvascular flow index. Values are represented as median [interquatile] for PVD and PPV and mean ± SD for TVD and MFI.
Figure 4
Figure 4
Liver microcirculation. Liver microcirculatory parameters at the beginning of surgery (T0) and end of surgery (T1). A significant increase was found in the hepatic MFI from T0 to T1 in 18 patients. TVD; total vessel density. PVD perfused vessel density, PPV portion of perfused vessel, MFI microvascular flow index. Values are represented as median [interquatile] for PVD and MFI and mean ± SD for TVD and PVD, *p < 0.05.
Figure 5
Figure 5
Leukocyte quantification in the sublingual area assessed at the beginning of surgery (T0), end of surgery (T1) and 24 h after surgery (T2). The microcirculatory rolling leukocytes count increased during the time course. Values are represented as median [interquatile] *p < 0.05, **p < 0.01, ***p < 0.001.
Figure 6
Figure 6
Leukocyte quantification in the intestinal serosa assessed at the beginning of surgery (T0) and end of surgery (T1). The microcirculatory rolling leukocytes count increased during surgery. Values are represented as median [interquatile], *p < 0.05, **p < 0.01.
Figure 7
Figure 7
Leukocyte quantification within the systemic circulation (c) assessed at the beginning of surgery (T0), end of surgery (T1) and 24 h after surgery (T2). The systemic white blood cell count increased during the time course. Values are represented as mean ± SD, **p < 0.01, ***p < 0.001.
Figure 8
Figure 8
Syndecan-1 levels measured in blood at the beginning of surgery (T0), the end of surgery (T1) and 24 h later (T2). Syndecan-1 was increased at the end of surgery (T1) and this increase persisted at T2 (24 h). Values are represented as median [interquartile, ***p < 0.001.
Figure 9
Figure 9
Correlation between Syndecan-1 and sublingual microcirculatory rolling leukocytes. Syndecan-1 levels and the sublingual microcirculatory rolling leukocyte counts show a significant but moderate correlation.
Figure 10
Figure 10
Screenshots of sublingual microcirculation obtained by incident dark-field imaging and examples of space–time diagrams generated from the microvascular units indicated in red in the images. (1.a) Example of sublingual microcirculation. In this image, one capillary-post-capillary venule unit is shown by the redlined outlines of the vessel walls. Dimensions of the field of view of the sublingual microcirculation screenshot is 1.55 mm × 1.16 mm. (1.b) Shows the generated space–time diagram of the capillary-post capillary venule. The space–time diagram shows several straight white bands, indicating non-rolling leukocytes flowing through the capillary and post capillary venule without rolling or contact with the vessel wall. The white band is a straight line, corresponding with the straight yellow, control line. (2.a) Example of sublingual microcirculation. In this image, one capillary-post capillary venule unit is shown by the redlined outlines of the vessel walls. Dimensions of the field of view of this sublingual microcirculation screenshot is 1.55 mm × 1.16 mm. (2.b) Shows the generated space–time diagram of the capillary-post capillary venule. The space–time diagram shows several white bands that are not straight, indicating rolling leukocytes flowing through the capillary and getting into contact with the endothelial wall in the post capillary venule part. The white band is slanted, and the straight yellow line drawn on it, does not fit the white band of this rolling leukocyte. The yellow arrow shows the start of the slanting of the white band, this is also the moment at which the white band is not straight anymore due to significant change in the velocity of the leukocyte by rolling or adherence to the endothelium. S the axis of the space–time diagram for space, Time the axis of the space–time diagram indicating the time.

Similar articles

Cited by

References

    1. Jarnagin WR, Gonen M, Fong Y, DeMatteo RP, Ben-Porat L, et al. Improvement in perioperative outcome after hepatic resection: Analysis of 1803 consecutive cases over the past decade. Ann. Surg. 2002;236(4):397–406. doi: 10.1097/00000658-200210000-00001. - DOI - PMC - PubMed
    1. van Gulik TM, de Graaf W, Dinant S, Busch ORC, Gouma DJ. Vascular occlusion techniques during liver resection. Dig. Surg. 2007;24(4):274–281. doi: 10.1159/000103658. - DOI - PubMed
    1. Man K, Liang T-B, Lo C-M, Liu C-L, Ng IO-LY, et al. Hepatic stress gene expression and ultrastructural features under intermittent Pringle manoeuvre. Hepatobil. Pancreat. Dis. Int. 2002;1(2):249–257. - PubMed
    1. Torzilli G, Procopio F, Donadon M, Del Fabbro D, Cimino M, et al. Safety of intermittent Pringle maneuver cumulative time exceeding 120 minutes in liver resection: A further step in favor of the “radical but conservative” policy. Ann. Surg. 2012;255(2):270–280. doi: 10.1097/SLA.0b013e318232b375. - DOI - PubMed
    1. Bagante F, Ruzzenente A, Beal EW, Campagnaro T, Merath K, et al. Complications after liver surgery: A benchmark analysis. HPB. 2019;10:20. - PubMed

Publication types

LinkOut - more resources