

Green tea extracts containing epigallocatechin-3-gallate modulate facial development in Down syndrome
- PMID: 33633179
- PMCID: PMC7907288
- DOI: 10.1038/s41598-021-83757-1
Green tea extracts containing epigallocatechin-3-gallate modulate facial development in Down syndrome
Abstract
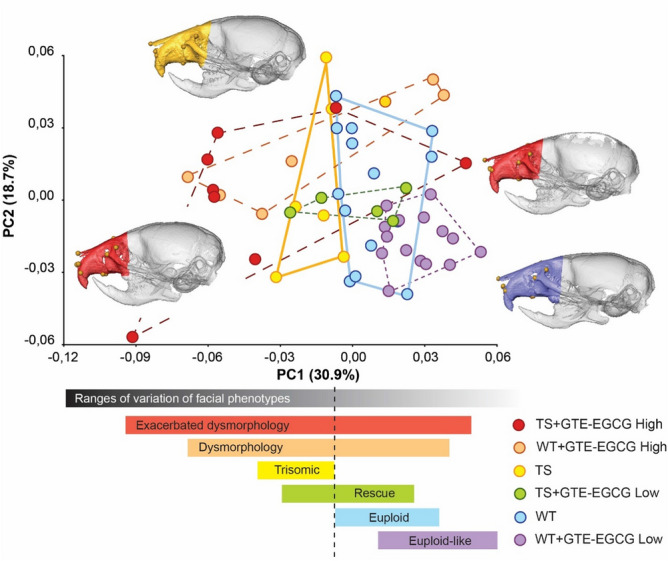
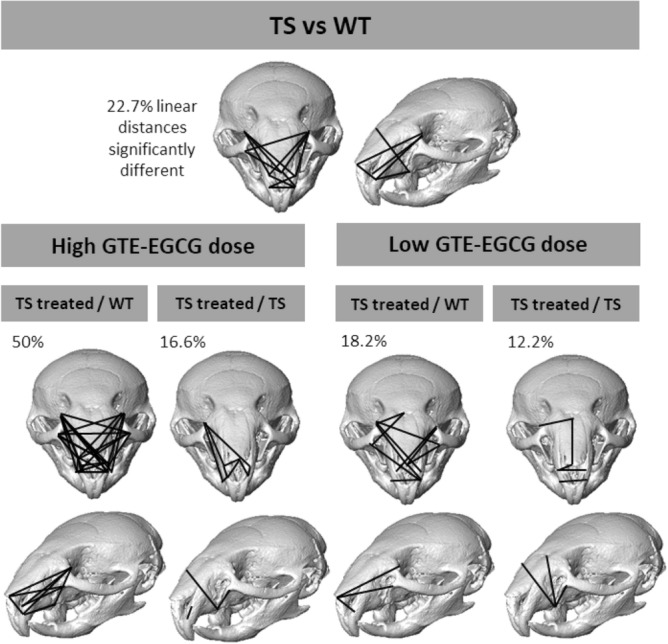
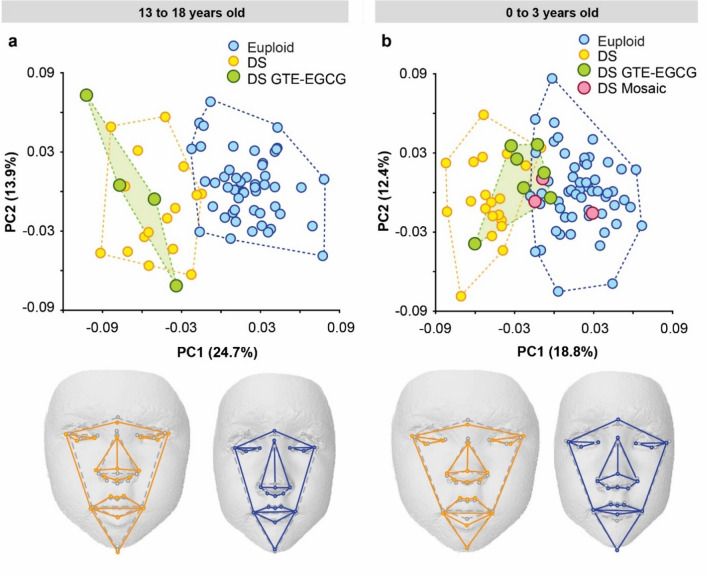
Trisomy of human chromosome 21 (Down syndrome, DS) alters development of multiple organ systems, including the face and underlying skeleton. Besides causing stigmata, these facial dysmorphologies can impair vital functions such as hearing, breathing, mastication, and health. To investigate the therapeutic potential of green tea extracts containing epigallocatechin-3-gallate (GTE-EGCG) for alleviating facial dysmorphologies associated with DS, we performed an experimental study with continued pre- and postnatal treatment with two doses of GTE-EGCG supplementation in a mouse model of DS, and an observational study of children with DS whose parents administered EGCG as a green tea supplement. We evaluated the effect of high (100 mg/kg/day) or low doses (30 mg/kg/day) of GTE-EGCG, administered from embryonic day 9 to post-natal day 29, on the facial skeletal development in the Ts65Dn mouse model. In a cross-sectional observational study, we assessed the facial shape in DS and evaluated the effects of self-medication with green tea extracts in children from 0 to 18 years old. The main outcomes are 3D quantitative morphometric measures of the face, acquired either with micro-computed tomography (animal study) or photogrammetry (human study). The lowest experimentally tested GTE-EGCG dose improved the facial skeleton morphology in a mouse model of DS. In humans, GTE-EGCG supplementation was associated with reduced facial dysmorphology in children with DS when treatment was administered during the first 3 years of life. However, higher GTE-EGCG dosing disrupted normal development and increased facial dysmorphology in both trisomic and euploid mice. We conclude that GTE-EGCG modulates facial development with dose-dependent effects. Considering the potentially detrimental effects observed in mice, the therapeutic relevance of controlled GTE-EGCG administration towards reducing facial dysmorphology in young children with Down syndrome has yet to be confirmed by clinical studies.
Conflict of interest statement
The authors declare no competing interests.
Figures

Similar articles
-
Green Tea Catechins Modulate Skeletal Development with Effects Dependent on Dose, Time, and Structure in a down Syndrome Mouse Model.Nutrients. 2022 Oct 7;14(19):4167. doi: 10.3390/nu14194167. Nutrients. 2022. PMID: 36235819 Free PMC article.
-
Usage of and attitudes about green tea extract and Epigallocathechin-3-gallate (EGCG) as a therapy in individuals with Down syndrome.Complement Ther Med. 2019 Aug;45:234-241. doi: 10.1016/j.ctim.2019.07.002. Epub 2019 Jul 2. Complement Ther Med. 2019. PMID: 31331567 Free PMC article.
-
Epigallocatechin-3-gallate (EGCG) consumption in the Ts65Dn model of Down syndrome fails to improve behavioral deficits and is detrimental to skeletal phenotypes.Physiol Behav. 2017 Aug 1;177:230-241. doi: 10.1016/j.physbeh.2017.05.003. Epub 2017 May 3. Physiol Behav. 2017. PMID: 28478033 Free PMC article.
-
Safety assessment of green tea based beverages and dried green tea extracts as nutritional supplements.Toxicol Lett. 2017 Aug 5;277:104-108. doi: 10.1016/j.toxlet.2017.06.008. Epub 2017 Jun 24. Toxicol Lett. 2017. PMID: 28655517 Review.
-
United States Pharmacopeia (USP) comprehensive review of the hepatotoxicity of green tea extracts.Toxicol Rep. 2020 Feb 15;7:386-402. doi: 10.1016/j.toxrep.2020.02.008. eCollection 2020. Toxicol Rep. 2020. PMID: 32140423 Free PMC article. Review.
Cited by
-
Catechins as a Potential Dietary Supplementation in Prevention of Comorbidities Linked with Down Syndrome.Nutrients. 2022 May 12;14(10):2039. doi: 10.3390/nu14102039. Nutrients. 2022. PMID: 35631180 Free PMC article. Review.
-
Effect of Postnatal Epigallocatechin-Gallate Treatment on Cardiac Function in Mice Prenatally Exposed to Alcohol.Antioxidants (Basel). 2023 May 9;12(5):1067. doi: 10.3390/antiox12051067. Antioxidants (Basel). 2023. PMID: 37237934 Free PMC article.
-
DYRK1A inhibitors leucettines and TGF-β inhibitor additively stimulate insulin production in beta cells, organoids, and isolated mouse islets.PLoS One. 2023 May 17;18(5):e0285208. doi: 10.1371/journal.pone.0285208. eCollection 2023. PLoS One. 2023. PMID: 37195917 Free PMC article.
-
Dyrk1a from Gene Function in Development and Physiology to Dosage Correction across Life Span in Down Syndrome.Genes (Basel). 2021 Nov 20;12(11):1833. doi: 10.3390/genes12111833. Genes (Basel). 2021. PMID: 34828439 Free PMC article. Review.
-
Green Tea Catechins Modulate Skeletal Development with Effects Dependent on Dose, Time, and Structure in a down Syndrome Mouse Model.Nutrients. 2022 Oct 7;14(19):4167. doi: 10.3390/nu14194167. Nutrients. 2022. PMID: 36235819 Free PMC article.
References
-
- Oliveira ACB, Paiva SM, Campos MR, Czeresnia D. Factors associated with malocclusions in children and adolescents with Down syndrome. Am. J. Orthod. Dentofacial. Orthop. 2008;133(489):e1–8. - PubMed
Publication types
MeSH terms
Substances
LinkOut - more resources
Full Text Sources
Other Literature Sources
Medical
Molecular Biology Databases
